

Abstract

Due to their contrasting physical properties, joining materials like copper and aluminum has always proven difficult. The disadvantages of traditional joining methods include additional weight, solidification problems, and energy waste. Friction stir spot-welding (FSSW) was utilized for joining copper and aluminum in order to get around these difficulties. This study illustrates that friction stir spot-welding (FSSW) produces joints between incompatible copper and aluminum alloys with better mechanical and electrical properties. The numerous FSSW parameters play an important role in deciding how well the welded joint performs. Tool rotational speed (TRS), plunge rate (PR), and dwell duration (DT) are the study parameters. During manufacture, a case-hardened H13 tool was used to lap-joint AA 6061 T6 hot-rolled aluminum flat strips with C11000 copper strips while operating at three different levels of TRS, PR and DT. SEM analysis was utilized to investigate the interface region and bimetallic interface of the joints. In order to demonstrate modifications in the grain-related characteristics, the joints were examined for electrical conductivity, mechanical strength (lap shear, bending, and microhardness test), and analysis of the microstructure at the weld zones. The outcome demonstrates that other factors, such as plunge rate, dwell time, and tool rotation speed, had the greatest impact on the joints’ electrical conductivity, mechanical strength, and microstructure.
1. Introduction
Welding of dissimilar metals has gained more attention since its importance and application are in great demand in the industrial sector. Solid state welding ensures ease of welding dissimilar metals, namely aluminum and copper.1,2 Metallurgical incompatibility and postprocessing requirements with traditional welding techniques are addressed with the solid-state welding process.3,4 In addition, solid-state welding techniques offer a high strength-to-weight ratio, formability, and high speed of operation in joining parts. Friction stir spot-welding (FSSW) does not require lateral tool movement to produce such joints.5 The discontinuity in the mechanical and technical qualities of the materials to be welded (such as high-temperature strength, plastic deformation capacity, viscosity, etc.) across the abutting surfaces is a significant challenge when connecting dissimilar Al-alloys by FSW/FSSW. The material flow behavior in dissimilar welding exhibits a higher degree of asymmetry due to this discontinuity as well as intrinsic asymmetries in heat generation and material flow of FWS/FSSW processes. Nevertheless, compared to FSW of dissimilar material combinations with greatly different properties, such as Al-alloy to Mg-alloy or Al-alloy to steel, it is considerably simpler to apply the FSW/FSSW method to dissimilar Al-alloys.6 While using the traditional FSSW method, it can be somewhat difficult to get improved mechanical characteristics across dissimilar metals. The joint created by the FAFSSW technique has a tensile shear strength that is 34% higher than that of the joint created by the FSSW process. The Mg filler mixes well in the weld zone, according to the microstructure study, and a fine grain structure is obtained lacking any defects.7 Because of the pin and shoulder, friction at the shoulder contact was incomplete, and a deflection copper sheet formed around the weld nugget. Shear strength could not be achieved because the dissimilar weld joint areas forming tend to an incomplete joining when a Pin on Shoulder attempts to build a joint just around the Pin.8 Due to the absence of any hard phases, precipitates, or particular dominating alloying elements in pure copper, the thermo mechanically affected zone (TMAZ) does not develop. Actually, the distorted grains purportedly seen in TMAZ are recrystallized and found to have a microstructure similar to stir zone (SZ) or base material in these types of materials.9 A computational fluid dynamics (CFD) technique that can be used to simulate the mixing of materials in different FSW is the coupled Eulerian-Lagrangian method. The technique tracks the motion of the welding tool and the material particles in the Lagrangian frame of reference while solving the governing equations of fluid flow and heat transfer in the Eulerian frame of ref (10). The mechanical characteristics, hardness, and grain size of a friction stir welding joint are primarily determined by traverse speed; shoulder diameter, tool pin shape, and rotating speed are the next-to-fourth most significant parameters.11 Two separate zones inside the SZ, one of which is filled primarily with Al2Cu intermetallic near the aluminum sheet and the other with Al4Cu9 intermetallic near the brass sheet. Furthermore, the quantity of intermaterial mixing is greatly reduced when the tool traverse speed is increased. On the other hand, the production of intermetallic phases, which weakens the joint’s mechanical qualities, is constrained.12 By speeding up the welding process or slowing the rotation, the strain on the weld cross-section has been reduced. The strain also decreases when the temperature drops because there is less material flow.13
In electrical conductors, replacing copper with aluminum reduces self-weight in aircraft and industrial parts structures.13−15 Attempts are made to improve the mechanical and microstructure of Al–Cu joints fabricated with the FSW process.16−18 FSW parameters significantly affect Al–Cu joints’ mechanical and microstructure properties.19−21 The weld strength was most significantly impacted by the rotation speed, which rises as rotation speed increases.22 Many research studies have reported on mechanical and microstructure properties improvisation with various friction stir techniques.23 Therefore, attempts are required to test FSSW joints regarding electrical suitability and mechanical stability to produce defect-free parts, ensuring better service life.
FSW parameter’s effect on conductivity and microstructure of Al–Cu butt joints was analyzed.24 The microstructure of the FSSW joints revealed a contrast between the copper and aluminum materials as well as the existence of a copper ring (hook) in each and every spot-weld that was created. In the majority of the welds, copper particles were found in the matrix of aluminum.25 Due to the heat input generated by the rotating pin, the hardness increases at the bottom region of the pinhole (in copper material). Higher hardness at the copper side results from increased heat input and smaller grains as the plunge depth rises.26 As the FSW was carried out at a low tool rotation rate, the fracture developed at the cavity defect on the advancing side of the joint, whereas when the tool rotation rate was very high, it developed on the retreating side.27 All of the friction stir spot-welds experienced a nugget pull-out failure mode when subjected to lap-shear loading. The majority of the samples had high Vickers microhardness peaks close to the keyhole, which was indicative of intermetallic in the stir zone of the welds.28 The strength of the friction stir spot-welded bimetallic joints of AA6061 Aluminum Alloy and Copper Alloy was enhanced.29 Utilizing response graphs and contour plots, design expert software was utilized to optimize the friction stir spot-welding process variables. The developed empirical relations were used to estimate the tensile shear failure load and interface hardness of the dissimilar Al 5083-C 10100 joints with a 95% confidence level. Using contour plots, the ideal conditions for friction stir spot-welding Al 5083-C 10100 joints were assessed.30 Identical FSSW exhibit shear fracture in the presence of microvoids/dimples elongated along the loading direction, whereas Cu–Al dissimilar joints exhibit intermetal1lic compound creation and quasi-cleavage fracture.31 The excessive mechanical deformation indicates cracks formed due to wear of both aluminum and copper material due to a tool and material interaction. The severe mechanical deformation suggests that cracks developed as a result of tool and material contact on both FSSW of copper and aluminum material wear.32 Al4Cu9, AlCu3, Al2Cu3, and Al2Cu were the intermetallic compounds that formed most frequently in the stir zone of FSSW samples.33 The operating windows developed shall act as reference maps for future design engineers in choosing appropriate friction stir spot-welding process parameter values to obtain good joints.34 High electrical resistivity (ranges between 0.029 and 0.036 μΩ) and thick intermetallic compound layers (say, 0.66 μm) cause more heat input at the bimetallic region because low traverse speed was reported. FSW of square-butt configured Al–Cu joints is fabricated with varied tool traverse speeds.35 Tool traverse speed operating between 70 and 80 mm/min resulted in a defect-free stir zone and offered a better strength of 113 MPa. Metallographic examination revealed a thin continuous intermetallic layer, i.e., Al2Cu, AlCu and Al4Cu9. FSSW factors (TRS, DT, pin length, and plunge depth (PD)) effect on weld strength of Al–Cu joints was investigated.36 Two-level factorial experiments are designed to examine welding strengths suitable for electrical applications. Welding strength increases up to the specific value of TRS and decreases steeply due to increased temperature, causing a molten pool at the weld zone and resulting in tool slippage. Metallographic observations showed that copper rings are extruded from the bottom to the top face. FSSW of the Al–Cu weld interface zone was studied by applying the molecular dynamics concept to know the intermetallic and dislocations formation.37 Results showed that the fraction of Al particles dispersed deeply in the Cu matrix resulted in a diffusion coefficient that was 59% higher than Cu. FSW of Al 2024 and copper plates (100 × 60 × 2 mm) with Zn thin foil (0.1–0.3 mm) as an interlayer are processed to prepare joints with the experimental condition (TRS: 950 rpm, TS: 85 mm/min, PD: 0.05 mm, tool tilt angle: 2°).38 Metallographic examination revealed the presence of a Zn interlayer in the joint showed improved welding strength and reduced the negative impact of intermetallic compounds (Al4.2Cu3.2Zn0.7, CuZn5 and Cu5Zn8). In addition, the Zn interlayer alters the lamellar structure to be wavy. FSSW is applied to limit the growth of brittle intermetallic compounds at dissimilar metal weld interfaces.39 Hardness increases from 55 to 78 HV, with an increase in tool rotation speed in AA 6061-Cu sheets (thickness of Al and Cu 1.5 mm and 1 mm) with Zn foil (thickness is 0.1 mm) interlayer processed viz. FSSW.40 The presence of brittle phases and Cu particle segregation resulted in premature failure of joints. FSSW of AA2024-Cu with Zn foil as interlayer is done to analyze two factors (TRS and DT) on intermetallic compounds formed.41 Intermetallic compound (brittle Al2Cu phases) growth at the joint surface leads to reduced strength due to increased heat input caused by increased TRS and DT. FSSW of Al 1060- T2 Cu sheets are processed to fabricate joints with different TRS and DT.42,43 Higher TRS causes low torque with a high peak temperature, resulting in material softening and forming CuAl2-CuAl-Al4Cu9 intermetallic compounds. Similar intermetallic compounds were observed with higher DT.44 The thickness of intermetallic layers affects the strength of the joints.45
The detailed literature review confirms many research works focused on studying the effect of one or two process variables (without varying simultaneously, which might result in local strength or properties) on the Al–Cu joint properties (mechanical and microstructure). Only a little work has been reported to describe the effect of the factors on the electrical conductivity of the Al–Cu joints. The detailed insight of analyzing electrical conductivity relationships without hindering mechanical strength and microstructure of bimetallic joint interfaces is of industrial relevance to replace Cu with Al suitable for electric conductors and structural applications. The current research objective seeks to investigate the electrical and mechanical characteristics of friction stir spot-welded lap joints by substituting aluminum (AA 6061) for copper (C11000), a metal that is appropriate for electrical conductors and structural applications. For the joint’s fabrication, various process variables, such as tool rotating speed, plunge rate, and dwell duration, were taken into account. Statistical analysis was performed to know the process variables’ influence on electrical conductivity, lap shear strength, and flexural strength of Al–Cu joint properties. The parameters that maximize the electrical conductivity, strengths, and microhardness of Al–Cu joints were examined. The microstructures of optimized parametric conditions are discussed, with different zones formed at the joints. The electrical conductivity relationship with shear strength and flexural strength was examined and evaluated with a correlation coefficient value. Furthermore, the formation and influence of intermetallic compounds on the weld strength are vital points to be studied while selecting this method as the fabrication method in the electrification of space vehicles. Friction stir spot-welding can help to improve the performance and sustainability of a wide range of industries by creating new products and components that are lighter, more efficient, more robust, and more damage-resistant. The continued development of FSSW technology is likely to lead to new and innovative applications for this versatile welding process.
2. Materials and Experimental Method
2.1. Materials
Base materials (AA 6061-T6 and C11000 Cu) possessing dimensions (length × width × thickness: 90 mm × 25 mm × 1.6 mm) were selected as suitable for FSSW. The overlap distance of 30 mm focused toward the lap weld configuration. The weld joint configuration was finalized after consulting the literature and experts’ advice from industries. H13 tool steel material (cylindrical pinned tool configuration: length × shoulder diameter × pin diameter: 100 mm × 15 mm× 3 mm) is approximately similar to that of AISI tool steel due to high toughness, fatigue resistance, and cold working operations. The specimens for the metallographic investigation were cut into the necessary sections from the base metal and weld metal regions of the joint, and they were polished with various emery paper grades. The disc-polishing machine’s diamond compound (1 m particle size) was used for the final polishing. Keller’s reagent was used to etch the specimens so that the microstructure could be observed.
Tables 1 and 2 provide the elemental composition of welding materials (AA6061 T6 and C11000) and the tool pin (H13 tool steel).
Table 1. Composition of the Welding Materials.
Table 2. Composition of Tool Pin Material.
| Material & Standard | C | Mn | P & S | Mo | V | Cr | Si | Fe |
|---|---|---|---|---|---|---|---|---|
| H13 steel (ASTM A681)37 | 0.32–0.45 | 0.2–0.6 | 0.03 | 1.10–1.75 | 0.80–1.20 | 4.75–5.50 | 0.80–1.25 | Bal. |
2.2. Method
Table 3 presents the physical and mechanical property details of the tool pin and welding materials.
Table 3. Properties (Physical, Mechanical, and Electrical) of Tool and Workpiece Material.
| Property | C1100035 | AA 6061 T638 | H13 Tool steel |
|---|---|---|---|
| Density, g/cm3 | 8.91 | 2.7 | 7.76 |
| Specific heat capacity, J/kg·K | 390 | 896 | 460 |
| Melting point, °C | 1065 | 580 | 1427 |
| Poisson Ratio | 0.33 | 0.35 | - |
| Elastic modulus, GPa | 117.2 | 69 | 193 |
| Thermal conductivity, W/m·K | 391.1 | 152 | 32 |
| Coefficient of thermal expansion, /°C | 16.9 × 10⁻⁶ | 23.6 × 10⁻⁶ | 11.5 × 10⁻⁶ |
| Tensile strength, MPa | 262 | 310 | 1960 |
| Yield strength, MPa | 207 | 275 | 1570 |
| Hardness | 115 HV | 41 HV | 52 HRC |
| Resistivity at 20 °C in Ω.m | 1.72 × 10⁻⁸ | 2.65 × 10⁻⁸ | - |
| Conductivity at 20 °C in S/m | 5.81 × 10⁷ | 3.77 × 10⁷ | - |
FSSW parameters are evaluated, namely, TRS, PR and DT effect on the fabricated joint properties (conductivity, lap shear and flexural strength, and hardness). Factors and levels selected for performing experiments are based on experts’ advice and consulting literature.13−45 A total of 27 experimental conditions (each experimental condition is repeated twice) were considered by considering three factors operating at three levels (TRS: 1500, 1900, 2300 rpm, PR: 4, 8, and 12 mm/min, and DT: 8, 16, and 24 s). The sheets to be welded are cleaned and cut to the required size.
FSSW experiments were conducted viz. CNC machining center (VMX 42, USA) was used to prepare all sets of 27 lap joints. During experimentation, the AA 6061 T6 metallic strip was kept at the top, and the C11000 was held at the bottom to accommodate the prevailing metallurgical conditions. The yielding behavior of aluminum with great ease of manufacturing during the plastic stage is predominant for keeping at the top of the lap joint.
Figure 1 shows a cross-sectional view of the joint. The length and thickness of the plate is 90 mm and 1.6 mm (i.e., bottom plate copper). Since the shoulder diameter of the tool is 15 mm, the top plate (aluminum) will be in contact with the tool at this diameter. Twenty-seven experiments were divided into three sets (refer to Table 4):
SET 1: For Fixed TRS: 1500 rpm, the plunge rate and DT is varied against their respective 3 levels resulting in 9 experiments.
SET 2: For Fixed TRS: 1900 rpm, the plunge rate and DT is varied against their respective 3 levels resulting in 9 experiments.
SET 3: For Fixed TRS: 2300 rpm, the plunge rate and DT is varied against their respective 3 levels resulting in 9 experiments.
Figure 1.
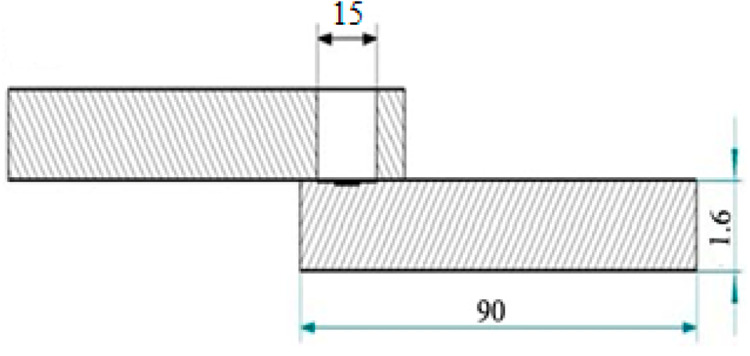
Schematic representation of the cross-sectional view of the joint.
Table 4. Details of Operating Conditions of 27 Experiments Composed of Three Sets and Their Lap Welded Joints.

Table 4 shows the top surface view of AA 6061 T6-C11000 joints produced at different operating conditions of the welding process. The changes in the macrostructure of FSSW joint profile observed at different processing conditions are attributed to the heat input. Note that, the heat input (Q = 1.083 × 2πn × (P/KA) × r × t) of FSSW process is reliant on process variables such as applied pressure (P), KA which is the ratio of contact shoulder profile area to the tool cross-sectional area, rotational speed (n), dwell time (measured in t, seconds), tool-tip radius (r), and friction coefficient between tool-alloy interface (μ).46,47 Aluminum debris can be clearly seen when the tool rotation speed at 1500 rpm with varied values of plunge rate (8–12 mm/min) and dwell time (16–24 s) (refer to Table 4). The circular imprints (impression of tool shoulder profile) with smooth and clear spot-welded (i.e., no debris and flash) was observed at SET II experiments (i.e., SET 2 experiments). As TRS increased from 1900 to 2300 rpm, the volumetric amount of flash at the circumference around the weld region increases. At 2300 rpm TRS, and increase in PR and DT increases the frictional heat input and thereby reduces the viscosity and increase the flowability of plasticized material resulting in clear appearance of expelled flashes at the circumference of welded region.
2.2.1. SEM Analysis of Test Specimens
For analyzing the microstructure and elemental composition of the interface region of friction stir spot-welded samples, two complementary techniques can be used: scanning electron microscopy (SEM) (Make: JEOL, Japan; Model: 6410-LV) and energy-dispersive X-ray spectroscopy (EDS).
Figure 2 presents the EDS analysis (Model: JEOL 6410-LV) at the weld-interface region. The presence of alloy contents of the base metal was seen clearly. The common elements found were Si, Mg, and oxides, which were present in the joint interfaces. The presence of oxides at the welded region affects the metallurgical (in the form of welding defects, namely, voids, kissing bond, delamination, hook defect, etc.) weld joint interfacial characteristics. These likely defects result in formation of excessive oxide layers. XRD analysis revealed the presence of oxides is lesser, indicating their significance effect on the weld strength is negligible. During welding or joining, oxides are due to the continuous intermixing of AA 6061 T6 and C11000 metals, resulting in oxidization by air during welding. Similar observations are reported in the published literature.38
Figure 2.

EDS analysis of the specimen material.
Several intermetallic compounds have been identified at the interface region of friction stir spot-welded dissimilar aluminum copper metallic lap joints, including the following: CuAl, CuAl2, Al2Cu, Al4Cu9, FeAl3, Fe2Al5. The interaction between the atoms of aluminum and copper at the contact results in the creation of these intermetallic compounds. The relative amounts of aluminum and copper at the interface determine the type of intermetallic complex that forms. The characteristics of the weld can be significantly affected by the presence of intermetallic compounds. CuAl and CuAl2 are two intermetallic compounds that have high strength and ductility. Al2Cu and Al4Cu9, two more intermetallic complexes, are fragile. The type and distribution of the filler metal determine the general characteristics.
2.3. Response Measurements
A total of 27 joints were prepared with different experimental conditions of TRS, PR, and DT and analyzed the responses (electrical conductivity, shear, and flexural strength). The measurement details of the responses are described below.
2.3.1. Vickers Microhardness Test
Vickers’s microhardness testing machine (Make: Shimadzu and Model: HMV-2T) was utilized for evaluating the hardness of the weld nugget region with a 0.05-kg load. ASTM E-384 standards were used to record the hardness values in the welded region. For each condition, three replicates are prepared and five hardness readings were recorded at distinct regions at the welded joints. Therefore, the average values of 15 hardness indentations were used for performing analysis and optimization.
2.3.2. Electrical Conductivity Measurement of FSSW Joint
The unit of electrical conductivity is Siemens/meter (S/m). The conductivity is the reciprocal of resistivity. Resistivity is commonly represented by the “ρ” (rho). The conductivity of C11000 is 5.81 × 10⁷ S/m, and that of AA6061 is 3.77 × 10⁷ S/m. The International Annealed Cooper Standard (IACS) is expressed in percentage with copper as the reference of 100%. The remaining metals are compared with copper, and their conductivity is expressed in percentages in relation to copper. Although aluminum has low conductivity compared to copper, it is widely used in electrical applications because of its commercial viability.48,49 The main drawback of aluminum as the conductor is the enhanced expansion due to the thermal effect.50 This negative factor is prominent in some heating applications. Many tests are carried out to estimate the electrical conductivity of metallic strips, depending on the test specimen conditions.
The test used in this research work was a four wire LCRQ 6018 Bridge Meter (Make: Hioki, model: 3490-6018) for the electrical conductivity test. The inductance (L), capacitance (C), resistance (R), dissipation factor (D), and quality factor (Q) of components are measured by a LCRQ 6018 Bridge Meter, a microprocessor-controlled LCR bridge. To increase the precision and lower errors, it makes use of a four-wire measurement approach. The Meter is capable of measuring components at frequencies ranging from 100 Hz to 1 kHz and has a basic accuracy of 0.25%. Additionally, it contains a HOLD mode that enables us to read the displayed value more easily by freezing it. The average resistance between two polarities was taken as the final resistance, and the conductivity was computed from that value (reciprocal of resistance).
2.3.3. Lap Shear Strength (LSS) of Samples
A Universal Testing Machine (Model: UNITEK-94100; Make: FIE Blue Star, India) with a five-ton capacity and ten-newton load cell accuracy is used to test the specimen. A single lap shear test is used to determine the welding efficiency or adhesiveness of the joint. LSS is the load-carrying capacity of the welded joint before a fracture occurs. The test was carried out according to the standards of ASTM D3163. After the sample was kept between the gripping jaws, a tensile load was gradually applied to the specimen. Load is applied continuously until the fracture of the test specimen occurs. Load versus displacement data is recorded with a computer integrated into the testing setup. The output values were recorded as ultimate/breaking load (N), ultimate stress (MPa), displacement at maximum load (mm), and maximum displacement (mm) for the calculated area of the specimen.
2.3.4. Flexural Strength (FS/σ) Testing of Samples
Three-point bending tests (Make and Model: Kudale instruments, Pune) are conducted viz. UTM with a special attachment to test all sets of 27 conditioned samples. A mechanical test termed the three-point bending test is employed for determining out a material’s flexural strength and modulus as per ASTM D790. A three-point bend fixture and a universal testing machine (UTM) are used to conduct the test. The specimen is mounted on a fixture with a support span that is 10 times the specimen’s thickness. The specimen is loaded until it broke in the middle. The highest force divided by the specimen’s cross-sectional area yields the flexural strength. Flexural strength computation is done by utilizing the eq 1.
| 1 |
During flexural strength examination, a vertical force is applied along the longitudinal axis of the specimen. Figure 3 shows the sample being bent in the testing arrangement. ASTM D-1002 standard was applied to examine the flexural strength of thin metallic sheets.
Figure 3.

Testing arrangement of flexural strength.
3. Results and Discussion
The FSSW parameters’s effect on the electrical conductivity test, lap shear test, and flexural strength of AA 6061 T6, and C11000 joints were studied. The response-wise analysis of factors and their effects on microstructure analysis is discussed. The relationship developed between electrical conductivity and the FS and LSS is also discussed.
3.1. Analysis of Factors on Electrical Conductivity
Experiments were conducted with different experimental variable (TRS, DT and PR) sets and their effect on the electrical conductivity of prepared joints. The main effect of all factors corresponding to each level was computed, and their mean values on electrical conductivity are presented in Figure 4a. Characteristics, i.e., TRS and DT, were maintained at low (1500 rpm and 8 s) and high values (2300 rpm and 24 s), resulting in lower electrical conductivity. The low and high values correspond to TRS, and DT directly influences heat input (see Figure 8a). At low values of TRS and DT, there are more friction coefficients and contact pressures due to lesser heat input which causes improper coalescence and incomplete bonding of metals.51 A large amount of heat production (due to high stirring action for a longer duration) at higher TRS and DT (2300 rpm and 24 s) resulted in the formation of brittle intermetallic compounds and void defects.52 The highest mean electrical conductivity values were recorded for TRS and DT set at 1900 rpm and 16 s because the continuity of metallic bonding and the weld region is free from internal metallic defects. Similar observations are seen in the earlier works.53 Continuous increase in electrical conductivity was recorded with the increased values of plunge rate varied between 4 and 12 mm/min. The plunge rate also had a significant effect on heat input. Low and middle values of the plunge rate cause more stirring action, resulting in more heat input and inducing the formation of intermetallic compounds with defects. Therefore, optimal conditions are observed at the combination of midvalues of TRS: 1900 rpm and DT: 16s, with higher PR: 12 mm/min resulting in close to higher electrical conductivity. TRS showed a higher percent contribution, 60.41%, followed by PR and DT, 21.84% and 17.75%, respectively (refer to Figure 4b).54 The electrical conductivity test results of the samples are tabulated in Table 6. The summary of results of process variables and their percent contribution to the performance of electrical conductivity is presented in Table 7.
Figure 4.

FSSW parameters on electrical conductivity: a) main effect plots, and b) percent contributions.
Figure 8.

FSSW parameters effect on FS: a) Main effect plots, and b) Percent contributions.
Table 6. Electrical Conductivity Test Results of Samples.
| Resistivity,
Ω |
|||||||
|---|---|---|---|---|---|---|---|
| Sample No. | TRS, rpm | DT, Sec | PR,mm/min | Polarity 1 | Polarity 2 | Average Resistivity, Ω (×10–8Ω-m) | Conductivity, σ (× 107 S/m) |
| 1 | 1500 | 8 | 4 | 0.2013 | 0.2233 | 0.2123 | 4.71 |
| 2 | 1500 | 8 | 8 | 0.2622 | 0.2798 | 0.2710 | 3.69 |
| 3 | 1500 | 8 | 12 | 0.1997 | 0.2177 | 0.2087 | 4.79 |
| 4 | 1500 | 16 | 4 | 0.2302 | 0.2326 | 0.2314 | 4.32 |
| 5 | 1500 | 16 | 8 | 0.2131 | 0.2151 | 0.2141 | 4.67 |
| 6 | 1500 | 16 | 12 | 0.1983 | 0.2009 | 0.1996 | 5.01 |
| 7 | 1500 | 24 | 4 | 0.2478 | 0.2508 | 0.2493 | 4.01 |
| 8 | 1500 | 24 | 8 | 0.2180 | 0.2214 | 0.2197 | 4.55 |
| 9 | 1500 | 24 | 12 | 0.2043 | 0.2071 | 0.2057 | 4.86 |
| 10 | 1900 | 8 | 4 | 0.2425 | 0.2441 | 0.2433 | 4.11 |
| 11 | 1900 | 8 | 8 | 0.1925 | 0.1957 | 0.1941 | 5.15 |
| 12 | 1900 | 8 | 12 | 0.1872 | 0.1886 | 0.1879 | 5.32 |
| 13 | 1900 | 16 | 4 | 0.1874 | 0.1898 | 0.1886 | 5.30 |
| 14 | 1900 | 16 | 8 | 0.1721 | 0.1757 | 0.1739 | 5.75 |
| 15 | 1900 | 16 | 12 | 0.1883 | 0.1899 | 0.1891 | 5.29 |
| 16 | 1900 | 24 | 4 | 0.1757 | 0.1175 | 0.1766 | 5.66 |
| 17 | 1900 | 24 | 8 | 0.1781 | 0.1795 | 0.1788 | 5.59 |
| 18 | 1900 | 24 | 12 | 0.1783 | 0.1821 | 0.1802 | 5.55 |
| 19 | 2300 | 8 | 4 | 0.1918 | 0.1944 | 0.1931 | 5.18 |
| 20 | 2300 | 8 | 8 | 0.2048 | 0.2066 | 0.2057 | 4.86 |
| 21 | 2300 | 8 | 12 | 0.2059 | 0.2089 | 0.2074 | 4.82 |
| 22 | 2300 | 16 | 4 | 0.2117 | 0.2129 | 0.2123 | 4.71 |
| 23 | 2300 | 16 | 8 | 0.2145 | 0.2127 | 0.2136 | 4.68 |
| 24 | 2300 | 16 | 12 | 0.1990 | 0.2018 | 0.2004 | 4.99 |
| 25 | 2300 | 24 | 4 | 0.2175 | 0.2201 | 0.2188 | 4.57 |
| 26 | 2300 | 24 | 8 | 0.2216 | 0.2238 | 0.2227 | 4.49 |
| 27 | 2300 | 24 | 12 | 0.2208 | 0.2226 | 0.2217 | 4.51 |
Table 7. Summary of Results of Main Effect Factors for Electrical Conductivity.
| Process variables | TRS | DT | PR | Total | |
|---|---|---|---|---|---|
| Levels | 1 | 4.512a | 4.737 | 4.730 | 14.71 |
| 2 | 5.302 | 4.969 | 4.826 | ||
| 3 | 4.757 | 4.866 | 5.016 | ||
| Maximum – Minimum | 0.79b | 0.2322 | 0.2856 | 1.31 | |
| Percent Contribution | 60.41c | 17.76 | 21.84 | ||
4.512 = (4.71 + 3.69 + 4.79 + 4.32 + 4.67 + 5.01 + 4.01 + 4.55 + 4.86)/9.
0.79 = 5.302–4.512.
60.41 = 100 × (0.79/1.31).
The electrical conductivity test for all 27 experimental conditions varied from 3.69 × 10⁷ to 5.75 × 10⁷ S/m. The maximum and minimum values of conductivity for SET 1, SET 2, and SET 3 were found equal to {5.01 × 10⁷ S/m and 3.69 × 10⁷ S/m}, {5.75 × 10⁷ S/m and 4.11 × 10⁷ S/m}, and {5.18 × 10⁷ S/m and 4.49 × 10⁷ S/m}. The average electrical conductivity values correspond to SET 1, SET 2, and SET 3 and equal 4.51× 10⁷, 5.33 × 10⁷, and 4.76 × 10⁷ S/m. Therefore, SET 2 experiments require more attention to where optimal conditions lie. The peak value of electrical conductivity equal to 5.75 × 10⁷ S/m was recorded when the TRS:1900 rpm, DT: 16 s, and PR: 8 mm/min (Sample No. 14 of Table 6 and Figure 5). The joint’s electrical conductivity and mechanical strength improve with an increase in rotational speed. This is because a finer grain structure results from increased heat generation brought on by a higher rotational speed. Greater electrical conductivity and ductility are characteristics of smaller grain structures. With the rotational speed, the joint’s microstructure also varies. Large, elongated grains make up the microstructure at lower rotational speeds. Smaller, equiaxed grains comprise the microstructure at faster rotational speeds. The most ductile and electrically conductive grains are the smaller equiaxed ones.
Figure 5.

Electrical conductivity of 27 experimental conditions
3.2. Analysis of Factors on Lap Shear Strength
The results of flexural strength of welded joints are presented in Table 8. Table 8 presents the experimental details representing the different sets of variables (TRS, DT and PR) and the corresponding shear strength of interlocked joints. Note that the variation in shear strength of the joints can be seen in SET 1 (Sample No. 1–9), SET 2 (Sample No. 10–18) and SET 3 (Sample No. 19–27) experiments (refer to Figure 6). The said variations are attributed to the strain hardening factor, which is reliant on welding speed and duration in joining process, and therefore, studying the welding parameters is essential to ensure strong weld joints.55
Table 8. Measurement of Test Samples: Ultimate/Breaking Load, Lap Shear Strength, and Flexural Strength.
| Sample No. | TRS, rpm | DT, Sec | PR,mm/min | Ultimate/Breaking Load, N | Lap Shear Strength, MPa | Flexural Strength, MPa |
|---|---|---|---|---|---|---|
| 1 | 1500 | 8 | 4 | 2224 | 78.37 | 144.85 |
| 2 | 1500 | 8 | 8 | 2142 | 75.47 | 154.36 |
| 3 | 1500 | 8 | 12 | 2041 | 72.04 | 158.69 |
| 4 | 1500 | 16 | 4 | 2189 | 77.27 | 169.45 |
| 5 | 1500 | 16 | 8 | 2373 | 83.76 | 161.32 |
| 6 | 1500 | 16 | 12 | 2442 | 84.70 | 155.26 |
| 7 | 1500 | 24 | 4 | 2652 | 98.61 | 135.67 |
| 8 | 1500 | 24 | 8 | 1994 | 70.38 | 169.66 |
| 9 | 1500 | 24 | 12 | 2055 | 72.54 | 171.32 |
| 10 | 1900 | 8 | 4 | 2158 | 76.17 | 177.45 |
| 11 | 1900 | 8 | 8 | 2454 | 86.46 | 178.48 |
| 12 | 1900 | 8 | 12 | 2525 | 88.97 | 177.00 |
| 13 | 1900 | 16 | 4 | 2142 | 75.61 | 187.75 |
| 14 | 1900 | 16 | 8 | 3022 | 106.67 | 197.85 |
| 15 | 1900 | 16 | 12 | 3041 | 107.34 | 188.96 |
| 16 | 1900 | 24 | 4 | 2960 | 104.48 | 187.35 |
| 17 | 1900 | 24 | 8 | 2845 | 100.42 | 187.85 |
| 18 | 1900 | 24 | 12 | 2554 | 88.59 | 179.55 |
| 19 | 2300 | 8 | 4 | 2640 | 93.19 | 179.75 |
| 20 | 2300 | 8 | 8 | 2789 | 98.45 | 179.25 |
| 21 | 2300 | 8 | 12 | 2852 | 100.67 | 169.60 |
| 22 | 2300 | 16 | 4 | 2751 | 97.11 | 166.99 |
| 23 | 2300 | 16 | 8 | 1854 | 65.44 | 160.65 |
| 24 | 2300 | 16 | 12 | 1953 | 68.94 | 155.45 |
| 25 | 2300 | 24 | 4 | 2171 | 76.63 | 149.85 |
| 26 | 2300 | 24 | 8 | 2094 | 73.91 | 150.65 |
| 27 | 2300 | 24 | 12 | 2078 | 73.35 | 155.80 |
Figure 6.

Lap shear strength under 27 experimental conditions.
Figure 7 displays the main factors that effect on LSS of joints. The low and high values correspond to TRS, and DT, which resulted in low values of LSS (see Figure 7a). The welding joints fabricated with low and high values of TRS and DT result in decreased lap shear strength, possibly due to inadequate or higher heat (more than critical temperature) during stirring, causing improper material flow. Similar results are observed in the literature.56 DT varied from 8 to 16 s and showed a negligible variation in LSS. A sudden drop in lap shear strength was observed at TRS and DT set at 2300 rpm and 24 s, probably due to grain level imperfection in high-speed bonding.57 A higher LSS was observed at the midvalues of TRS and DT (refer to Figure 7a). The reason might be the better penetration stability of the pin at the top and bottom plate; the uniform frictional force between the tool and workpiece enables uniform coalescence between tool-workpieces and defect-free bonding. The plunge rate showed a significant impact on LSS. An increase in plunge rate, the cycle time or duration of forging force is lesser causes inadequate pack or bonding of material between the layers (top and bottom sheets to be welded), resulting in less metallurgical bonding structure.58 Although two factors (DT of 7.13% and PR: 13.28%) have a considerable effect on forming welding joints, the tool rotation speed has a prominent role in initiating the tool to penetrate the top surface of the AA 6061-T6 sheet, which possesses a comparatively lower density than C11000. Therefore, TRS showed a dominant contribution of 79.59% (Figure 7b). The summary results of the mean effect of process variables and their percent contribution on the lap shear strength performance of the joints are presented in Table 9.
Figure 7.

FSSW parameters effect on LSS: a) main effect plots, and b) percent contributions.
Table 9. Summary of Results of Main Effect Factors for Lap Shear Strength.
| Process variables | TRS | DT | PR | Total | |
|---|---|---|---|---|---|
| Levels | 1 | 79.24 | 85.53 | 86.38 | 255.06 |
| 2 | 92.75 | 85.20 | 84.55 | ||
| 3 | 83.08 | 84.32 | 84.13 | ||
| Maximum – Minimum | 13.51 | 1.21 | 2.26 | 16.972 | |
| Percent Contribution | 79.59 | 7.13 | 13.28 | 100 | |
LSS of joint properties from the set of 27 experimental conditions varied between 65.44 to 107.34 MPa. Maximum and minimum values corresponding to SET 1, SET 2 and SET 3 are found equal to {98.61 and 70.38 MPa}, {107.34 and 75.61 MPa}, and {100.67 and 65.44 MPa}. The average values corresponding to SET 1, SET 2 and SET 3 experiments are 79.24 92.75, and 83.08 MPa. It is evident from the said experiments that the SET 2 experiments had more possibilities in improving the LSS, likely because TRS showed the highest contribution, equal to 79.59%. Therefore, the highest values of the LSS equal 107. 34 MPa was observed with TRS: 1900 rpm, DT: 16 s and PR: 12 mm/min (Sample No. 15 of Table 8 and Figure 6). Sample No. 14th experimental conditions also resulted close to the highest LSS which might be due to the lesser effect with variations in DT and PR.
3.3. Analysis of Factors on Flexural Strength
The main effect of factors (TRS, DT and PR) on flexural strength is presented in Figure 8a. The TRS, DT and PR kept at their respective middle levels equal to 1900 rpm, 16 s, and 8 mm/min, resulting in the highest FS in a welded joint. At the start of the experiment, the tool was at room temperature. As the rotational speed increases, the temperature will continuously increase due to the friction and force between the tool-workpiece interface. The friction at the bimetallic interfaces plays a prominent role in heat generation to metal interlocking of grains, ensuring proper intermixing of metals in the bimetallic interface region. The highest values of FS are attributed to the middle values of factors due to the desired heat, ensuring strong bonding and efficient interlocking. Theoretical principles of the bending test ensure that compression force is acting on the upper surface and tension is acting on the lower surface of the part to be joined. Note that AA 606 T6 and C11000 are ductile materials, the grains are elongated up to the yielding point, and complete disintegration of bonding between metallic strips occurred at the final stage of fractured specimens.59 The joints’ strength relies on the desired heat generation and depends on all FSSW parameters, resulting in a 71.37% contribution with TRS, followed by DT and PR equal to 16.53% and 12.71%, respectively (refer to Figure 8b and Table 10).
Table 10. Summary of Results of Main Effect Factors for Flexural Strength.
| Process variables | TRS | DT | PR | Total | |
|---|---|---|---|---|---|
| Levels | 1 | 157.84 | 168.83 | 166.57 | 505.65 |
| 2 | 184.69 | 171.52 | 171.12 | ||
| 3 | 163.11 | 165.30 | 167.96 | ||
| Maximum – Minimum | 26.85 | 6.22 | 4.55 | 37.62 | |
| Percent Contribution | 71.37 | 16.53 | 12.10 | 100.00 | |
The FS joint properties correspond to a total of 27 experimental sets varied between 135.67 to 197.85 MPa. Maximum and minimum values corresponding to SET 1, SET 2 and SET 3 are found equal to {171.32 and 135.67 MPa}, {197.85 and 177 MPa}, and {179.75 and 149.85 MPa}. The average values correspond to SET 1, SET 2 and SET 3 experiments, resulting in 157.84 184.69, and 163.11 MPa. SET 2 experiments showed the highest average values of FS. Therefore, the highest FS of 197.85 MPa was recorded at the optimal conditions of parameters set at 1900 rpm of TRS, 16 s of DT and 8 mm/min of PR (refer to Sample No. 14 of Figure 9 and Table 8).
Figure 9.

Flexural strength under 27 experimental conditions.
Figure 10 presents the observations of all responses corresponding to the 27 experimental conditions. The SET 2 experimental conditions produced comparatively better values of responses (EC, FS, and LSS) than SET 1 and SET 3. Sample No. 14 corresponds to SET 2 and offers better experimental conditions (TRS: 1900 rpm, PR: 8 mm/min, and DT: 16 s) that could result in better values of electrical conductivity, lap shear strength, and flexural strength equal to 5.75 × 10⁷ S/min, 106.67 and 197.85 MPa. The above results confirm the optimal condition for preparing lap joints suitable for selected applications.60 Therefore, conducting hardness and microstructural analysis is beneficial for the SET 2 trials (i.e., for fixed TRS: 1900 rpm and varying DT and PR) to determine the underlying facts.
Figure 10.

Comparison of responses (EC, FS, and LSS) of 27 experimental conditions.
3.4. Analysis of Factors on Microhardness
The Vickers microhardness test corresponds to SET 2 experimental conditions. Their joints are investigated for hardness variation from the stir zone, where the pin made contact with the joint, and the maximum axial thrust is applied. Table 5 shows that higher hardness values are observed at the stirring zone compared to adjacent zones. Base metals (AA 6061 T6 and C11000) resulted in comparatively lower hardness since there was no contact with the tool. The probable reason for the high hardness in the stir zone was the structural change due to tool pressure making the coarse grains into refined grains. For the fixed TRS of 1900 rpm, the dwell time showed a significant effect. The tool rotation speed operating at 1900 rpm is capable enough to produce uniform stirring action at plastic range of strain. In general, the grains orientation is reliant on axial trust of tool and amount of heat developed at welded region. The welding takes place between two ductile materials, and the grain behavior is directly proportional to the imparted hardness. Increase in dwell time might increase the frictional heat, if heat dissipated at regular intervals causes localized heat treatment at the adjacent region of weld zone. Therefore, the grains are elongated at the plastic region resulting in an adverse effect on the hardness. The volume of refined grains in the stir zone was greatly influenced by the heat input received during the stirring action of the tool. During the FSSW process, the uniform retention of torque in the stir zone results in peak temperature due to the plasticization of the metallic interface. Therefore, higher hardness at the stir zone results from thermal influence and cycle. The homogeneous retention of torque in the stir zone during the friction stir spot-welding (FSSW) process causes a peak temperature as a result of the plasticization of the metallic interface. This is to ensure that heat that is produced by the tool’s friction with the workpiece can be transmitted to the material. The material plasticizes, or flows like a liquid, as a result of the heat. This material movement facilitates the mixing of the components and establishes a solid connection. Due to the heat influence and cyclical nature of the operation, the stir zone has a higher hardness. The material becomes harder as a result of the heat’s effect on the size of its grain. The material is repeatedly used because of the cyclical nature of the process.61 The material is continually heated and cooled as a result of the cyclical nature of the process, which also aids in the development of microscopic grains.
Table 5. Microhardness Variation Corresponds to the SET 2 Experimental Samples.
| Vickers
Microhardness, HV (ASTM E-384) |
||||||||
|---|---|---|---|---|---|---|---|---|
| Sl. No. | TRS, rpm | DT, Sec | PR,mm/min | Base Metal 1 (Al) | Adjacent Side to Al | Stir Zone | Adjacent Side to Cu | Base Metal 2 (Cu) |
| 1 | 1900 | 8 | 4 | 81.6 | 99.8 | 286.0 | 152.8 | 91.7 |
| 2 | 1900 | 8 | 8 | 82.4 | 99.5 | 228.4 | 158.6 | 92.5 |
| 3 | 1900 | 8 | 12 | 79.5 | 97.7 | 210.7 | 124.8 | 93.5 |
| 4 | 1900 | 16 | 4 | 79.18 | 142.9 | 204.6 | 121.5 | 98.5 |
| 5 | 1900 | 16 | 8 | 77.25 | 128.6 | 214.6 | 132.6 | 96.4 |
| 6 | 1900 | 16 | 12 | 76.91 | 129.2 | 198.7 | 123.5 | 93.4 |
| 7 | 1900 | 24 | 4 | 78.62 | 101.4 | 200.9 | 127.8 | 96.5 |
| 8 | 1900 | 24 | 8 | 84.5 | 123.6 | 189.0 | 102.5 | 94.2 |
| 9 | 1900 | 24 | 12 | 82.24 | 150.1 | 175.6 | 139.3 | 93.4 |
3.5. Results of SEM Analysis of Test Specimens
SEM is used to analyze the interface region of the metallic joint with process parameters (TRS of 1900 rpm, PR of 8 mm/s and DT of 16 s), resulting in a higher value of electrical conductivity, lap shear strength, and flexural strength equal to 5.75 × 10⁷ S/m, 106.67 and 197.85 MPa. This parametric condition is selected because higher strength was reported from all the SET 2 experiments. Moreover, as per the chosen application of replacing earth cables from copper to aluminum, it has been considered to have maximum conductivity.
Figure 11a shows the bonding area between C11000 and the AA6061 T6 material. In an enlarged view, the cavities are seen at the bimetallic joint interfaces (Figure 11b). The visible spots of intermixed metals are noticed at the copper–aluminum interface (Figure 11c). The micropores and cracks were also visible at some spots due to improper bonding and formation of intermetallic compounds Figure 11b. The said cracks and voids can be minimized by following methods: studying interaction factors effect, and applying organic compound coating or by keeping the work conditions below normal room temperature (subzero/cryogenic range).62,63
Figure 11.

(a) SEM images of the interface region, (b,c) enlarged view at bimetallic interface.
Figure 12 shows the microstructure obtained at different weld zones: BMZ, SZ, TMAZ and HAZ. The parent or base metal remains unaltered and is not affected by the physical contact between the tool and workpiece (refer to Figure 12a). The distribution and dispersion of grains vary according to the distance from the tool axis to the edge of the metallic strips. In the stir zone, the volume of refined grains is influenced by heat input and uniform torque applied by the stirring action of the tool, resulting in plasticizing of the metallic interface (refer to Figure 12b). The presence of plastic deformation, recrystallization and precipitates in the welded structure corresponds to the distance away from the stir zone (refer to Figure 12c).56 No visible micro cracks and voids were observed at the welded joint, clearly defining the optimal conditions (refer to Figure 12a–d).
Figure 12.

Microstructure at different weld zones: a. base metal (BMZ), b. stir zone (SZ), c. thermo-mechanically affected zone (TMAZ), and d. heat affected zone (HAZ).
A stir zone (SZ) and a thermo-mechanically affected zone (TMAZ) emerge in friction stir spot-welded dissimilar aluminum copper metallic lap joints, which defines their microstructure. The friction shield welding technique plasticized and recrystallized the region of the weld known as the SZ. The area of the weld designated as the TMAZ is the portion that has been heated and deformed during the welding process but has not yet plasticized or recrystallized. A fine-grained, equiaxed microstructure is often what distinguishes the SZ in friction stir spot-welded dissimilar aluminum copper metallic lap joints. In general, the grain size of the SZ is substantially smaller than the underlying material’s grain size.
This is because during the welding process, recrystallization takes place. The heat and deformation of the welding process drive the recrystallization process. The SZ’s great fine-grained, equiaxial microstructure provides increased strength and toughness. Typically, the microstructure of the TMAZ in friction stir spot-welded dissimilar aluminum copper metallic lap joints is distorted and stretched. The TMAZ grains are elongated in the direction of the welding tool’s motion. This is brought on by the plastic deformation that takes place while welding. The elongated, distorted microstructure in the TMAZ can lessen the weld’s strength and hardness as can be seen in Figure 12.
By optimizing the welding variables, the microstructure of friction stir spot-welded dissimilar aluminum copper metallic lap joints can be enhanced. The welding speed, the rotational speed of the welding tool, and the depth of the plunge of the welding tool are all welding characteristics that can be optimized. It is possible to produce welds with a fine-grained, equiaxed microstructure in the SZ and a minimal TMAZ by optimizing the welding conditions.64
3.7. Relationship between the Responses: EC with LSS and FS
To produce defect-free strong joints, the process parameters (PR, DT and TRS) optimization of the FSSW process is of industrial relevance. The solid-state welding process has many challenges in producing defectless and high-strength joints since it uses a nonconsumable hardened tool and fixture design parameters. The high speed of rotation of the tool and the placing of the metal pieces affect the joint’s firmness. A defect-free junction is a prerequisite for application suitability and durability. The yield behavior of the metal pieces, ductility and hardness of work and tool material have a more significant influence on the process parameters to be selected for the friction stir spot-welding process.65−70 The plastic deformation phenomena play a vital role in the strength of the weld joints. The electrical conductivity and strength (flexural and lap shear) are essential for the intended application. For the prepared joints, three different responses (LSS, FS and EC) are measured; therefore, identifying their relationship is paramount. This is because the electrical conductivity of a material is a measure of its ability to conduct electricity, and the lap shear strength and flexural strength of a material are measures of its ability to resist shear and bending loads, respectively. The relationship between the electrical conductivity with FS and LSS is established with the experimental data by using Minitab software.
3.7.1. Data Analysis with Regression
A set of 27 experimental data was used, and the best-fit curve for electrical conductivity is established with FS and LSS. The electrical conductivity is established with a third-order nonlinear function with FS, and LSS is presented in eq 2–3.
| 2 |
| 3 |
The strength of the relationship is tested by determining the multiple correlation coefficients. The electrical conductivity relationship with lap shear and flexural strength equals 0.2681 and 0.5581. Therefore, electrical conductivity does not have significant relation with lap shear strength (refer to Figure 13a), whereas a moderately dependent direct relationship with the flexural strength of the prepared joint.71−79Figure 13b shows that increased flexural strength values increase the electrical conductivity.
Figure 13.

Best fit curves representing the relation between outputs: EC and FS (a), and EC and LSS (b).
4. Conclusions
The present work aims to analyze the electrical and mechanical responses of friction stir spot-welding (FSSW) joints, replacing copper with aluminum suitable for electrical conductors and structural applications. FSSW parameters (tool rotational speed-TRS, plunge rate-PR, and dwell duration-DT) were analyzed on the performance of the AA 6061 with C11000 copper lap joints. The following conclusions were drawn as follows:
-
1.
Experiments are conducted at all combinations (individually and simultaneously) to provide detailed insights on lap shear strength (LSS), flexural strength (FS) and electrical conductivity (EC) of lap joints. In comparison to other parameters like PR and DT, TRS had the greatest impact on the EC, mechanical strength, and microstructure of the produced joints of the three process variables examined.
-
2.
Peak electrical conductivity of AA6061 T6-C11000 lap joints measured at TRS, DT, and PR set at 1900 rpm, 16 s, and 8 mm/min is 5.75 × 10⁷ S/m. TRS, PR, and DT each contribute a percentage of 60.41%, 21.84%, and 17.75% to EC, respectively.
-
3.
The development of strong weld joints was strongly influenced by both parameters (DT: 7.13%; PR: 13.28%). Nevertheless, TRS demonstrated a crucial function (contributing 79.59%) in starting the tool that allowed the bottom C11000 sheets to pierce the top surface of the AA 6061-T6 sheet. The combination of TRS 1900 rpm, DT 16 s, and PR 12 mm/min produced an LSS value of 107.34 MPa, which is the highest value.
-
4.
The highest FS, equal to 197.85 MPa, was obtained by setting all variables to the middle values of TRS: 1900 rpm, DT: 16 s, and PR: 8 mm/min. The contribution of TRS to the lap joints’ FS, which depends on all FSSW parameters and relies on the generation of unwanted heat, is 71.37%; DT and PR follow with contributions of 16.53% and 12.71%, respectively.
-
5.
The maximum strength and EC lap joints were produced by TRS running at 1900 rpm. In order to further investigate hardness and microstructural investigation, SET 2 experiments (For fixed TRS: 1900 rpm and changing DT: 8–24 s, and PR: 4–12 mm/min) were conducted. The microhardness peaked at the stir zone and decreased toward the end surface as it moved from the joint’s center.
-
6.
SEM research reveals that at the stirring zone, refined grains and metallic interface plasticizing can be seen. In the welded structure further from the stir zone, plastic deformation and precipitates perceived. At ideal conditions, no voids or apparent microcracks are found.
-
7.
The weld-interface region’s EDS analysis verifies the presence of oxides and the composition of the welding material. With the assistance of a third-order nonlinear function with FS and LSS, EC is established. EC has a moderately dependent direct relationship with FS of the prepared joint but no significant link with LSS. In line with rising FS values is a rise in EC.
Acknowledgments
Authors would like to thank the Researchers Supporting Project, RSP2023R42, King Saud University, Riyadh, Saudi Arabia for the financial support. The authors are grateful to the Dr C S Ramachandran, The State University of New York (SUNY) at Stony Brook, New York and Dr. Sher Afghan Khan, Department of Mechanical Engineering, Faculty of Engineering, International Islamic University, Kaula Lumpur, Malaysia for his technical assistance.
The authors declare no competing financial interest.
Notes
Scope for Future Work: The present work can be extended in the following directions for interesting results: a) determining the effects of interaction factors among the process variables might produce detailed insights into a FSSW process. b) applying the organic compound coating or experiment conduction at cryogenic temperature might produce interesting properties. The authors are working in the said direction.
References
- Isa M. S. M.; Moghadasi K.; Ariffin M. A.; Raja S.; Muhamad M. R. b.; Yusof F.; Jamaludin M. F.; Yusoff N. b.; Ab Karim M. S. b. Recent research progress in friction stir welding of aluminium and copper dissimilar joint: a review. Journal of Materials Research and Technology 2021, 15, 2735–2780. 10.1016/j.jmrt.2021.09.037. [DOI] [Google Scholar]
- Joshi G. R.; Badheka V. J.; Darji R. S.; Oza A. D.; Pathak V. J.; Burduhos-Nergis D. D.; Burduhos-Nergis D. P.; Narwade G.; Thirunavukarasu G. The Joining of Copper to Stainless Steel by Solid-State Welding Processes: A Review. Materials 2022, 15 (20), 7234. 10.3390/ma15207234. [DOI] [PMC free article] [PubMed] [Google Scholar]
- Singh V. P.; Patel S. K.; Ranjan A.; Kuriachen B. Recent research progress in solid state friction-stir welding of aluminium–magnesium alloys: a critical review. Journal of Materials Research and Technology 2020, 9 (3), 6217–6256. 10.1016/j.jmrt.2020.01.008. [DOI] [Google Scholar]
- Aghajani Derazkola H.; Khodabakhshi F.; Gerlich A.P. Friction-forging tubular additive manufacturing (FFTAM): A new route of solid-state layer-upon-layer metal deposition. Journal of Materials Research and Technology 2020, 9 (6), 15273–15285. 10.1016/j.jmrt.2020.10.105. [DOI] [Google Scholar]
- Sharma C.; Tripathi A.; Upadhyay V.; Verma V.; Sharma S. K. Friction stir spot welding-process and weld properties: a review. Journal of The Institution of Engineers (India): Series D 2021, 102, 549–565. 10.1007/s40033-021-00276-z. [DOI] [Google Scholar]
- Balamurugan M; S G.; Mohan D. G Influence of tool pin profiles on the filler added friction stir spot welded dissimilar aluminium alloy joints. Materials Research Express 2021, 8, 096531. 10.1088/2053-1591/ac2771. [DOI] [Google Scholar]
- Muzakki H.; Millaily I.; Ahmadi; Suwarsono; Bale J. S. Macrostructure and shear strength analysis on Cu-Al joint of micro friction stir spot welding. Key Engineering Materials 2023, 943, 41–46. 10.4028/p-xco4h9. [DOI] [Google Scholar]
- Zolghadr P.; Akbari M.; Asadi P. Formation of thermo-mechanically affected zone in friction stir welding. Materials Research Express 2019, 6, 086558. 10.1088/2053-1591/ab1d25. [DOI] [Google Scholar]
- Akbari M.; Asadi P. Dissimilar friction stir lap welding of aluminum to brass: Modeling of material mixing using coupled Eulerian–Lagrangian method with experimental verifications, Proceedings of the Institution of Mechanical Engineers, Part L. Journal of Materials: Design and Applications 2020, 234 (8), 1117. 10.1177/1464420720922560. [DOI] [Google Scholar]
- Asadi P.; Akbari M.; Givi M. K. B.; Panahi M. S. Optimization of AZ91 friction stir welding parameters using Taguchi method, Proceedings of the Institution of Mechanical Engineers, Part L. Journal of Materials: Design and Applications 2015, 230 (1), 1–13. 10.1177/1464420715570987. [DOI] [Google Scholar]
- Akbari M.; Asadi P.; Behnagh R. A. Modeling of material flow in dissimilar friction stir lap welding of aluminum and brass using coupled Eulerian and Lagrangian method. International Journal of Advanced Manufacturing Technology 2021, 113, 721–734. 10.1007/s00170-020-06541-x. [DOI] [Google Scholar]
- Akbari M.; Asiabaraki H. R.; Aliha M. Investigation of the effect of welding and rotational speed on strain and temperature during friction stir welding of AA5083 and AA7075 using the CEL approach. Engineering Research Express 2023, 5 (2), 025012. 10.1088/2631-8695/acca00. [DOI] [Google Scholar]
- Karunakaran D.; Venkatachalapathy V. S. K.. Mechanical, electrical and non-destructive testing of dissimilar thin sectioned lap joint by friction stir spot welding process Journal of Biomechanical Science and Engineering (2023). [Google Scholar]
- Buchanan C.; Gardner L. Metal 3D printing in construction: A review of methods, research, applications, opportunities and challenges. Engineering Structures 2019, 180, 332–348. 10.1016/j.engstruct.2018.11.045. [DOI] [Google Scholar]
- Mukundan S.; Dhulipati H.; Chauvin L.; Vidanalage B. D. S. G.; Edrisy A.; Tjong J.; Kar N. C.. Comparative performance analysis of copper and aluminum wound fractional–slot PMSMs for high–speed traction application. 2019 22nd International Conference on Electrical Machines and Systems (ICEMS), Harbin, China, Aug. 11-14, 2019, pp 1–6. 10.1109/ICEMS.2019.8922075. [DOI]
- Barekatain H.; Kazeminezhad M.; Kokabi A. H. Microstructure and Mechanical Properties in Dissimilar Butt Friction Stir Welding of Severely Plastic Deformed Aluminum AA 1050 and Commercially Pure Copper Sheets. J. Mater. Sci. Technol. 2014, 30, 826–834. 10.1016/j.jmst.2013.11.007. [DOI] [Google Scholar]
- Zhang Q.-Z.; Gong W.-B.; Liu W. Microstructure and mechanical properties of dissimilar Al–Cu joints by friction stir welding. Trans. Nonferrous Met. Soc. China 2015, 25, 1779–1786. 10.1016/S1003-6326(15)63783-9. [DOI] [Google Scholar]
- Xue P.; Xiao B. L.; Ni D. R.; Ma Z. Y. Enhanced mechanical properties of friction stir welded dissimilar Al–Cu joint by intermetallic compounds. Mater. Sci. Eng., A 2010, 527, 5723–5727. 10.1016/j.msea.2010.05.061. [DOI] [Google Scholar]
- Xue P.; Ni D. R.; Wang D.; Xiao B. L.; Ma Z. Y. Effect of friction stir welding parameters on the microstructure and mechanical properties of the dissimilar Al–Cu joints. Mater. Sci. Eng., A 2011, 528, 4683–4689. 10.1016/j.msea.2011.02.067. [DOI] [Google Scholar]
- Eslami N.; Hischer Y.; Harms A.; Lauterbach D.; Böhm S. Optimization of process parameters for friction stir welding of aluminum and copper using the taguchi method. Metals 2019, 9 (1), 63. 10.3390/met9010063. [DOI] [Google Scholar]
- Prabhu R. S. B.; Shettigar A. K.; Patel GC M.; Herbert M.; Rao S. S. Influence of process variables on joint attributes of friction stir welded aluminium matrix composite. Advances in Materials and Processing Technologies 2022, 8 (2), 1550–1559. 10.1080/2374068X.2020.1860588. [DOI] [Google Scholar]
- Heideman R.; Johnson C.; Kou S. Metallurgical analysis of Al/Cu friction stir spot welding. Science and Technology of Welding and Joining 2010, 15 (7), 597–604. 10.1179/136217110X12785889549985. [DOI] [Google Scholar]
- Prabhakar D. A. P.; Shettigar A. K.; Herbert M. A.; GC M. P.; Pimenov D. Y.; Giasin K.; Prakash C. A comprehensive review of friction stir techniques in structural materials and alloys: challenges and trends. Journal of Materials Research and Technology 2022, 20, 3025–3060. [Google Scholar]
- García-Navarro D.; Ortiz-Cuellar J. C.; Galindo-Valdés J. S.; Gómez-Casas J.; Muñiz-Valdez C. R.; Rodríguez-Rosales N. A. Effects of the FSW parameters on microstructure and electrical properties in Al 6061-T6-Cu C11000 plate joints. Crystals 2021, 11 (1), 21. 10.3390/cryst11010021. [DOI] [Google Scholar]
- Mubiayi M. P.; titilayo Akinlabi E.; Makhatha M. E.. Microstructure and electrical resistivity properties of copper and aluminium friction stir spot welds. 2017 8th International Conference on Mechanical and Intelligent Manufacturing Technologies (ICMIMT), Cape Town, South Africa, Feb. 3–6, 2017, pp 42–47. 10.1109/ICMIMT.2017.7917432. [DOI]
- Özdemir U.; Sayer S.; Yeni Ç Effect of Pin Penetration Depth on the Mechanical Properties of Friction Stir Spot Welded Aluminum and Copper. Materials Testing IN Joining Technology 2012, 54 (4), 233–239. 10.3139/120.110322. [DOI] [Google Scholar]
- Shiraly M.; Shamanian M.; Toroghinejad M. R.; Ahmadi Jazani M. Effect of Tool Rotation Rate on Microstructure and Mechanical Behavior of Friction Stir Spot-Welded Al/Cu Composite. Journal of Materials Engineering and Performance 2014, 23 (2), 413–420. 10.1007/s11665-013-0768-8. [DOI] [Google Scholar]
- Mubiayi M. P.; Akinlabi E. T. Evolving properties of friction stir spot welds between AA1060 and commercially pure copper C11000. Transactions of Nonferrous Metals Society of China 2016, 26 (7), 1852–1862. 10.1016/S1003-6326(16)64296-6. [DOI] [Google Scholar]
- Manickam S.; Balasubramanian V. Maximizing Strength of Friction Stir Spot Welded Bimetallic Joints of AA6061 Aluminum Alloy and Copper Alloy by Response Surface Methodology. IPASJ. International Journal of Mechanical Engineering (IIJME) 2015, 3 (12), 16–26. [Google Scholar]
- Siddharth S.; Senthilkumar T. Optimization of friction stir spot welding process parameters of dissimilar Al 5083 and C 10100 joints using response surface methodology. Russian Journal of Non-Ferrous Metals 2016, 57 (5), 456–466. 10.3103/S1067821216050151. [DOI] [Google Scholar]
- Garg A.; Bhattacharya A. Strength and failure analysis of similar and dissimilar friction stir spot welds: Influence of different tools and pin geometries. Materials & Design 2017, 127, 272–286. 10.1016/j.matdes.2017.04.084. [DOI] [Google Scholar]
- Siddharth S.; Senthilkumar T. ″Study of tool Penetration Behavior in Dissimilar Al5083/C10100 Friction Stir Spot Welds. Procedia Engineering 2017, 173, 1439–1446. 10.1016/j.proeng.2016.12.209. [DOI] [Google Scholar]
- Mubiayi M. P.; Akinlabi E. T. Characterization of the intermetallic compounds in aluminium and copper friction stir spot welds. Materials Today: Proceedings 2017, 4 (2), 533–540. 10.1016/j.matpr.2017.01.054. [DOI] [Google Scholar]
- Siddharth S.; Senthilkumar T.; Chandrasekar M. Development of processing windows for friction stir spot welding of aluminium Al5052/copper C27200 dissimilar materials. Transactions of Nonferrous Metals Society of China 2017, 27 (6), 1273–1284. 10.1016/S1003-6326(17)60148-1. [DOI] [Google Scholar]
- Muthu M. F. X.; Jayabalan V. Tool travel speed effects on the microstructure of friction stir welded aluminum–copper joints. Journal of Materials Processing Technology 2015, 217, 105–113. 10.1016/j.jmatprotec.2014.11.007. [DOI] [Google Scholar]
- Heideman R.; Johnson C.; Kou S. Metallurgical analysis of Al/Cu friction stir spot welding. Science and Technology of Welding and Joining 2010, 15 (7), 597–604. 10.1179/136217110X12785889549985. [DOI] [Google Scholar]
- Mypati O.; Pavan Kumar P.; Iqbal P.; Pal S. K.; Srirangam P. Molecular dynamics simulation of atomic diffusion in friction stir spot welded Al to Cu joints. Mechanics of Advanced Materials and Structures 2022, 29 (27), 6053–6059. 10.1080/15376494.2021.1972188. [DOI] [Google Scholar]
- Khajeh R.; Jafarian H. R.; Jabraeili R.; Eivani A. R.; Seyedein S. H.; Park N.; Heidarzadeh A. Strength-ductility synergic enhancement in friction stir welded AA2024 alloy and copper joints: Unravelling the role of Zn interlayer’s thickness. Journal of Materials Research and Technology 2022, 16, 251–262. 10.1016/j.jmrt.2021.11.133. [DOI] [Google Scholar]
- Li M.; Zhang C.; Wang D.; Zhou L.; Wellmann D.; Tian Y. Friction stir spot welding of aluminum and copper: a review. Materials 2020, 13 (1), 156. 10.3390/ma13010156. [DOI] [PMC free article] [PubMed] [Google Scholar]
- Shahrabadi A.; Ezatpour H.; Paidar M. Protrusion friction stir spot welding of dissimilar joints of 6061 aluminum alloy/Copper sheets with Zn interlayer. Mater. Lett. 2022, 328, 133107. 10.1016/j.matlet.2022.133107. [DOI] [Google Scholar]
- Vaneghi A. H.; Bagheri B.; Shamsipur A.; Mirsalehi S. E.; Abdollahzadeh A. Investigations into the formation of intermetallic compounds during pinless friction stir spot welding of AA2024-Zn-pure copper dissimilar joints. Welding in the World 2022, 66 (11), 2351–2369. 10.1007/s40194-022-01366-6. [DOI] [Google Scholar]
- Zhou L.; Li G. H.; Zhang R. X.; Zhou W. L.; He W. X.; Huang Y. X.; Song X. G. Microstructure evolution and mechanical properties of friction stir spot welded dissimilar aluminum-copper joint. J. Alloys Compd. 2019, 775, 372–382. 10.1016/j.jallcom.2018.10.045. [DOI] [Google Scholar]
- Li G.; Zhou L.; Zhou W.; Song X.; Huang Y. Influence of dwell time on microstructure evolution and mechanical properties of dissimilar friction stir spot welded aluminum–copper metals. Journal of Materials Research and Technology 2019, 8 (3), 2613–2624. 10.1016/j.jmrt.2019.02.015. [DOI] [Google Scholar]
- Wang X.; Morisada Y.; Fujii H. High-strength Fe/Al dissimilar joint with uniform nanometer-sized intermetallic compound layer and mechanical interlock formed by adjustable probes during double-sided friction stir spot welding. Materials Science and Engineering: A 2021, 809, 141005. 10.1016/j.msea.2021.141005. [DOI] [Google Scholar]
- Choi D. H.; Ahn B. W.; Lee C. Y.; Yeon Y. M.; Song K.; Jung S. B. Formation of intermetallic compounds in Al and Mg alloy interface during friction stir spot welding. Intermetallics 2011, 19 (2), 125–130. 10.1016/j.intermet.2010.08.030. [DOI] [Google Scholar]
- Copper Development Association Inc. https://alloys.copper.org/alloy/C11000.
- Trueba L.; Torres M. A.; Johannes L. B.; Rybicki D. Process optimization in the self-reacting friction stir welding of aluminum 6061-T6. International Journal of Material Forming 2018, 11, 559–570. 10.1007/s12289-017-1365-4. [DOI] [Google Scholar]
- Çiçek A.; Kara F.; Kıvak T.; Ekici E.; Uygur I. Effects of deep cryogenic treatment on the wear resistance and mechanical properties of AISI H13 hot-work tool steel. Journal of Materials Engineering and Performance 2015, 24, 4431–4439. 10.1007/s11665-015-1712-x. [DOI] [Google Scholar]
- ASM Aerospace Specification Metals Inc. https://asm.matweb.com/search/SpecificMaterial.asp?bassnum=ma6061t6.
- Ahmed M. M. Z.; El-Sayed Seleman M. M.; Ahmed E.; Reyad H. A.; Touileb K.; Albaijan I. Friction Stir Spot Welding of Different Thickness Sheets of Aluminum Alloy AA6082-T6. Materials 2022, 15 (9), 2971. 10.3390/ma15092971. [DOI] [PMC free article] [PubMed] [Google Scholar]
- Zhang G.; Xiao C.; Ojo O. O. Dissimilar friction stir spot welding of AA2024-T3/AA7075-T6 aluminum alloys under different welding parameters and media. Defence Technology 2021, 17 (2), 531–544. 10.1016/j.dt.2020.03.008. [DOI] [Google Scholar]
- de Leon M.; Shin H. S. Review of the advancements in aluminum and copper ultrasonic welding in electric vehicles and superconductor applications. Journal of Materials Processing Technology 2022, 307, 117691. 10.1016/j.jmatprotec.2022.117691. [DOI] [Google Scholar]
- Silbernagel C.; Ashcroft I.; Dickens P.; Galea M. Electrical resistivity of additively manufactured AlSi10Mg for use in electric motors. Additive Manufacturing 2018, 21, 395–403. 10.1016/j.addma.2018.03.027. [DOI] [Google Scholar]
- Karabay S. Modification of AA-6201 alloy for manufacturing of high conductivity and extra high conductivity wires with property of high tensile stress after artificial aging heat treatment for all-aluminium alloy conductors. Materials & design 2006, 27 (10), 821–832. 10.1016/j.matdes.2005.06.005. [DOI] [Google Scholar]
- Li Y.; Sun D.; Gong W. Effect of tool rotational speed on the microstructure and mechanical properties of bobbin tool friction stir welded 6082-T6 aluminum alloy. Metals 2019, 9 (8), 894. 10.3390/met9080894. [DOI] [Google Scholar]
- Khajeh R.; Jafarian H. R.; Seyedein S. H.; Jabraeili R.; Eivani A. R.; Park N.; Kim Y.; Heidarzadeh A. Microstructure, mechanical and electrical properties of dissimilar friction stir welded 2024 aluminum alloy and copper joints. Journal of Materials Research and Technology 2021, 14, 1945–1957. 10.1016/j.jmrt.2021.07.058. [DOI] [Google Scholar]
- Ubaid M.; Bajaj D.; Mukhopadhyay A. K.; Siddiquee A. N. Friction stir welding of thick AA2519 alloy: Defect elimination, mechanical and micro-structural characterization. Metals and Materials International 2020, 26, 1841–1860. 10.1007/s12540-019-00472-3. [DOI] [Google Scholar]
- Isa M. S. M.; Moghadasi K.; Ariffin M. A.; Raja S.; Muhamad M. R. b.; Yusof F.; Jamaludin M. F.; Yusoff N. b.; Ab Karim M. S. b. Recent research progress in friction stir welding of aluminium and copper dissimilar joint: a review. Journal of Materials Research and Technology 2021, 15, 2735–2780. 10.1016/j.jmrt.2021.09.037. [DOI] [Google Scholar]
- Anand R.; Sridhar V. G. Microstructure and mechanical properties of interlock friction stir weld lap joint AA7475-T7 using fractional factorial design. Proceedings of the Institution of Mechanical Engineers, Part C: Journal of Mechanical Engineering Science 2022, 236 (1), 318–329. 10.1177/0954406221996393. [DOI] [Google Scholar]
- Suresh S.; Venkatesan K.; Natarajan E.; Rajesh S. Influence of tool rotational speed on the properties of friction stir spot welded AA7075-T6/Al2O3 composite joint. Materials Today: Proceedings 2020, 27, 62–67. 10.1016/j.matpr.2019.08.220. [DOI] [Google Scholar]
- Kwee I.; De Waele W.; Faes K. Weldability of high-strength aluminium alloy EN AW-7475-T761 sheets for aerospace applications, using refill friction stir spot welding. Welding in the World 2019, 63, 1001–1011. 10.1007/s40194-019-00732-1. [DOI] [Google Scholar]
- Ramya G.; Pounrajan S.; Prasad D. V. S. S. S. V.; Soni S.; Ravichandran P.; Kosanam K.; Gopala Gupta A. S. A. L. G.; Dinesh P. M.; Kumar L.; Shaik B. Assessment of rotational speed and plunge rate on lap shear strength of FSSW joints of AA7075/mild steel. Advances in Materials Science and Engineering 2022, 2022, 6215249. 10.1155/2022/6215249. [DOI] [Google Scholar]
- Zhang W.; Shen Y.; Yan Y.; Guo R.; Guan W.; Guo G. Microstructure characterization and mechanical behavior of dissimilar friction stir welded Al/Cu couple with different joint configurations. International Journal of Advanced Manufacturing Technology 2018, 94, 1021–30. 10.1007/s00170-017-0961-2. [DOI] [Google Scholar]
- Batistao B. F.; Bergmann L. A.; Gargarella P.; Alcantara N. G. d.; dos Santos J. F.; Klusemann B. Characterization of dissimilar friction stir welded lap joints of AA5083 and GL D36 steel. Journal of Materials Research and Technology 2020, 9, 15132–42. 10.1016/j.jmrt.2020.10.078. [DOI] [Google Scholar]
- Shehabeldeen T. A.; Yin Y.; Ji X.; Shen X.; Zhang Z.; Zhou J. Investigation of the microstructure, mechanical properties and fracture mechanisms of dissimilar friction stir welded aluminium/titanium joints. Journal of Materials Research and Technology 2021, 11, 507–18. 10.1016/j.jmrt.2021.01.026. [DOI] [Google Scholar]
- El-Sayed M. M.; Shash A. Y.; Abd-Rabou M.; ElSherbiny M. G. Welding and processing of metallic materials by using friction stir technique: A review. Journal of Advanced Joining Processes 2021, 3, 100059. 10.1016/j.jajp.2021.100059. [DOI] [Google Scholar]
- Sun T.; Wu S.; Shen Y.; Jin J.; Lu J.; Qin T. Investigation on Friction Stir Welding of Mg/Al T-Joints. Transactions of the Indian Institute of Metals 2021, 74 (12), 3045–3061. 10.1007/s12666-020-02148-8. [DOI] [Google Scholar]
- Heidarzadeh A.; Laleh H. M.; Gerami H.; Hosseinpour P.; Shabestari M. J.; Bahari R. The origin of different microstructural and strengthening mechanisms of copper and brass in their dissimilar friction stir welded joint. Materalsi Science and Engineering A 2018, 735, 336–42. 10.1016/j.msea.2018.08.068. [DOI] [Google Scholar]
- Jacquin D.; Guillemot G. A review of microstructural changes occurring during FSW in aluminium alloys and their modeling. Journal of Materials Processing Technology 2021, 288, 116706. 10.1016/j.jmatprotec.2020.116706. [DOI] [Google Scholar]
- Das A.; Li D.; Williams D.; Greenwood D. Weldability and shear strength feasibility study for automotive electric vehicle battery tab interconnects. Journal of the Brazilian Society of Mechanical Sciences and Engineering 2019, 41, 54. [Google Scholar]
- Heidarzadeh A.; Mironov S.; Kaibyshev R.; Ç am G.; Simar A.; Gerlich A.; et al. Friction stir welding/processing of metals and alloys: a comprehensive review on microstructural evolution. Prog. Mater. Sci. 2021, 117, 100752. 10.1016/j.pmatsci.2020.100752. [DOI] [Google Scholar]
- Rethnam G. S. N.; Manivel S.; Sharma V. K.; Srinivas C.; Afzal A.; Razak R.K. A.; Alamri S.; Saleel C. A. Parameter Study on Friction Surfacing of AISI316Ti Stainless Steel over EN8 Carbon Steel and Its Effect on Coating Dimensions and Bond Strength. Materials (Basel) 2021, 14, 4967. 10.3390/ma14174967. [DOI] [PMC free article] [PubMed] [Google Scholar]
- Akhtar M. N.; Sathish T.; Mohanavel V.; Afzal A.; Arul K.; Ravichandran M.; Rahim I. A.; Alhady S. S. N.; Bakar E. A.; Saleh B. Optimization of Process Parameters in CNC Turning of Aluminum 7075 Alloy Using L27 Array-Based Taguchi Method. Materials (Basel) 2021, 14, 4470. 10.3390/ma14164470. [DOI] [PMC free article] [PubMed] [Google Scholar]
- Meignanamoorthy M.; Ravichandran M.; Mohanavel V.; Afzal A.; Sathish T.; Alamri S.; Khan S. A.; Saleel C. A. Microstructure, Mechanical Properties, and Corrosion Behavior of Boron Carbide Reinforced Aluminum Alloy (Al-Fe-Si-Zn-Cu) Matrix Composites Produced via Powder Metallurgy Route. Materials (Basel) 2021, 14, 4315. 10.3390/ma14154315. [DOI] [PMC free article] [PubMed] [Google Scholar]
- Sathish T.; Mohanavel V.; Ansari K.; Saravanan R.; Karthick A.; Afzal A.; Alamri S.; Saleel C. A. Synthesis and Characterization of Mechanical Properties and Wire Cut EDM Process Parameters Analysis in AZ61. Materials (Basel) 2021, 14, 3689. 10.3390/ma14133689. [DOI] [PMC free article] [PubMed] [Google Scholar]
- Sharath B. N.; Venkatesh C. V.; Afzal A.; Aslfattahi N.; Aabid A.; Baig M.; Saleh B. Multi Ceramic Particles Inclusion in the Aluminium Matrix and Wear Characterization through Experimental and Response Surface-Artificial Neural Networks. Materials (Basel) 2021, 14, 2895. 10.3390/ma14112895. [DOI] [PMC free article] [PubMed] [Google Scholar]
- Sathish T.; Kaladgi A. R. R.; Mohanavel V.; Arul K.; Afzal A.; Aabid A.; Baig M.; Saleh B. Experimental Investigation of the Friction Stir Weldability of AA8006 with Zirconia Particle Reinforcement and Optimized Process Parameters. Materials (Basel) 2021, 14, 2782. 10.3390/ma14112782. [DOI] [PMC free article] [PubMed] [Google Scholar]
- Chairman C. A.; Ravichandran M.; Mohanavel V.; Sathish T.; Rashedi A.; Alarifi I. M.; Badruddin I. A.; Anqi A. E.; Afzal A. Mechanical and Abrasive Wear Performance of Titanium Di-Oxide Filled Woven Glass Fibre Reinforced Polymer Composites by Using Taguchi and Edas Approach. Materials (Basel) 2021, 14, 5257. 10.3390/ma14185257. [DOI] [PMC free article] [PubMed] [Google Scholar]
- Sathish T.; Mohanavel V.; Arunkumar T.; Raja T.; Rashedi A.; Alarifi I. M.; Badruddin I. A.; Algahtani A.; Afzal A. Investigation of Mechanical Properties and Salt Spray Corrosion Test Parameters Optimization for Aa8079 with Reinforcement of Tin + Zro2. Materials (Basel) 2021, 14, 5260. 10.3390/ma14185260. [DOI] [PMC free article] [PubMed] [Google Scholar]