

Summary
The persistence of play after decortication points to a subcortical mechanism of play control. We found that global blockade of the rat periaqueductal gray with either muscimol or lidocaine interfered with ticklishness and play. We recorded vocalizations and neural activity from the periaqueductal gray of young, playful rats during interspecific touch, play, and tickling. Rats vocalized weakly to touch and more strongly to play and tickling. Periaqueductal gray units showed diverse but strong modulation to tickling and play. Hierarchical clustering based on neuronal responses to play and tickling revealed functional clusters mapping to different periaqueductal gray columns. Specifically, we observed play-neutral/tickling-inhibited and tickling/play-neutral units in dorsolateral and dorsomedial periaqueductal gray columns. In contrast, strongly play/tickling-excited units mapped to the lateral columns and were suppressed by anxiogenic conditions. Optogenetic inactivation of lateral periaqueductal columns disrupted ticklishness and play. We conclude that the lateral periaqueductal gray columns are decisive for play and laughter.
Keywords: play, tickling, midbrain, periaqueductal gray, Neuropixels, laughter, affective neuroscience, optogenetics, vocalizations, instinctive behaviors
Graphical abstract

Highlights
-
•
Blocking the PAG interferes with ticklishness and play in rats
-
•
Unit recordings in the PAG indicate a columnar representation of tickling and play
-
•
Specifically, the lateral column of the PAG is activated during play and tickling
-
•
Optogenetic inactivation of the lateral PAG impaired playful behaviors
Play is critical for the well-being of humans and many animals. Gloveli et al. find that rat periaqueductal gray neurons are modulated by tickling and play. Inactivation of the periaqueductal gray leads to impaired play and ticklishness, indicating a role for the midbrain in playfulness.
Introduction
Of all classes of mammalian behaviors, play is one of the least understood at the neurobiological level. While we have a rough idea about the neural loci responsible for sexual and aggressive behaviors, fear, reward, sensory processing, and even cognition, we cannot delineate the neural circuits underlying play as of yet. We know from extensive cortical lesion studies that play—much like other mammalian behaviors—can proceed without the cortex.1,2 It also seems clear that dopaminergic mechanisms of reward are crucial in maintaining playful behaviors and ticklishness.3
In this study, we investigate the role of the periaqueductal gray (PAG) in play behavior. Several sources of evidence point to the PAG as a possible substrate for play. First, the analysis of immediate early gene expression in animals after play-enriched social interaction4 and the circuit analysis of tickling and laughter in humans5,6 have shown to implicate the PAG. Second, the PAG has a decisive role in controlling vocalizations7,8,9 and positive affect vocalizations are of paramount importance in orchestrating play.10 Third, it was shown that the PAG can gate both attack and escape behaviors,11,12,13,14 which in an altered form also occur in play fighting.15 Fourth, the PAG is involved in the control of most instinctive behaviors.16
Our approach was in many ways inspired by earlier work on rodent play. Accordingly, we work with rats, very playful rodents,17 and study 50 kHz vocalizations as an indicator of playfulness.10 Additionally, we test animals in anxiogenic conditions, which are known to suppress playfulness,18 as an assay for neural correlates of playfulness. Different from earlier work, we focus on high-resolution neural recordings using Neuropixels and tetrode recordings in freely behaving rats. In the context of studying play, such an approach is novel and quite critical; we reckon that the lack of neuronal recordings in freely playing animals is what accounts most for our poor understanding of the neurobiology of play. We engaged in interspecific play because such rat-human paradigms work well for evoking and assessing play under the challenging conditions of neural recordings.18,19 Finally, we assign recorded units to specific columns of the PAG, as the columnar organization is decisive for understanding the PAG.20,21
We ask the following questions: (1) Is the PAG required for play? (2) Do neurons in the PAG respond to touching, tickling, and play? (3) If yes, how are these responses related to one another and is there evidence for a neural bundling of play and tickling responses? (4) Does the play-related activity map onto the PAG columnar organization? (5) How do PAG play-related neurons respond to anxiogenic conditions and vocalizations? (6) Are specific PAG columns required for play?
We found that the PAG is required for play, and we observe play- and tickling-related neuronal activity in the PAG. Specifically, we identified a population of neurons that were strongly excited during play and tickling, which mostly mapped to the lateral PAG columns. In contrast, play-neutral and tickling-inhibited cells mapped to the dorsal PAG columns. Interfering with the lateral PAG columns disrupts play.
Results
Dataset, design, and rationale of our study
Our study was designed to confront the experimental challenges of identifying neural correlates of playfulness, and we briefly review the core elements of our approach before going into the data. Our approach to the problem builds on the pioneering studies of Panksepp and colleagues10,22 and our own previous work.18 Humans and animals need to feel free to play,23 and this is why we could not conduct our study on head-fixed animals. In this study, we use interspecific rat-human play and tickling paradigms,10 in which play can be triggered by the human experimenter and is easily adapted to concomitant recordings18 and intraspecific social play. A particular problem is that play behaviors are altered from regular behaviors, i.e., a play-fighting young rat behaves very similar to an adult rat attacking an intruder.15 Therefore, distinguishing neural correlates of playfulness from neural responses from “normal behaviors” requires additional behavioral and neural evidence. In particular, we studied 50 kHz rat vocalizations—important behavioral markers for positive affect in rats24—and thus gained insight about the emotional state of the animals. Furthermore, we studied neuronal responses under anxiogenic conditions, which are known to suppress playfulness and thus give further certainty if responses are correlated to playfulness. Finally, we make use of the fact that playfulness and ticklishness appear to be profoundly related in rats. Accordingly, it has been consistently found that the more ticklish a rat is, the more playful it will be, and vice versa.10,18,19 Interestingly, the tickling and play (chasing the experimenter’s hand) behaviors we studied are very different in sensory terms (strong tactile stimulation during tickling, compared with no contact and only subtle cues during chasing hand) and motor terms (the animal is less active during tickling than chasing hand). Given these marked sensory and motor differences, we reasoned that it will be unlikely that cells will fire in a similar way to tickling and play if they are not representing playfulness. We therefore placed the clustering of neurons according to their tickling and play responses at the heart of our analysis. With that, our study combines a wide range of stimuli (various forms of touch and sound), behavioral interactions (playing and tickling), behavioral measures (vocalization and video analysis), behavioral conditions (normal vs. anxiogenic), unit recordings, and blocking. The complex analysis aims at a single simple goal, i.e., assessing the role of the PAG in playfulness.
Blockade of the periaqueductal gray interferes with ticklishness and play
As a first step in our analysis, we investigated if the PAG is required for ticklishness and playfulness. To this end, we globally blocked PAG activity by injection of muscimol (a gamma-aminobutyric acid type A [GABAA] receptor agonist) or saline as a control experiment (Figure 1A) during tickling and play (Figure 1B) in 4 rats. Tickling animals dorsally (on their backs, Figure 1C) evoked numerous calls in control conditions but less so after muscimol application (Figure 1D). Similar observations were made in all such blocking experiments, showing a significant effect (p = 0.027; Figure 1E). Call responses to ventral tickling (a very strong tickle stimulus; Figure 1F) were also reduced but not completely abolished by muscimol injection (p = 0.003, Figures 1G and 1H). Similarly, call responses to interspecific play (chasing-hand condition, Figure 1I) were diminished (Figure 1J), and overall engagement in playful behavior decreased significantly after PAG blockage (p = 0.02, Figure 1K). Interestingly, blocking PAG neurons with muscimol did not result in a complete abolishment of ultrasonic vocalizations (USVs) but rather a behavior-dependent reduction in ticklishness and desire to play. In all animals, the effect of PAG blockage resulted in a sharp reduction of USVs during dorsal tickling, while USVs remained present during ventral tickling, albeit significantly reduced.
Figure 1.

Global blockade of the periaqueductal gray with muscimol interferes with ticklishness and play
(A) Example image of guiding cannula tract with DiR visualizing injection site. Scale bar, 0.5 mm.
(B) Schematic of a trial. Sequence of behaviors was computed randomly for each trial with a baseline period between each behavior. CH, chasing hand.
(C) Schematic of dorsal tickling.
(D) Experiment showing raster plot (top) and corresponding histogram (bottom) of USV response to dorsal tickling after saline (left) and muscimol (right) injection. Red bars represent behavior of interest. Time point 0 indicates onset of behavior. Plots show a 4-s baseline and the first 4 s after behavior onset. Note that the behaviors can be of variable length and typically last longer than 4 s. Histogram bin size: 200 ms. USVs shown in black marks, all USV were 50 kHz calls, and there were no 22 kHz fear calls.
(E) Mean USV rate during dorsal tickling after saline and muscimol injection (p = 0.027, n = 4). ∗p < 0.05, paired t test.
(F) Schematic of ventral tickling.
(G) Raster plot and histogram of USVs during ventral tickling trials after saline (left) and muscimol (right) injection. Blue bars in raster plot indicate the flip of the animal before ventral tickling.
(H) Mean USV rate during ventral tickling after saline and muscimol injection (p = 0.003, ∗∗p < 0.01, paired t test,).
(I) Schematic of chasing hand.
(J) Raster plot and histogram of USVs during chasing-hand trials tickling after saline (left) and muscimol (right) injection.
(K) Play engagement during chasing hand after saline and muscimol injection (p = 0.02, paired t test).
Additionally, we blocked the PAG with lidocaine in 6 rats. Results were generally similar across animals, but we had more control conditions and more extensive datasets for 3 of these animals. The data referring to these animals is shown in Figure S1. Blockade at various anterior-posterior levels of the PAG with lidocaine interfered with ticklishness and play. Lidocaine injections, much like muscimol injections, diminished ticklishness and playfulness; however, there appeared to be more side effects of lidocaine injections compared with the muscimol treatment. In line with previous work11,12,13 effects of the PAG lidocaine blockade were not restricted to playfulness and ticklishness but accompanied by motoric changes.
Blocking PAG activity with muscimol or lidocaine reliably reduces ticklishness and play. Conclusively, the PAG is required for ticklishness and play.
Touch and tickling evoke vocalizations and excitation and inhibition in the periaqueductal gray
As a first step in our analysis of how neural responses in the PAG relate to playfulness, we assessed behavioral and neural responses to touch and tickling (Figure 2). Specifically, we studied the effects of dorsal gentle touch (Figure 2A left), dorsal tickling (Figure 2A middle; a moderately intense tickle stimulus), and ventral tickling (Figure 2A right; an intense tickle stimulus, for which the animal is flipped on his back by the experimenter). As expected, there was an increasing rate of USVs from dorsal gentle touch to dorsal tickling and ventral tickling (Figure 2B, left to right).
Figure 2.

Vocalizations and excitatory and inhibitory neural responses in the periaqueductal gray evoked by touch and tickling
(A) Tactile stimulation of rats, from left to right: dorsal gentle touch, dorsal tickling, and ventral tickling.
(B) Peri-event histograms of ultrasonic vocalizations (Hz) aligned on the onset of the tactile stimulation for dorsal gentle touch, dorsal tickling, and ventral tickling. More ultrasonic vocalizations are emitted during tactile stimulation than during baseline/break. The peri-event histograms time span was limited to 4 s for clarity.
(C) Spike raster plots for a neuron recorded in the lateral periaqueductal gray aligned on the onset of tactile stimulation, indicated in red. The flips preceding ventral tickling events have been indicated in blue. The neuron is moderately activated by dorsal gentle touch and dorsal tickling and strongly activated by ventral ticking.
(D) Peri-event spike histograms corresponding to the response to tactile stimulation shown in (C).
(E) Average spike rate during dorsal gentle touch (n = 82 units), dorsal tickling (n = 85 units), and ventral tickling (n = 85 units) is plotted as a function of the average spike rate during baseline/break. Note that the dispersion from the unity line (magenta line) is greater for ventral tickling compared with dorsal gentle touch and dorsal tickling. Magenta circles indicate cells that were significantly modulated. Black circles indicate cells not significantly modulated. The filled circles indicate the example cell shown in (D). The distance of entries from the unity line (magenta line) reflects the response modulation (i.e., excitation or inhibition induced by tactile stimulation) and is noticeably greater for ventral tickling compared with dorsal gentle touch and dorsal tickling.
(F) Histograms of the response indices (computed as evoked − baseline rate/evoked + baseline rate) corresponding to the data shown in (E). Note that the dispersion away from 0 is greater for ventral tickling compared with dorsal gentle touch and dorsal tickling. The magenta bars or fraction of bars show the counts that were significantly modulated. Magenta and black bars are stacked.
We recorded 85 single units in the PAG during play and tickling in 5 rats, which we judged to be playful based on their behavioral and vocalization responses to tickling and play. We determined if individual units were significantly modulated by a stimulus by testing the evoked firing rate against a distribution of firing rates calculated from random sampling from the baseline/break intervals (see STAR Methods). In the lateral PAG unit shown in Figures 2C and 2D, the responses to the behaviors were significantly excitatory, similarly to many other PAG units (N = 31/82 for dorsal gentle touch, N = 37/85 for dorsal tickling, and N = 48/85 for ventral tickling). There were also suggestions of firing rate increases prior to the actual flip and touch, an observation similar to data from the somatosensory cortex.19 Inhibitory responses were less often observed (N = 17/82 for dorsal gentle touch, N = 23/85 for dorsal tickling, and N = 22/85 for ventral tickling). Specifically, in ventral tickling trials, the USVs greatly increased during the flip, before tickling onset. Overall, the number of significantly modulated units (magenta in Figures 2E and 2F) during the different behaviors suggests that PAG units are more modulated by ventral tickling than dorsal tickling and more modulated by dorsal tickling than dorsal gentle touch (N = 48/82 for dorsal gentle touch, N = 60/85 for dorsal tickling, and N = 70/85 for ventral tickling, Figure 2F).
Additionally, the evoked spike rate (Figure 2E) as well as the distribution of the corresponding response indices (RIs, see STAR Methods; Figure 2F) showed a greater dispersion for ventral tickling compared with dorsal gentle touch and dorsal tickling. Eventually, comparing the absolute values of the RIs showed that the modulation was greater for dorsal tickling (median absolute RI = 0.249) compared with dorsal gentle touch (median absolute RI = 0.242) and even greater for ventral tickling (median absolute RI = 0.408). Wilcoxon signed rank tests showed that the absolute response index was higher for dorsal tickling than dorsal gentle touch (p = 0.0035) and that the absolute response index was higher for ventral tickling than dorsal tickling (p = 0.00002).
In summary, the data suggest that tactile stimuli induce varying levels of either excitation or inhibition in the PAG, whereby the response strength may relate to the number of vocalizations evoked by these stimuli.
Play evokes varying levels of excitation in the periaqueductal gray
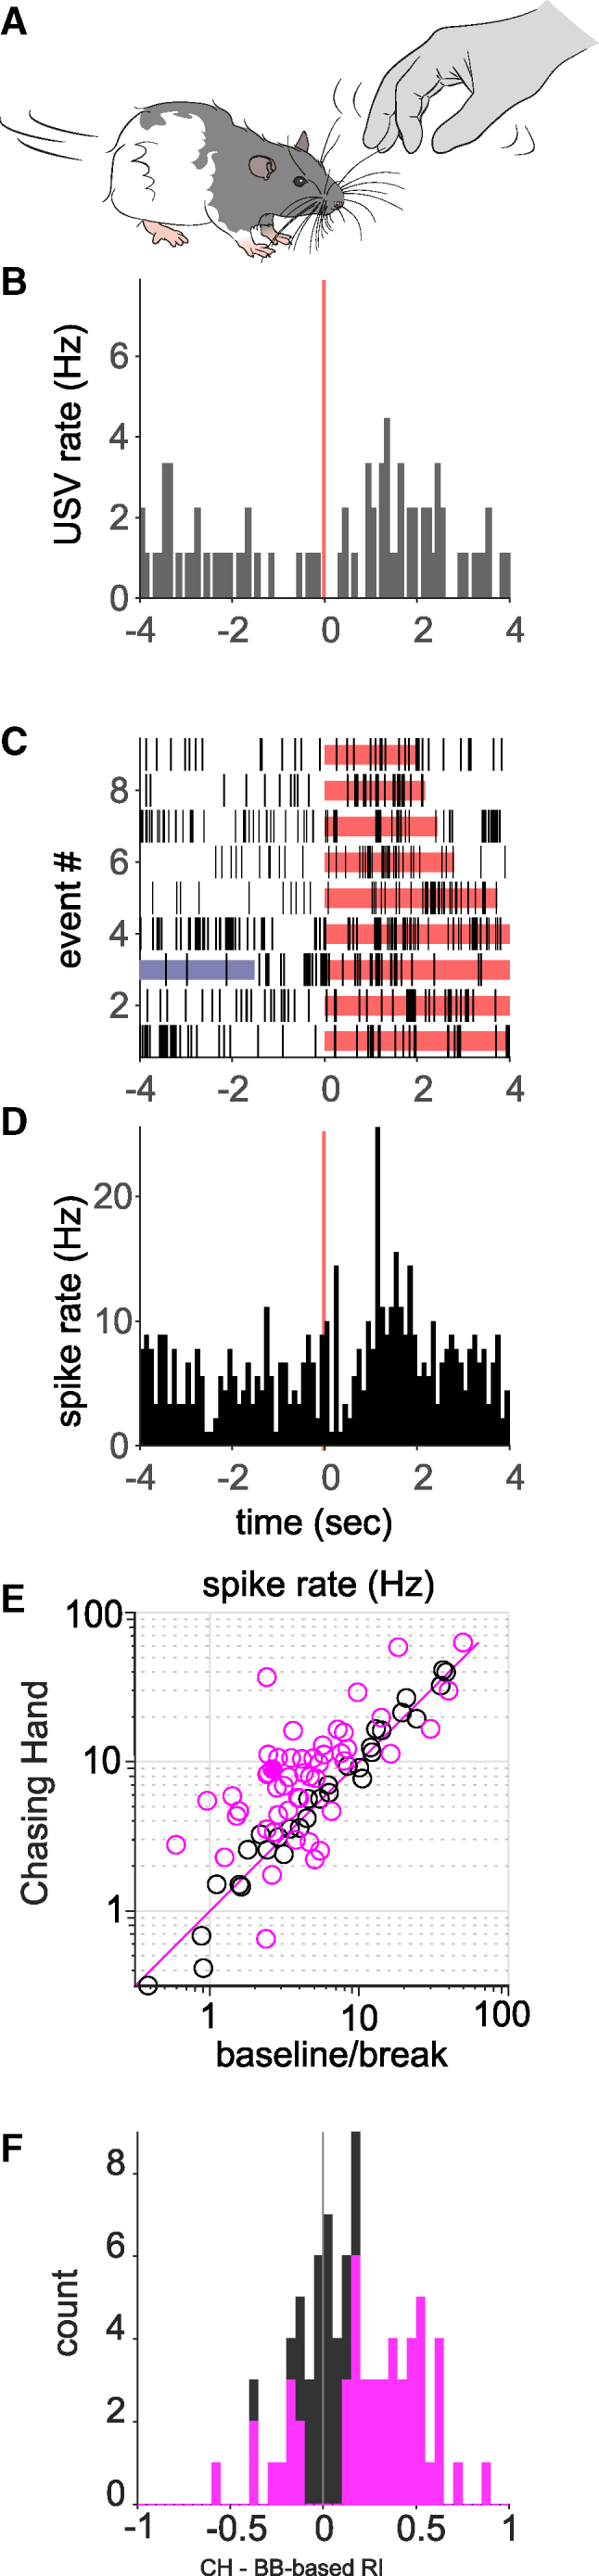
As a second step in our analysis of neural responses in the PAG, we studied play-evoked responses. The form of play we focused on here was the rat chasing the experimenter’s hand (Figure 3A). The rats enjoyed the chasing-hand paradigm, i.e., they spontaneously and quickly engaged in running after the experimenter’s hand and emitted 50 kHz vocalizations (Figure 3B). Neurons in the PAG were modulated at varying levels during such play; the cell in Figures 3C and 3D, located in the lateral column of the PAG, showed a moderate excitatory response. At the population level, the spike rate during play tended to be higher than during baseline/break because most points are above the unity line in Figure 3E and most RIs are positive (Figure 3F). Many units were significantly modulated during play (N = 51/82), with most being excited during play (N = 41), a third being non-modulated (N = 31/82), and only a few being inhibited (N = 10/82, Figures 3E and 3F). We conclude that rat PAG neurons tend to be either excited or unmodulated but rarely inhibited during play.
Figure 3.
Play evokes vocalizations and excitatory neural responses in the periaqueductal gray
(A) We engaged in playful chasing-hand interactions with rats, during which they pursued the experimenter’s hand.
(B) Peri-event histograms of ultrasonic vocalizations (Hz) aligned on the onset of the chasing (red line). The peri-event histograms time span was limited to 4 s for clarity, but the stimulations can be variable. Slightly more ultrasonic vocalizations are emitted during chasing than during baseline.
(C) Spike raster plots for a neuron from the lateral periaqueductal gray aligned to the onset of play (chasing hand), indicated in red. The blue line indicates another event (e.g., tickling) occurring within the displayed window. The unit is moderately activated by play.
(D) Peri-event spike histograms corresponding to the response to play shown in (C).
(E) Average spike rate during chasing hand plotted against the average spike rate during baseline (n = 83 units). Most cells are excited during chasing hand, as most points are above the magenta unity line. Magenta circles indicate cells that were significantly modulated. Black circles indicate cells not significantly modulated. The filled circle indicates the example cell shown in (D).
(F) Histograms of the response indices (computed as evoked − baseline rate/evoked + baseline rate) corresponding to the data shown in (E). Note the rightward shift of the histogram, indicating a predominance of excitatory responses. The magenta bars or fraction of bars show the counts that were significantly modulated. Magenta and black bars are stacked.
Clustering of neurons according to play and tickling responses reveals a systematic mapping of playfulness onto PAG columns
As introduced above, we hoped to identify neural correlates of playfulness through the conjunctive representation of tickling and play in neurons representing playfulness. To assess this possibility, we performed a hierarchical cluster analysis using Ward’s method to group similar cells together based on their responses during chasing-hand and ventral tickling (Figure 4). Chasing-hand and ventral tickling RIs are shown for each cluster in Figures 4A and 4B. Five clusters were distinguished based on their response profiles and a minimum number of data points in each group for statistical relevance. For each cluster, we chose a name describing the activity pattern and a symbol for subsequent plotting of the spatial distribution of the respective cells. As shown in Figures 4C and 4D, there was a highly systematic relationship between response clusters and PAG columns. In contrast, no anterior-posterior differences were apparent in our dataset. The stacked histogram in Figure 4D shows the distribution of the different response clusters to the four PAG columns: the dorsomedial column (N = 12 units), the dorsolateral column (N = 13 units), the lateral column (N = 36 units), and the ventrolateral column (N = 21 units). A chi-squared test showed a highly nonrandom distribution of the response clusters in the different columns (p = 0.0000047). We ran a series of Fisher’s exact tests to assess the nonrandom distribution of a given cluster into a given column compared with the distribution of all other clusters and all other columns combined. Our statistical approach requires a high number of combinations (20), so we ranked the test results by ascending p value and considered only the first one leading to an additive p value lower than 0.05 to be significant (n = 6, see Table S1). The play-neutral/tickling-inhibited clusters (N = 23 units) were most represented in the dorsomedial column compared with other clusters and columns (p = 0.0014, rank 2). The dorsolateral column showed the highest proportion of play/tickling-neutral cells (N = 14 units, p = 0.007, rank 5). The lateral column stands out by its predominance of strongly play/tickling-excited cells (N = 16 units, p = 0.00011, rank 1) and an absence of play/tickling-neutral cells (p = 0.004, rank 3). The ventrolateral column has a lower proportion of play-neutral/tickling-inhibited cells (p = 0.0046, rank 4) and a higher proportion of moderately play/tickling-excited cells (N = 21, p = 0.0099, rank 6). As an alternative analysis, we compared the RIs for ventral tickling and chasing hands between columns and found a similar structure-function relationship (Figure S2). We conclude that a joint analysis of tickling and play responses identifies an excitatory play/tickling hotspot in the lateral columns of the PAG.
Figure 4.

Play and ventral tickling responses map systematically onto periaqueductal gray columns, with a predominance of play/tickling excitation in the lateral column
(A) Response indices for chasing-hand and ventral tickling shown cell by cell on a red to blue color scale, from most activated to most inhibited. Hierarchical cluster tree (dendrogram) obtained using Ward’s method to group similar cells together based on their response index (RI) during chasing-hand (CH) and ventral tickling (VT). Five groups were distinguished based on their response profiles and a minimum number of datapoints in each group for statistical relevance. For each cluster, we chose a name describing the activity pattern and a symbol for subsequent plotting of the spatial distribution of the respective cells.
(B) Scatterplots of the response indices for ventral tickling versus chasing hand.
(C) Picture of unstained coronal slices (100-μm thick) in bright-field microscopy showing the periaqueductal gray anatomy from 3 rats recorded using Neuropixels probes. White dashed lines indicate boundaries of periaqueductal gray columns. The estimated location of the recorded units from distinct clusters is indicated by their respective symbol. Cell symbols were shifted laterally from the track for display purposes to avoid crowding.
(D) Summary stacked histogram showing the distribution of the different response clusters to the four periaqueductal gray columns: the dorsomedial PAG (DMPAG), the dorsolateral PAG (DLPAG), the lateral PAG (LPAG), and the ventrolateral PAG (VLPAG). A chi-squared test showed the distribution of the response clusters to the different columns was highly nonrandom. The chi-squared statistics equals 47.3106 and is improbably large compared with a chi-squared distribution with 12° of freedom (p = 0.0000047). Specifically, the dorsomedial PAG and dorsolateral PAG are characterized by a predominance of play-neutral/tickling-inhibited cells and an absence of play/tickling-excited cells. The lateral columns stand out by predominance of play/tickling-excited cells and an absence of play/tickling-neutral cells. The units of the ventrolateral periaqueductal gray respond in a more heterogeneous way.
Anxiogenic conditions suppress the activity of strongly play/tickling-excited cells
A hallmark of play is its mood dependence, and it has long been recognized that play cannot be initiated without feeling safe and comfortable. We therefore exposed our experimental animals to anxiogenic conditions, i.e., we placed them on an elevated platform under strong illumination (Figure 5A, right). As expected, anxiogenic conditions suppressed USVs evoked by tickling (Figure 5B). Additionally, we assessed the effects of anxiogenic conditions on neural activity in the PAG and observed complex and disparate anxiogenic effects on ongoing activity and evoked neural responses. Given the heterogeneous responses to play and tickling across the PAG, we wondered how anxiogenic effects related to play/tickling responses. To address this question, we separately evaluated anxiogenic effects in the different play/tickling response cell clusters. We found that both the tickling responses of individual (Figures 5C and 5D) and population neurons (Figures 5E and 5F) belonging to the cluster of strongly play/tickling-excited PAG cells were systematically suppressed by anxiogenic conditions (median [1st quartile–3rd quartile]; normal: 11.1 [7.8–40.7] Hz; anxiogenic: 9.16 [5.9–18.2] Hz; N = 15 units in 3 rats, p = 0.002). The other clusters identified in Figure 4 showed more mixed effects (data not shown). We conclude that strongly play/tickling-excited PAG cells show an anxiogenic suppression of tickling responses.
Figure 5.

Units from the strongly play/tickling-excited cluster show less modulation during anxiogenic condition
(A) We compared the neuronal response with ventral tickling (left) in normal conditions to ventral tickling during anxiogenic conditions (right), where the rat was tickled on an elevated platform in a very bright environment. Illustration adapted from Ishiyama and Brecht.18
(B) Peri-event histograms of ultrasonic vocalizations (Hz) aligned on the onset of ventral tickling (red line). Much fewer ultrasonic vocalizations were emitted by the rat during the anxiogenic condition (right).
(C) Spike raster plots for a strongly play/tickling-excited unit located in the lateral periaqueductal gray aligned to the onset of ventral tickling in normal and anxiogenic conditions. Blue bars indicate flip of rat. This unit was much less modulated during anxiogenic conditions.
(D) Peri-event spike histograms corresponding to the rasters shown in (C).
(E) Average spike rate during ventral tickling in anxiogenic condition plotted against the average spike rate during ventral tickling in normal condition (n = 15 units in 3 rats). Most points are below the unity line, suggesting a reduced rate during anxiogenic conditions compared with normal conditions.
(F) Comparison of average rates during tickling in normal condition versus anxiogenic condition showed a significant decrease in firing rate during anxiogenic condition (Wilcoxon signed rank test, p = 0.002).
Strongly play/tickling-excited cells fire prior to and during vocalizations
We then addressed how the PAG activity related to vocalizations. Consistent with previous results,7,8,9 we observed a fraction of PAG neurons that fired prior to and during vocalizations. Another smaller fraction of cells showed vocalization-associated inhibition. Guided by our previous results, we assessed this vocalization-related activity again after sorting cells according to their play/tickling responses as defined in Figure 4. As for anxiogenic effects, play/tickling response clusters differed markedly in the vocalization-related activity (Figure 6). Specifically, we found that strongly play/tickling-excited cells fired prior to and during vocalizations (Figure 6B top). This was not the case for other PAG cells, most of which showed little or no vocalization-related activity (Figure 6C).
Figure 6.

Strongly play/tickling-excited periaqueductal gray cells show strong responses before and during vocalizations
(A) Hierarchical cluster tree (dendrogram) obtained weighing chasing-hand and ventral tickling response indices, with five clusters identified according to activity patterns (see Figure 4 for details).
(B) Color-coded peri-vocalization onset histogram of Z scored responses for each neuron. Time point 0 indicates onset of vocalization. Note that the data were not available for all neurons (n = 4 empty lines). Bin size: 10 ms.
(C) Line-drawing of individual (thin, gray) and average (thick, color) Z scored peri-vocalization responses in each cluster. Note the more pronounced vocalization responses in the strongly play/tickling-excited cluster compared with other clusters.
This finding led us to check whether the play/tickling modulation we described (Figures 2, 3, and 4) could be mainly due to the presence of vocalizations. For this, we simply recalculated the firing rate during ventral tickling, but this time by excluding short interval windows surrounding call onsets (Figure S3). This showed that the firing rate of most cells, especially those from the excited clusters, was only slightly affected by the calls during tickling and reinforced our initial finding.
We also analyzed auditory responses of PAG cells to playback of a variety of sounds (Figure S4). In our preliminary analysis, it appeared that some cells were selective for specific sounds (i.e., 50 kHz calls vs. fear calls), but also that most cells strongly reacted to white noise stimuli. Response to auditory playback seemed to differ between clusters. Specifically, the strongly play/tickling-excited cells responded more to auditory playback compared with the play-neutral/tickling-inhibited cluster. We conclude that strongly play/tickling-excited PAG cells might drive laughter, as most of them discharge strongly prior to and during vocalizations.
Optogenetic interference with lateral PAG column activity disrupts ticklishness and play
Our recordings suggested that play-activated cells mapped to the lateral columns of the PAG and that lateral column cells showed anxiogenic suppression and vocalization-related activity. Prompted by these observations, we wondered if the lateral PAG columns are required for play. To address this question, we virally transfected PAG bilaterally with an ArchT or GFP (control animals) and implanted light guides aiming at the lateral columns (Figure 7A). Histology showed that both viral expression and light guides accurately targeted the lateral PAG columns (Figure 7B). Light-induced archaerhodopsin TP009 (ArchT) activation (optogenetic inhibition) suppressed vocalization responses to ventral and dorsal tickling (ventral: p = 0.01, n = 4 rats; dorsal: p = 0.049, n = 3 rats, paired t test), whereas light application in GFP (control animals) had no effect (Figure 7C). Light-induced ArchT activation also suppressed social play (Figures 7D and 7E, p = 0.016, n = 3), but had no effect in control animals. We conclude that the lateral PAG columns are required for ticklishness and play.
Figure 7.

Optogenetic inhibition of the lateral columns interferes with ticklishness and play
(A) Schematic drawing of the bilateral stereotactic injection of AAV8-CAG-ArchT-GFP or AAV8-CAG-GFP into the lateral columns of the PAG and optical fiber implantation above the lateral PAG.
(B) Representative image showing the ArchT-GFP injections and the placement of optical fibers (red line) in one example rat from the ArchT group. Scale bars, 500 μm.
(C) Vocalization responses to dorsal (left) and ventral (right) tickling are suppressed by light-induced ArchT activation (optogenetic inhibition) but not by illumination of virally expressed GFP (control animals) (dorsal tickling: p = 0.049, paired t test; ventral tickling: p = 0.01, paired t test).
(D) The graph illustrates the USV rate (bin size = 5 s) and different social play episodes in a representative ArchT-expressing (top) or control GFP (bottom) rat in the rough-and-tumble play assay. Constant yellow light (10–15 mW, 561 nm, 10 s) was delivered to LPAG unilaterally or bilaterally six times.
(E) During the illumination period, ArchT-rats spent significantly less time on social play than control animals (two-way ANOVA group × epoch interaction, F2,12 = 2.976, p = 0.089; a Bonferroni post hoc test was performed following a two-way ANOVA, and p = 0.016, ∗p < 0.05). Error bars indicate mean ± SEM.
Discussion
Summary
We found that the global blockade of the PAG interferes with ticklishness and play. PAG neurons strongly react to tickling and play with diverse response patterns. Cells neutral to play and inhibited by tickling are found in the dorsomedial and dorsolateral PAG columns, whereas strongly tickling and play-excited cells map to the lateral column. Such strongly tickling and play-excited cells are suppressed by anxiogenic conditions. Finally, we show that the selective inhibition of lateral PAG columns interferes with ticklishness and play.
The periaqueductal gray is critically involved in play
Our blocking experiments support the idea that a properly functioning PAG is required for play and ticklishness. It is striking to see how tickling evokes intense vocalizing in intact animals, yet 50 kHz calls and play are suppressed under inhibition of the PAG in the same animal. Such suppression occurs even though the animal is able to vocalize. The behavioral changes from PAG blockade are massive and occur across the entire anterior-posterior PAG axis. Both muscimol and lidocaine applications block play. The details of the blocking effects differ, however. Specifically, muscimol as a GABAA-agonist should have no effect on fibers of passage, which may render the results more specific and reduce side effects compared with lidocaine application. Additionally, the strongest (ventral) tickling stimuli can still elicit USVs under blockade, and we wonder if the strong sensory evoked by these stimuli overrides the blocking effects. The blocking effects align with other evidence pointing to an involvement of PAG in play. Such evidence includes immediate early gene expression in dorsal PAG of animals after play-enriched social interaction4 and circuit analysis of tickling and laughter in humans5,6 implicating the PAG. Furthermore, anxiogenic conditions typically have an arousing effect on rats. Therefore, the suppression of play/tickling-activated neurons in the lateral column by anxiogenic conditions indicates to us that the activity of these cells does not simply mirror arousal during play. The idea that the PAG mediates play is enforced by our observations on the strong response modulation of PAG neurons by tickling, play, and 50 kHz calls. We also note that the effects of PAG blockade were much more profound than the rather subtle effects of extended cortical lesions on play.1,15 Almost certainly, the lateral PAG does not act alone but controls play and tickling in coordination with a variety of other brain structures, such as the lateral hypothalamus,25 the amygdala,26 and the somatosensory18 and prefrontal cortex27
Columnar organization of play and tickling responses
Our idea of the organization of the PAG in vertically stacked columns extending along the anterior-posterior axis emerged from convergent anatomical and physiological observations.20 Several of our observations suggest that the representation of play in the PAG follows this columnar organization. Physiological responses to play and tickling also followed a columnar pattern, and many of the response patterns were consistent with previous work on PAG columns. In particular, the predominance of play-neutral/tickling-inhibited cells and an absence of play/tickling-excited cells in dorsomedial and dorsolateral columns confirms other work pointing to a role of these columns in fear and escape responses (see Lefler et al.14 for a recent review). The predominance of strongly play/tickling-excited neurons in the lateral PAG column will be discussed below.
How does the periaqueductal gray and its lateral column orchestrate play?
Our understanding of the neural mechanisms of play control in the PAG is in its infancy. Although our data firmly establish the role of the PAG in play control, we emphasize that it is not yet clear how play is implemented in these neural circuits. However, previous work and our data allow novel preliminary conclusions on the organization of play and tickling in the PAG: (1) We report intense responses to tickling, a strong tactile stimulus. We recorded 36 neurons from the lateral column in our study, and interestingly, many of them showed intense tickling responses with high evoked average firing rates (>25 Hz, Figures 2, 3, and S2). Achieving such average firing rates for the strongly intermittent tickling stimuli requires instantaneous rates above 100 Hz. In hundreds of recordings from the trunk somatosensory cortex (a tactile and strongly play-related neural structure), we have not seen such intense responses.18 (2) We saw cells with polymodal responses, specifically the play/tickling-excited cells, which displayed higher auditory responses compared with other PAG neurons (Figure S3). The high auditory responsiveness of play/tickling-excited cells might be functionally relevant for play. Indeed, playful animals and humans are highly reactive to sensory stimuli, and sensory unresponsiveness is a firm indicator of non-playfulness. (3) The mood dependence and anxiogenic suppression that we observed for the strongly play/tickling-excited cells are the defining features of a play-related activity. (4) Almost all strongly play/tickling-excited cells also show vocalization-related activity. The play accompanying 50 kHz vocalization in rats, or laughter in humans, is an essential social signal coordinating play. For example, during play fighting, they allow partners to communicate so that they can execute a behavior that is distinct from real fighting.15 (5) Because tickling and play are so different in terms of motor-sensory pattern, the observed conjunctive representation of play and tickling responses in strongly play/tickling-excited cells in the lateral PAG column is anything but trivial. It strongly suggests that these neurons are more likely to be related to play than to mere sensory information or motor commands. (6) In accordance with the physiological responses, our optogenetic inhibition experiments show that the lateral column is required for play.
A synopsis of our data strongly implicates PAG circuits in the control of play behavior. It would be worthwhile determining if PAG cells are sensitive to other aspects of play not tested in this study. Specifically, rules are fundamental to play.23 Rats get frustrated if human players violate rules in a rat-human hide-and-seek game,27 for example, if human players don’t hide properly (Brecht, personal observation). It would be worth finding out if PAG neurons are sensitive to rules and the numerous other intricacies that make play behavior so fascinating.
STAR★Methods
Key resources table
| REAGENT or RESOURCE | SOURCE | IDENTIFIER |
|---|---|---|
| Chemicals, peptides, and recombinant proteins | ||
| Ketamine | Medistar Arzneimittelvertrieb, GmbH | N/A |
| Xylazine | Medistar Arzneimittelvertrieb, GmbH | N/A |
| Rimadyl | Zoetis Deutchland GmbH | N/A |
| Lidocaine | Belapharm, Vechta | N/A |
| Lidocaine | B. Braun SE, Melsungen, Germany | N/A |
| Muscimol | Alomone Labs,Jerusalem Israel | N/A |
| Metamizol | ratiopharm GmbH, Ulm, Germany | N/A |
| NaCl 0.9% | B. Braun SE, Melsungen, Germany | N/A |
| Urethane | Sigma Aldrich | N/A |
| Eye cream Bepanten, Bayer | Medios Apotheke an der Charté, Anike Oleski e.Kfr, Luisenstraße 54/55, 10117 Berlin | N/A |
| Sodium Chloride NaCl | Carl Roth GmbH, Karlsruhe, Germany | N/A |
| Potassium Chloride KCl | Sigma Aldrich | Cat# P5405-250G |
| Magnesium Chloride Hexahydrate MgCl2-6H20 | Carl Roth GmbH, Karlsruhe, Germany | Cat# 2189.2 |
| Calcium Chloride Dihydrate CaCl2-2H20 | Carl Roth GmbH, Karlsruhe, Germany | Cat# HN04.1 |
| HEPES - 4-(2-Hydroxyethyl)-piperazin-1-ethansulfonsäure- | Carl Roth GmbH | Cat# 9105.4 |
| Agarose Standard | Carl Roth GmbH, Karlsruhe, Germany | Cat# 3810.2 |
| Optibond Kit All in one, Kerr, GmbH | Altschul Dental GmbH, Mainz, | Cat# 80691 |
| Charisma, Kulzer GmbH | Altschul Dental GmbH, Mainz, | Cat# 21463 |
| Paladur, Kulzer GmbH | Altschul Dental GmbH, Mainz, | Cat# 82462 |
| Kwik cast Silicone sealant | World Precision Instruments, Sarasota, FL, USA | N/A |
| Super Glue | UHU GmbH & Co. KG Bühl/Baden, Germany | N/A |
| DiI (1,1′-Dioctadecyl-3,3,3′,3′-tetramethylindocarbocyanine perchlorate) | Sigma Aldrich | Cat# 42364 |
| DiR; DiIC18(7) (1,1′-Dioctadecyl-3,3,3′,3′-Tetramethylindotricarbocyanine Iodide) | Thermo Fischer Scientific, Waltham, MA, USA | Cat# D12731 |
| Bacterial and Virus Strains | ||
| AAV8-CAG-GFP | Charité Viral Core Facility | N/A |
| AAV8-CAG-ArchT-GFP | University of North Carolina Vector Core | N/A |
| Experimental models: Organisms/strains | ||
| Rats Long Evans males | Janvier labs | N/A |
| Hardware | ||
| Neuropixels 1.0 probes and control system | IMEC | N/A |
| Harlan 8 drive, tetrode building systems, electrode plating system (NanoZ) and acquisition system (digital lynx sx) | Neuralynx, Inc., USA | N/A |
| nanoZ | White Matter, Seattle, WA, USA | N/A |
| Stereotactic apparatus | Narishige Scientific Instrument Lab., Tokyo, Japan | N/A |
| logger for wireless tetrode recordings: former version of ratlog64 | Deuteron Technologies Ltd | N/A |
| Ultrasonic microphones | Avisoft Bioacoustic, Glienicke/Nordbahn, Germany | Cat# CM16/CMPA / Knowles FG-O |
| UltraSoundGate | Avisoft Bioacoustic, Glienicke/Nordbahn, Germany | 416H |
| UltraSoundGate player | Avisoft Bioacoustic, Glienicke/Nordbahn, Germany | 116H |
| Ultrasonic speaker | Avisoft Bioacoustic, Glienicke/Nordbahn, Germany | Cat# 60108 |
| CED - Power1401 625 kHz | Cambridge Electronic Device | RRID:SCR_0016040 |
| Dell Workstations 5820T. | Dell | |
| 561 nm DPSS laser | Changchun New Industries Optoelectronics | Cat# MBL-FN-561-1 |
| Optic fiber implants | Thorlabs | Cat# FT200UMT |
| Guide cannulas, G26 needles, Sterican ® | B. Braun SE, Melsungen, Germany | Cat# 4657683 |
| Injection cannulas, Nanofil Needles, 33G BVLD | World Percision Instruments, Sarasota, FL, USA | Cat# NF33BV-2 |
| Syringe, Nanofil 10 μl | World Percision Instruments, Sarasota, FL, USA | NANOFIL |
| Software and algorithms | ||
| MATLAB R2019b | The Mathworks | RRID:SCR_001622 |
| Deepsqueak (Ultrasonic vocalization detection and curation) | Russell Marx, Kevin Coffey, Robert Ciszek, & Lara Valderrabano | RRID:SCR_021524 |
| ELAN version 6.1 | Max Planck Institute for Psycholinguistics, The Language Archive, Nijmegen, The Netherlands | RRID:SCR_021705 |
| Kilosort 2.0 and 2.5 (spike sorting for tetrodes) | Marius Pachitariu | RRID:SCR_016422 |
| Kilosort 3 (spike sorting for neuropixel) | Marius Pachitariu | RRID:SCR_016422 |
| Anaconda with Python 3.7.4 | Anaconda Inc. | RRID:SCR_008394 |
| Phy2 (spike sorting curation) | Cyrille Rossant | N/A |
| Spike2 | Cambridge Electronic Device | RRID:SCR_000903 |
| ImageJ | NIH | RRID:SCR_003070 |
| Prism8 | GraphPad | RRID:SCR_002798 |
| Deposited data | ||
| Figure data | Mendeley Data | https://doi.org/10.17632/chnfyfd2k9.1 |
| Custom MATLAB codes | Mendeley Data | https://doi.org/10.17632/chnfyfd2k9.1 |
Resource availability
Lead contact
Further information and requests for resources and reagents should be directed to and will be fulfilled by the lead contact, Michael Brecht (michael.brecht@bccn-berlin.de).
Materials availability
This study did not generate new unique reagents.
Experimental model and study participant details
All experimental procedures were performed according to German guidelines on animal welfare (License numbers G0279/18, G0072/21).
Male juvenile Long-Evans rats were commercially acquired by Janvier (3 to 4-week old on arrival). Animals were allowed ad libitum access to food and water and were maintained in a 12-h light / dark phase. Animals were handled at least once a day for 1 to 2 weeks prior to experiments. All experimental procedures, including behavioral habituation, surgeries and recordings were done during the dark phase.
Method details
Behavioral paradigm and videography analysis
Before experiments started the rats were habituated to the experimenter and tickling environment to ensure the animals were comfortable and playful. We used an identical layout as the one described in previous work from our team.18 Briefly, the rat was transferred from his home cage to a test box (made out of plastic, 43 x 30 cm, 26 cm height), i.e. the playground, disposed in relative darkness (< 20 lx) to reduce stress and promote playful behavior (referred to as “normal condition”). Rats became ticklish and playful after ∼2-7 days of habituation. After a brief initial period (generally 10-30 seconds), the behavioral paradigm was initiated with repetitive exposition to different sensory stimulations (dorsal and ventral tickling, and dorsal and ventral gentle touch, Figure 2), playful interactions (chasing hand, Figure 3), as well as “baseline” periods during which the hand of the experimenter was fully removed from the environment and “break” periods during which the experimenter left their hand immobile on the top edge of the environment. The experimenter wore cotton gloves which were not renewed throughout the experiment. Ideally, each sensory stimulation/play phase lasted 5-7 seconds with 5-7 seconds baseline or break phase in between and, all of those phases executed following random sequences, each sensory stimulation/play phase repeated at least 7-8 times.
Only dorsal and ventral tickling were performed during anxiogenic conditions.
During neural recordings, initial experiments did not always have standard structures with accurately defined times for each phase, but we used data from sessions during which a given phase was executed at least 3 times or lasted 20 seconds.
Although we aimed to execute sensory stimuli in a systematic way, there was no way to eliminate trial-to-trial variability of an animal’s ticklishness and engagement in playfulness, due to the very nature of the behaviors we are investigating. Indeed, play is defined by its freedom and fragility towards other stimuli, and therefore, trial-to-trial variability is always to be expected.
Animals that were not ticklish in normal condition were not used for analysis. Additionally, when a rat did not become ticklish to dorsal tickling stimuli (Figures 7 and S1), it was not included for analysis of this stimuli.
One top-view and one side-view cameras (60 fps) were used for continuous videography under infrared illumination. The onset and offset times of the behavioral phases were identified using ELAN 6.1 software (Max Planck Institute for Psycholinguistics, Netherlands28). Schematics of rats for Figures 1, 2, 3, 5, and S1 were adapted from Ishiyama et al.19
Videos of the behaviors and stimuli described above are available with our initial publication about ticklishness and play in rats.18
Ultrasonic vocalization recording and analysis
Ultrasonic vocalizations (USVs) were monitored using either a condenser ultrasound microphone (CM16/CMPA-5V) or an omnidirectional electret ultrasound microphone (Knowles FG-O, Avisoft-Bioacoustics, Glienicke/Nordbahn, Germany) situated ∼50 cm above the floor of the environment, preferentially in a central position.
The ultrasonic microphone was connected to the Avisoft-UltraSoundGate 116H and the signal were acquired and digitized with a 16-bit resolution at 250 kHz using Avisoft-RECORDER USGH software (Avisoft Bioacoustics, Glienicke/Nordbahn Germany) running on a Dell Workstation 5820T.
USVs were detected using DeepSqueak 1.0 and curated using DeepSqueak 2.7.0 (see key resources table). The curation consisted of visual examination of each one of the detected USVs, either to validated USVs, refine their detection box, reject false positive events, or add missed USVs (false negative) by adding new detection boxes (see https://github.com/DrCoffey/DeepSqueak). Deepsqueak allowed a highly reliable detection of USVs onset and offset with our dataset, we did not classify the detected USVs into dinstinct subgroups (flat, modulated, trills...).
In “playback” experiments, we played audio signal (pure tone, white noise, USVs) to the animals using an UltraSoundGate player 116H and vifa speaker (Avisoft Bioacoustics, Glienicke/Nordbahn Germany). As these playback signals were captured by our sound recording system, they were individually detected and manually categorize as “Pure-Tone”, “White-Noise”, “Fear-Calls”, “50kHz-Calls” with DeepSqueak to differentiate them from the USVs emitted by the Rat.
Blocking experiments
Surgery – implantation of guiding cannula
Animals (3-4 weeks, 60-80g) were anesthetized with isoflurane (1.5% vol/vol in oxygen) throughout the surgery. Body temperature was maintained with a heating mat and continuously monitored, as well as breathing rate and reflexes. Animals were injected with carprofen (5mg/kg) subcutaneously 30 min before surgery. Animals were fixed into stereotactic apparatus, lidocaine (2%, B. Braun SE, Germany) was administered under the scalp and eye cream (Dr. Winzer Pharma GmbH) was applied. To ensure precise cannula implantation leading to the PAG, the coordinates for the implants were calculated for each animal individually, based on the distance between Bregma and the Interaural Line, to correct for the slightly smaller brain of the adolescent rats compared to the adult rat brain coordinates.29
Guiding cannulas were made out of sterilized (100% EtOH overnight) G26 needles (B. Braun SE, Germany), with a 7 mm tapered tip and a 1 cm polyethylene tubing on the opposite end of the needle. Craniotomies were made bilaterally and cannulas were lowered at a 9 degree angle for minimal brain damage at stereotactic coordinates AP: -7.68, ML: 1.63 and DL: 2.46 (in mm relative to Bregma). The cannulas were thereby implanted above the PAG, allowing the injecting needle to reach the desired injection depth in the PAG. Guide cannulas were fixed in place with acrylic glue (UHU GmbH & Co. KG, Germany) and polyethylene tubing of the cannula was temporarily sealed. An anchor screw was screwed into skull for improved stabilization of the implant. The implant was additionally protected with a 3D-printed plastic cap with a removable lid (height 11 mm and held in place with dental phosphate cement pasta (Hoffmann Dental Manufaktur GmbH, Germany).
Recovery and experiment preparation
The animals were given metamizole dissolved in drinking water (200mg/kg) one day before and three days after the surgery to reduce post-operative pain and inflammation and recovered for one week. The day prior to experiments the cap of the implant was removed and the polyethylene tubes cut allowing the injection needle (Hamilton syringe and 33 Ga x 10 mm needle, NanoFil #NF33BV) to pass through the cannulas. The rats were injected bilaterally with 2 μl of isotonic 0.9% NaCl solution (B. Braun SE, Germany) to reduce stress of novelty of the injection procedure during experiments.
Muscimol, lidocaine and control experiments
The rats were habituated to the play arena and experimenter 5 days prior to experiments. For an experiment, rats were briefly constrained and injected unilaterally with 2 μl of either saline solution, lidocaine (20mg/ml) or muscimol (100 μM diluted in saline solution, Alomone Labs, Israel) into the PAG through the guiding cannulas. After 30 seconds to 1 minute of break rats were placed into the ticking arena. The sensory stimulations of dorsal tickling and ventral tickling and the playful interaction of the rat chasing the experimenter’s hand were induced in a random sequence, each lasting 5-7 seconds, separated with a baseline period of 7 seconds. An experiment lasted a total of 8 minutes for one condition (control/muscimol/lidocaine). Animals that were not ticklish were not used for analysis.
Histology
After experiments, animals were killed by overdose of isoflurane and their brains were removed and transferred to a 4% paraformaldehyde solution overnight, after that the brains were transferred to a phosphate buffer solution containing 0.1% NaN3. The injection sites were visualized with an injection of DiR post-mortem for post-hoc analysis. Brain was sliced in 300 μm thick slices and visualized under Leica binocular (4x magnification).
Unit recordings, anatomy and analyses
Tetrode and Neuropixels recordings were made in 5 young (6 to 8 weeks-old) male Long-Evans rats (200 - 250 g).
Pre-implantation preparation
Surgical procedures were all performed in 6-week old animals under ketamine (100 mg/kg) and xylazine (7.5 mg/kg) anesthesia. Body temperature was maintained with a heating pad and continuously monitored by a rectal probe (Stoelting, Wood Dale, IL, USA). Breathing frequency and pain reflexes (pinching the hind-paws), were continuously monitored during the experiment and booster doses of anesthetics were administered if required. After fixating the animal's head onto a stereotactic apparatus (Narashige Scientific Instrument Lab., Tokyo, Japan), lidocaine was injected subcutaneously under the scalp. After 5 minutes, a patch of skin was excised from the top of the skull in order to expose most of the skull surface. The frontal, parietal and interparietal bones were scraped out of conjunctive tissue, abundantly rinsed with Ringer (in mM, 135 NaCl, 5.4 KCl, 1 MgCl2-6H2O, 1.8 CaCl2-2H2O, 5 HEPES, pH 7.2, Osmolality 290 mOsm/kg H2O) and dried with an air blower. The bregma-lamdba relative dorso-ventral distance was adjusted to be less than 0.1 mm and the central position of the craniotomy was then targeted on the skull using a surgery pen (from Bregma: - 7.2 mm AP; 0.5 mm ML). All micromanipulations were done using Luigs-and-Neuman Junior micromanipulators (with 4 axes, XYZZ) coupled to a SM-6 Controler and Keypad. The exposed skull surface was treated with a UV-activated bonding agent (Optibond All-In-One). Two gold-plated screws were fixed away from the craniotomy, either in the interparietal or in the frontal bones in order to provide a contact for grounding. We then applied Charisma (another UV-activated dental composite) on top of the Optibond layer, around and atop of the gold screws, and around the craniotomy location to create a shallow well. The craniotomy and durotomy were then executed, their size and shape depending on the type of implant. A rectangular 1 x 2 mm craniotomy (ML x AP) was made for the Harlan 8 microdrive implant and a round craniotomy of ∼1 mm diameter was made for the Neuropixels probe implant.
Tetrode drive, implant, daily lowering and data acquisition and lesions
Prior to surgery, we built a Harlan 8 drive (Neuralynx Inc, USA, see key resources table) consisting of eight independently movable tetrodes following the basic mounting instruction provided by Neuralynx Inc. Our tetrodes were arranged in a 2 by 4 matrix with 0.5 mm separation distance between neighboring tetrodes. Tetrodes were turned from 12.5 μm diameter nichrome wire (Sandvik, Sandviken, Sweden) and gold plated to reach an impedance of around 250 kΩ (NanoZ). To help identifying tetrodes tracks in the brain, tetrodes we stained with fluorescent tracers DiI (ThermoFisher Scientific Inc., USA) just before implantation.
Once the implant was ready to receive the drive, the microdrive guide tubes were briefly immersed in mineral oil, in order to prevent liquids from getting into the drive. Using a micromanipulator, the drive was positioned such as the guide tube was just atop of the brain surface, and potentially, but not necessarily, in contact with the brain. At this step, the AP/ML targeting was often finely adjusted to prevent the tetrode to hit the sagittal or confluent sinus which typically happen to be at the same coordinate used for targeting the periaqueductal gray (PAG). The entire craniotomy area was covered with 1% agarose also embedding the L-tube. The microdrive was then secured with dental cement (Paladur, Heraeus Kulzer, Hanau, Germany). Tetrodes were initially lowered by ∼1-2 mm into the brain. Recordings typically began 2-3 days after surgery. Tetrodes were advanced by a minimum of 150 μm every day at least 1 hour before each recording to ensure that new units were sampled during the course of the experiment.
Neural signals were acquired at 32 kHz using a 32-channel wire free neural logger developed by Deuteron Technologies. The system consists of a headstage and a processor board, performing amplification, digitization and processing of the signal, which was then stored on a micro SD card. The whole system was mechanically attached to the cap of the Harlan-8 drive and covered by a protective foam. The processor board of the Neural Logger receives and transmits radio signals allowing for communication with a base station, allowing an accurate synchronization via TTLs between the base station and the logger. The TTLs were also sent by the base station to the Avisoft-UltraSoundGate 116H as well as to an LED visible from both cameras for synchronization of all devices. Typically, the TTLs were 100 ms long and sent every 1 second with a jitter of 200 ms, therefore providing a random TTL train enabling a non-equivoque alignment of signals from distinct device.
After the final recording session, the animals were deeply anesthetized with 20% urethane (5 ml/kg) and electrolytic lesion were performed by injecting 10 μA negative current through the tetrodes for 10 seconds (done with nanoZ). Each individual tetrode track was specifically tagged with a unique set of lesions to allow their post-hoc identification. In brief, one lesion was applied at the location of the last recording (end of the track) and then a pattern of lesion was done along the tracks according to a pattern specific to each individual tetrode.
Neuropixels implant and recording
Neuropixels 1.0 probes30 were prepared by soldering the reference and ground pins together and connected to a gold pin via a silver wire (for later connection to its counterpart linked to the skull’s ground screws). The probe was then fixated in a homemade holder designed to solidly hold the probe connected to its headstage and to be implanted on the skull. Just before implantation, the probe was briefly (∼1 min) immersed in DiI in order to label the track left by the electrode. The probe was then positioned ideally at 7.2 mm antero-posterior (AP) and 0.5 mm medio-lateral (ML), just atop of the brain surface. Similarly, to the tetrode implantation, the AP/ML targeting was finely adjusted, making sure to avoid the sinuses. At this point, the reference pins were connected to the screw pins and the cable connected to headstage so the Neuropixels signals could be monitored while descending the probe. The probe was then lowered down at a speed of ∼5 μm per seconds until 5.5 to 6.5 mm from the surface. Monitoring was turned off and the cable was unplugged before further proceeding. We used Kwik-cast silicone sealant (World Precision Instrument, Sarasota, FL, USA) to seal the craniotomy and protect the exposed electrode tip, especially from dental cement spillover. The holder was then solidly attached using dental cement (Paladur, Heraeus Kulzer, Hanau, Germany), released from the micromanipulator and finally protected by cementing part of a 50 ml conical centrifugation tube around the holder and reference pins. The cap of the tube was used to close the half tube and protect the implant while the rat was let free in the cage; a modified cap, with a hole and a holder to twist and attach the cable around - avoiding tension on the connector while the rat was moving around -, was used for recordings. Our implantation system still requires optimization and is quite comparable to others.31,32 Most importantly, our approached allowed stable recordings during individual sessions and also from session to session. For synchronization, we generated non-regular TTL trains using Spike2 coupled to a CED - Power1401 625 kHz (Cambridge Electronic Device, Cambridge, UK), that were sent to the Neuropixels PXIe acquisition module, the Avisoft-UltraSoundGate 116H as well as to a LED visible from both cameras. TTLs were typically 100 ms long and sent irregularly for a 15-20 second sequence, constantly repeated along the experiment, allowing a non-equivoque alignment of all signals.
Experimental setup during unit recordings
We used an identical layout in the behavioral paradigm described above (“normal condition”). Anxiogenic condition, known to suppress tickling-evoked USVs,18 consisted in constant high intensity illumination and an elevated platform (15 x 15 cm, 27 cm height, Figure 5). The remaining components of the behavioral set up were left unchanged. The platform still allowed for the rat to be turned on the back for ventral tickling.
Histology
Animals were killed by overdose of 20% urethane (30 ml/kg), and perfused transcardially with 0.1 M PBS (phosphate buffer saline) followed by 4% paraformaldehyde solution. Brains were dissected out of the animal’s skull and were placed in the 4% paraformaldehyde solution for 12–24 h, and then in 0.1 M PB (phosphate buffer). Coronal sections (80-100 μm thick) were obtained using a vibratome (Mikrom, HM 650 V, ThermoFisher Scientific). Sections were not mounted, but were instead briefly transferred on slides for acquiring fluorescent and brightfield images (Leica DM 5500B). The brightfield images allowed to accurately define the border of the areas of interests, i.e. the PAG from the neighboring areas and the PAG columns. The lesions induced with the tetrodes and the tracks left by the electrodes (tetrodes or Neuropixels) were, most of the time, identifiable on the brightfield images. The DiI coating of the electrodes left a red fluorescent trace which was used to confirm the location of the electrode tracks. For each session, tetrodes or Neuropixels channels were assigned to areas and antero-posterior levels, in order to determine the position of each unit depending on their waveform profile across channels. Assignment of channels to areas was done mostly by measuring distances from the tip of the track, span of each area along the track. Distances were measured on individual slices and then corrected depending on the angle of the electrode relative to the slicing angle. Shrinkage could be accurately corrected for tetrode experiment by looking at the distance between lesions, and was estimated for Neuropixels experiments correlating physiological signals along the probe and anatomy of the track. For this we used physiological landmarks such as the electrode signal standard deviation or presence/absence of spikes. These were also useful for final alignment of the electrodes with the track, beyond the shrinkage correction, such as drift across sessions. For example, channels located in the aqueduct had the lowest standard deviation, channels in white matter tend to have lower standard deviation than in grey matter, or more generally the limits between two distinct areas were often marked by a sudden change of standard deviation, spike rate or spike amplitude (We actually never used spike amplitude for alignment, but spike shape signature should be an additional way to do so).
Spike sorting
Spikes were detected and clustered from the band-pass filtered data (0.3 – 4 kHz) or high pass filtered (>0.3 KHz) using Kilosort 2.5 for tetrode recordings or Kilosort 3 for Neuropixels recordings (see key resources table) and clusters were subsequently curated with Phy2. Detected clusters were categorized as noise or good based on standard criteria such as the presence of the unit all along the session, the spike amplitude pattern (high enough and different across channels) and the presence of a clear refractory period (none or low autocorrelation below 2 ms). Finally, we merged clusters using the similarity function of Phy2 and visual inspection of spike waveforms, autocorrelograms, and crosscorrelograms.
Unit inclusion criteria
Only units from channels and tetrodes located within the PAG were kept for the final analysis. Those include units from the dorso-medial PAG (DMPAG), the dorso-lateral PAG (DLPAG), the lateral PAG (LPAG) and the ventromedial PAG (VMPAG) and units that display firing rates higher than 1 Hz during the experimental phases of interest were kept for final analyses. Eventually, we included N = 85 units out of 93 units located in the PAG from 5 rats, 3 of those recorded with Neuropixels and 2 with tetrodes).
Optogenetic manipulation of behavior
Viral vectors
AAV vectors were obtained either from the University of North Carolina Vector Core (AAV8-CAG-ArchT-GFP) or from the Charité Viral Core Facility (Charité-Universitätsmedizin, Berlin) (AAV8-CAG-GFP). Viral titers were 2.5 x 10¹² particles/mL for AAV8-CAG-ArchT-GFP and 1.05 x 10¹² particles/mL for AAV8-CAG-GFP.
Viral injections
Three-week-old male Long-Evans rats were randomly divided into a GFP-control group or an ArchT group. Under ketamine (100 mg/kg) and xylazine (7.5 mg/kg) anesthesia, the bilateral viral injections (300 nl per hemisphere) were targeted to the lateral PAG using the following coordinates: AP, - 6.1 mm; LM, ± 0.65 mm; DV, - 4.3 mm. After the injections, rats were implanted bilaterally with optic fibers above the lateral PAG at a 20-degree angle (AP, - 6.1 mm; LM, ± 2.7 mm; DV, - 5.1 mm). Implants were secured to the skull with anchoring screws, UV-curable bonding agent (Optibond All-In-One), Charisma (UV-activated dental composite) and dental cement (Heraeus). The rats were allowed to recover for at least 4 weeks before starting the behavioral experiments in order to enable an optimal opsin expression.
Optical fiber implantation
Implantable optical fibers for in vivo optogenetic manipulation experiments were prepared from 200-μm core, 230 μm outer diameter multimode optical fiber with a numerical aperture (NA) of 0.39 (Thorlabs, Cat No: FT200EMT) and 230 μm inner diameter ceramic ferrules (Thorlabs, Cat No: CFLC230-10).33,34 For optical stimulation of ArchT, a 561-nm diode pumped solid state (DPSS) laser (MBL-FN-561-100mW, CNI Lasers, China) was used to produce the 561-nm yellow light. The final yellow light output was measured and adjusted to 10-15 mW at the tip of the optical fiber with a fiber optic power meter (Thorlabs, PM100D).
Recovery and habituation
Following the surgery, the rats were singly housed in cages. For tickling and rough-and-tumble play experiments, 3 weeks prior to the experiments, rats started to be habituated to the experimenter and testing arena, as well as paired with an unfamiliar rat for 15 min per day. The habituation and social play experiments were conducted in an 80 × 58 × 30 cm (L × W × H) arena. Tickling experiments were conducted in a 43 x 30 cm arena. One week before the optogenetic experiments, all rats were submitted to habituation to the head tethering with the optic patch cords while exploring the arena and partner.
Optogenetic inhibition during tickling and play
During testing, the rough-and-tumble play sessions lasted 380 seconds. Yellow light stimulation protocols were triggered by a 1401 digitizer and controlled by Spike2 software (Cambridge Electronic Designs, Cambridge, UK). Stimulation cycles, including periods of constant light stimulation (10 seconds) interleaved with periods of no stimulation (40 seconds), were applied 6 times per session. During this procedure, the LPAG was inhibited either unilaterally or bilaterally. During tickling experiments dorsal ticking, ventral tickling and chasing hand were performed for 5-7 seconds with a baseline period of 7 seconds between each behavior. The sequence was repeated 5 or 10 times for each experiment. The light was triggered during tickling in every second trail. Both video and USV recordings were performed as described muscimol blocking experiments. ELAN 6.1 software28 and DeepSqueak were used to analyze play behavior and USVs respectively.
Social play behavior of optogenetically manipulated rats were assessed by evaluating the duration of the following behavioral patterns: Pouncing and Being-Pounced, Pinning and Being-Pinned, and Boxing.15 Pouncing was defined as one animal aims to lunge to the dorsal side of its partner; Pinning was defined as one rat flips the other animal and stand over it15; Boxing was defined as both rats rear up and quickly push and paw each other. Both Pouncing and Being-Pounced were summarized as "Pounce", both Pinning and Being-Pinned were summarized as "Pin", the total social play behavior was evaluated by sum of Pounce, Pin and Box.
Histology
For the post-hoc validation of the viral targeting and the position of optic fibers (Figure 7), images were taken from the fluorescence microscope Leica DM5500 with 5X objective. Rats were excluded in the analysis if they did not show expression of the virus within the lateral PAG and if the optical fiber tips’ position was more than 500 μm away from the lateral PAG. Additionally, each one of the coronal slices were first attributed to the closest corresponding coronal slice in the rat brain atlas29 in order to model their antero-posterior position.
Quantification and statistical analysis
All quantification and statistical analysis were performed using MATLAB unless stated otherwise.
For each individual unit, the firing rate during a given behavior was calculated as the sum of the spikes occurring throughout the different instances of that behavior divided by the total duration of that behavior (i.e. the summed duration of the different instances). The rate during baseline and break was calculated similarly, and the baseline/break rate was calculated as the weighted average between baseline and break.
For each behavior, response indices (RI) were calculated relative to the baseline/break rate as followed:
rbehavior being the firing rate during the behavior (Hz) and rbaseline/break being the rate during baseline/break (Hz). RI equals 0 when both are the same, tends towards -1 when the cell is inhibited during the behavior and tends towards +1 when the cell is activated during the behavior. A RI of +0.33 indicates a 2 time increase, a RI of -0.6 indicates a 4 time decrease.
The spike peri-event histograms shown on figures were generated by aligning on event onsets and averaging the spike count in each bin and divided by the bin size in seconds to normalize the graph in Hz. Note that events do not always have similar lengths due to the nature of play and tickling events / behaviors. We only kept events / behaviors with a length longer than 1.5 seconds for these plots. In figures, the peri-event histograms time span (x-axis) was typically limited to 4 seconds for clarity even if some events lasted longer or shorter. The spike peri-call onset histograms on Figures 6 and S3 were generated with a bin width of 10 ms and then smoothed using a 50 ms uniform kernel, (50 ms moving average).
The response of single units to specific behaviors (dorsal gentle touch, dorsal tickling. Ventral tickling, chasing hand; Figures 2 and 3) was compared to the basal rate during baseline/break periods and statistically tested cell by cell. We tested how the firing rate during the actual set of behavioral windows compared to the distribution of rates computed from the same behavioral windows positioned into baseline/break periods. To do so the baseline/break periods were all concatenated in a single giant pseudo baseline/break phase and the X windows from the given behavior where randomly positioned in it, to calculate a baseline/break sub-rates. This was executed 1000 times in order to generate a distribution of rates, used to determine the rank of the actual rate during the given behavior. If that rank was higher than the 97.5th percentile then the firing rate was considered to be significantly higher than baseline/break; if the rank was lower than the 2.5th percentile of the distribution, then the firing rate was considered to be significantly inhibited by the given behavior.
To determine if the distribution of absolute response indices for dorsal gentle touch, dorsal tickling and ventral tickling were different a Friedman test was used followed by post hoc Wilcoxon tests with corrected p-values (Bonferroni correction: dividing the p-value required for significance by the number of tests, i.e. here 3) to determine the significance of the differences (Figure 2).
To test whether there was non-uniform repartition of clusters into the 4 columns of the PAG, we run a χ2.test. We then run a series of Fisher’s exact tests to assess the non-random distribution of a given cluster into a given column compared to the distribution of all other clusters and all other columns combined. Our statistical approach requires a high number of combinations (20), so we ranked the test results by ascending p-value and considered only the first one leading to an additive p-value lower than 0.05 to be significant (n = 6, see Table S1). This methodology did not necessarily show all non-random distribution patterns but revealed the most outstanding ones.
Wilcoxon signed rank tests were used to compared two groups of paired observations, and in case of multiple comparisons, p-values were corrected using a Bonferroni correction, i.e. dividing the p-value required for significance (∗0.05, ∗∗0.01, ∗∗∗0.001) by the number of tests run in that analysis.
Statistical analyses of social play experiments were performed using GraphPad Prism, Version 8. Group differences between control and ArchT were detected using two-way ANOVA followed by Bonferroni post-hoc tests for the social play paradigm and a paired t-test for analysis of USVs during tickling. P < 0.05 was considered statistically significant.
Acknowledgments
This work was supported by Humboldt-Universität zu Berlin, Bernstein Center for Computational Neuroscience Berlin, NeuroCure Cluster of Excellence (Exc 2049-390688087), Einstein Center for Neurosciences Berlin, Deutsche Forschungsgemeinschaft (SPP 1665, BR 3479/12-1, and SFB1315), and the European Research Council (BrainPlay ERC Synergy Grant). We thank Shimpei Ishiyama for providing us with the illustrations of the animal’s behavior. We thank Konstantin Hartmann, Andreea Neurkirchner, Undine Schneeweiß, Tanja Wölk, Maik Kunert, and Arnold Stern for outstanding technical support.
Author contributions
Conceptualization, J.S., N.G., E.M., D.S., and M.B.; methodology, J.S., N.G., W.T., M.C.-M., and A.D.; investigation, N.G., J.S., W.T., M.C.-M., and A.D.; formal analysis, J.S., N.G., and W.T.; visualization, J.S., N.G., and W.T.; writing, J.S., M.B., N.G., and W.T.; writing- review & editing, N.G., J.S., W.T., M.C.-M., E.M., A.D., D.S., and M.B.; supervision, M.B.; resources, M.B. and D.S.; funding acquisition, M.B. and D.S.
Declaration of interests
The authors declare no competing interests.
Inclusion and diversity
We support inclusive, diverse, and equitable conduct of research.
Published: July 28, 2023
Footnotes
Supplemental information can be found online at https://doi.org/10.1016/j.neuron.2023.06.018.
Supplemental information
Data and code availability
Figure data have been deposited at Mendeley Data: https://doi.org/10.17632/chnfyfd2k9.1 and are publicly available as of the date of publication.
All original code has been deposited at Mendeley Data: https://doi.org/10.17632/chnfyfd2k9.1 and is publicly available as of the date of publication.
Any additional information is available from the lead contact upon request.
References
- 1.Panksepp J., Normansell L., Cox J.F., Siviy S.M. Effects of neonatal decortication on the social play of juvenile rats. Physiol. Behav. 1994;56:429–443. doi: 10.1016/0031-9384(94)90285-2. [DOI] [PubMed] [Google Scholar]
- 2.Pellis S.M., Pellis V.C., Whishaw I.Q. The role of the cortex in play fighting by rats: developmental and evolutionary implications. Brain Behav. Evol. 1992;39:270–284. doi: 10.1159/000114124. [DOI] [PubMed] [Google Scholar]
- 3.Burgdorf J., Wood P.L., Kroes R.A., Moskal J.R., Panksepp J. Neurobiology of 50-kHz ultrasonic vocalizations in rats: electrode mapping, lesion, and pharmacology studies. Behav. Brain Res. 2007;182:274–283. doi: 10.1016/j.bbr.2007.03.010. [DOI] [PubMed] [Google Scholar]
- 4.Gordon N.S., Kollack-Walker S., Akil H., Panksepp J. Expression of c-fos gene activation during rough and tumble play in juvenile rats. Brain Res. Bull. 2002;57:651–659. doi: 10.1016/S0361-9230(01)00762-6. [DOI] [PubMed] [Google Scholar]
- 5.Wattendorf E., Westermann B., Fiedler K., Kaza E., Lotze M., Celio M.R. Exploration of the neural correlates of ticklish laughter by functional magnetic resonance imaging. Cereb. Cortex. 2013;23:1280–1289. doi: 10.1093/cercor/bhs094. [DOI] [PubMed] [Google Scholar]
- 6.Wattendorf E., Westermann B., Fiedler K., Ritz S., Redmann A., Pfannmöller J., Lotze M., Celio M.R. Laughter is in the air: involvement of key nodes of the emotional motor system in the anticipation of tickling. Soc. Cogn. Affect. Neurosci. 2019;14:837–847. doi: 10.1093/scan/nsz056. [DOI] [PMC free article] [PubMed] [Google Scholar]
- 7.Jürgens U. The role of the periaqueductal grey in vocal behaviour. Behav. Brain Res. 1994;62:107–117. doi: 10.1016/0166-4328(94)90017-5. [DOI] [PubMed] [Google Scholar]
- 8.Michael V., Goffinet J., Pearson J., Wang F., Tschida K., Mooney R. Circuit and synaptic organization of forebrain-to-midbrain pathways that promote and suppress vocalization. eLife. 2020;9 doi: 10.7554/eLife.63493. [DOI] [PMC free article] [PubMed] [Google Scholar]
- 9.Tschida K., Michael V., Takatoh J., Han B.X., Zhao S., Sakurai K., Mooney R., Wang F. A specialized neural circuit gates social vocalizations in the mouse. Neuron. 2019;103:459–472.e4. doi: 10.1016/j.neuron.2019.05.025. [DOI] [PMC free article] [PubMed] [Google Scholar]
- 10.Panksepp J. At the interface of the affective, behavioral, and cognitive neurosciences: decoding the emotional feelings of the brain. Brain Cogn. 2003;52:4–14. doi: 10.1016/S0278-2626(03)00003-4. [DOI] [PubMed] [Google Scholar]
- 11.Bandler R., Depaulis A. In: The Midbrain Periaqueductal Gray Matter. Depaulis A., Bandler R., editors. Springer; 1991. Midbrain periaqueductal gray control of defensive behavior in the cat and the rat; pp. 175–198. [DOI] [Google Scholar]
- 12.Evans D.A., Stempel A.V., Vale R., Ruehle S., Lefler Y., Branco T. A synaptic threshold mechanism for computing escape decisions. Nature. 2018;558:590–594. doi: 10.1038/s41586-018-0244-6. [DOI] [PMC free article] [PubMed] [Google Scholar]
- 13.Falkner A.L., Wei D., Song A., Watsek L.W., Chen I., Chen P., Feng J.E., Lin D. Hierarchical representations of aggression in a hypothalamic-midbrain circuit. Neuron. 2020;106:637–648.e6. doi: 10.1016/j.neuron.2020.02.014. [DOI] [PMC free article] [PubMed] [Google Scholar]
- 14.Lefler Y., Campagner D., Branco T. The role of the periaqueductal gray in escape behavior. Curr. Opin. Neurobiol. 2020;60:115–121. doi: 10.1016/j.conb.2019.11.014. [DOI] [PubMed] [Google Scholar]
- 15.Pellis S.M., Pellis V.C. Play-fighting differs from serious fighting in both target of attack and tactics of fighting in the laboratory rat Rattus norvegicus. Aggress. Behav. 1987;13:227–242. doi: 10.1002/1098-2337(1987)13:4<227::AID-AB2480130406>3.0.CO;2-C. [DOI] [Google Scholar]
- 16.Behbehani M.M. Functional characteristics of the midbrain periaqueductal gray. Prog. Neurobiol. 1995;46:575–605. doi: 10.1016/0301-0082(95)00009-k. [DOI] [PubMed] [Google Scholar]
- 17.Palagi E., Burghardt G.M., Smuts B., Cordoni G., Dall’Olio S., Fouts H.N., Řeháková-Petrů M., Siviy S.M., Pellis S.M. Rough-and-tumble play as a window on animal communication. Biol. Rev. Camb. Philos. Soc. 2016;91:311–327. doi: 10.1111/brv.12172. [DOI] [PubMed] [Google Scholar]
- 18.Ishiyama S., Brecht M. Neural correlates of ticklishness in the rat somatosensory cortex. Science. 2016;354:757–760. doi: 10.1126/science.aah5114. [DOI] [PubMed] [Google Scholar]
- 19.Ishiyama S., Kaufmann L.V., Brecht M. Behavioral and cortical correlates of self-suppression, anticipation, and ambivalence in rat tickling. Curr. Biol. 2019;29:3153–3164.e3. doi: 10.1016/j.cub.2019.07.085. [DOI] [PubMed] [Google Scholar]
- 20.Bandler R., Shipley M.T. Columnar organization in the midbrain periaqueductal gray: modules for emotional expression? Trends Neurosci. 1994;17:379–389. doi: 10.1016/0166-2236(94)90047-7. [DOI] [PubMed] [Google Scholar]
- 21.George D.T., Ameli R., Koob G.F. Periaqueductal gray sheds light on dark areas of psychopathology. Trends Neurosci. 2019;42:349–360. doi: 10.1016/j.tins.2019.03.004. [DOI] [PubMed] [Google Scholar]
- 22.Siviy S.M., Panksepp J. In search of the neurobiological substrates for social playfulness in mammalian brains. Neurosci. Biobehav. Rev. 2011;35:1821–1830. doi: 10.1016/j.neubiorev.2011.03.006. [DOI] [PubMed] [Google Scholar]
- 23.Huizinga J. Routledge & Kegan Paul; 1980. Homo Ludens: a Study of the Play-Element in Culture. [Google Scholar]
- 24.Panksepp J., Burgdorf J. “Laughing” rats and the evolutionary antecedents of human joy? Physiol. Behav. 2003;79:533–547. doi: 10.1016/S0031-9384(03)00159-8. [DOI] [PubMed] [Google Scholar]
- 25.Roccaro-Waldmeyer D.M., Babalian A., Müller A., Celio M.R. Reduction in 50-kHz call-numbers and suppression of tickling-associated positive affective behaviour after lesioning of the lateral hypothalamic parvafox nucleus in rats. Behav. Brain Res. 2016;298:167–180. doi: 10.1016/j.bbr.2015.11.004. [DOI] [PubMed] [Google Scholar]
- 26.VanRyzin J.W., Marquardt A.E., Argue K.J., Vecchiarelli H.A., Ashton S.E., Arambula S.E., Hill M.N., McCarthy M.M. Microglial phagocytosis of newborn cells is induced by endocannabinoids and sculpts sex differences in juvenile rat social play. Neuron. 2019;102:435–449.e6. doi: 10.1016/j.neuron.2019.02.006. [DOI] [PMC free article] [PubMed] [Google Scholar]
- 27.Reinhold A.S., Sanguinetti-Scheck J.I., Hartmann K., Brecht M. Behavioral and neural correlates of hide-and-seek in rats. Science. 2019;365:1180–1183. doi: 10.1126/science.aax4705. [DOI] [PubMed] [Google Scholar]
- 28.Max Planck Institute for Psycholinguistics, The Language Archive . 2021. ELAN (version 6.1) [computer software]https://archive.mpi.nl/tla/elan (Max Planck Institute for Psycholinguistics). [Google Scholar]
- 29.Paxinos G., Watson C. Academic Press/Elsevier; 2007. The Rat Brain in Stereotaxic Coordinates. [Google Scholar]
- 30.Jun J.J., Steinmetz N.A., Siegle J.H., Denman D.J., Bauza M., Barbarits B., Lee A.K., Anastassiou C.A., Andrei A., Aydın Ç., et al. Fully integrated silicon probes for high-density recording of neural activity. Nature. 2017;551:232–236. doi: 10.1038/nature24636. [DOI] [PMC free article] [PubMed] [Google Scholar]
- 31.Juavinett A.L., Bekheet G., Churchland A.K. Chronically implanted neuropixels probes enable high-yield recordings in freely moving mice. eLife. 2019;8 doi: 10.7554/eLife.47188. [DOI] [PMC free article] [PubMed] [Google Scholar]
- 32.Luo T.Z., Bondy A.G., Gupta D., Elliott V.A., Kopec C.D., Brody C.D. An approach for long-term, multi-probe Neuropixels recordings in unrestrained rats. eLife. 2020;9 doi: 10.7554/eLife.59716. [DOI] [PMC free article] [PubMed] [Google Scholar]
- 33.Sparta D.R., Stamatakis A.M., Phillips J.L., Hovelsø N., van Zessen R., Stuber G.D. Construction of implantable optical fibers for long-term optogenetic manipulation of neural circuits. Nat. Protoc. 2011;7:12–23. doi: 10.1038/nprot.2011.413. [DOI] [PMC free article] [PubMed] [Google Scholar]
- 34.Tang W., Kochubey O., Kintscher M., Schneggenburger R. A VTA to basal amygdala dopamine projection contributes to signal salient somatosensory events during fear learning. J. Neurosci. 2020;40:3969–3980. doi: 10.1523/JNEUROSCI.1796-19.2020. [DOI] [PMC free article] [PubMed] [Google Scholar]
Associated Data
This section collects any data citations, data availability statements, or supplementary materials included in this article.
Supplementary Materials
Data Availability Statement
Figure data have been deposited at Mendeley Data: https://doi.org/10.17632/chnfyfd2k9.1 and are publicly available as of the date of publication.
All original code has been deposited at Mendeley Data: https://doi.org/10.17632/chnfyfd2k9.1 and is publicly available as of the date of publication.
Any additional information is available from the lead contact upon request.