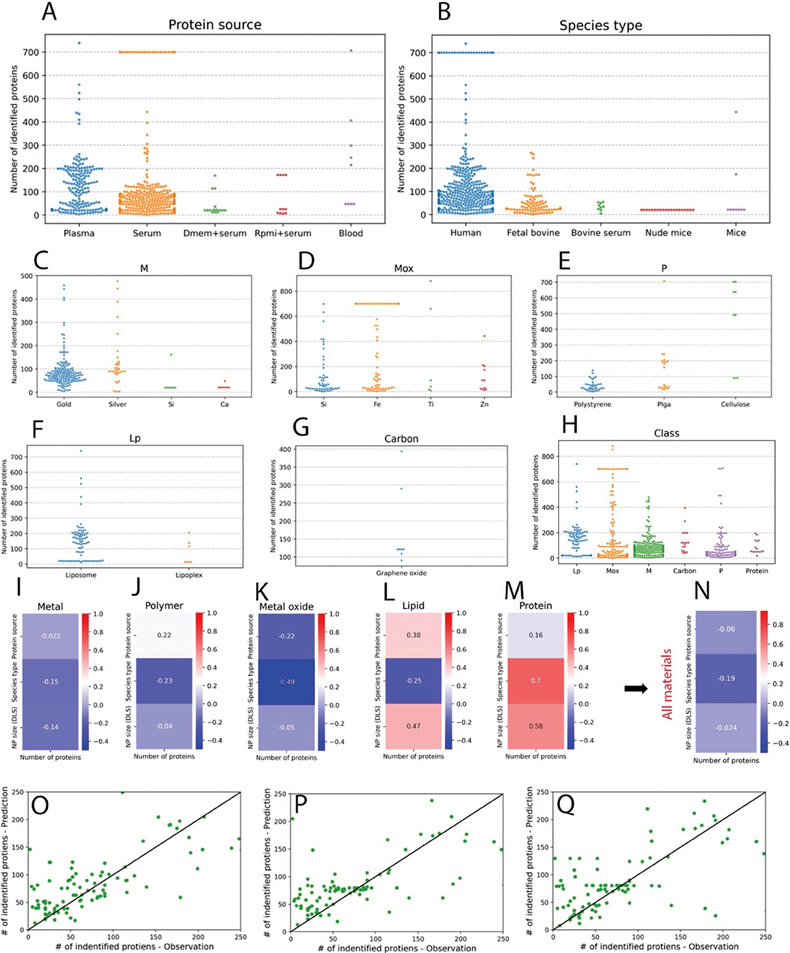
Figure 7.
Analysis of the correlation of number of identified proteins (NIP) with experimental parameter in protein corona studies. A,B) NIP using studied NPs depends on the source and type of medium. The majority of media used in NIP studies are either plasma or serum from human or bovine sources. C–G) the correlation of NIP in each sub class of studied materials, metal, metal oxide, polymer, lipid, and carbon. H: the correlation between NIP and classes of materials including all subclasses. I–M) the statistical correlation between NIP and protein source, type and particle size (DLS) for each class of material. N) the statistical correlation between NIP and protein source, type, and particle size (DLS) for all materials including subclasses. O–Q) The correlation of Inputs: NP Size (DLS), protein source, species type and Class and output of NIP using three models; Random Forest regressor 200 trees, XGBoost 200 trees and SVM RBF kernel, C = 1000.

