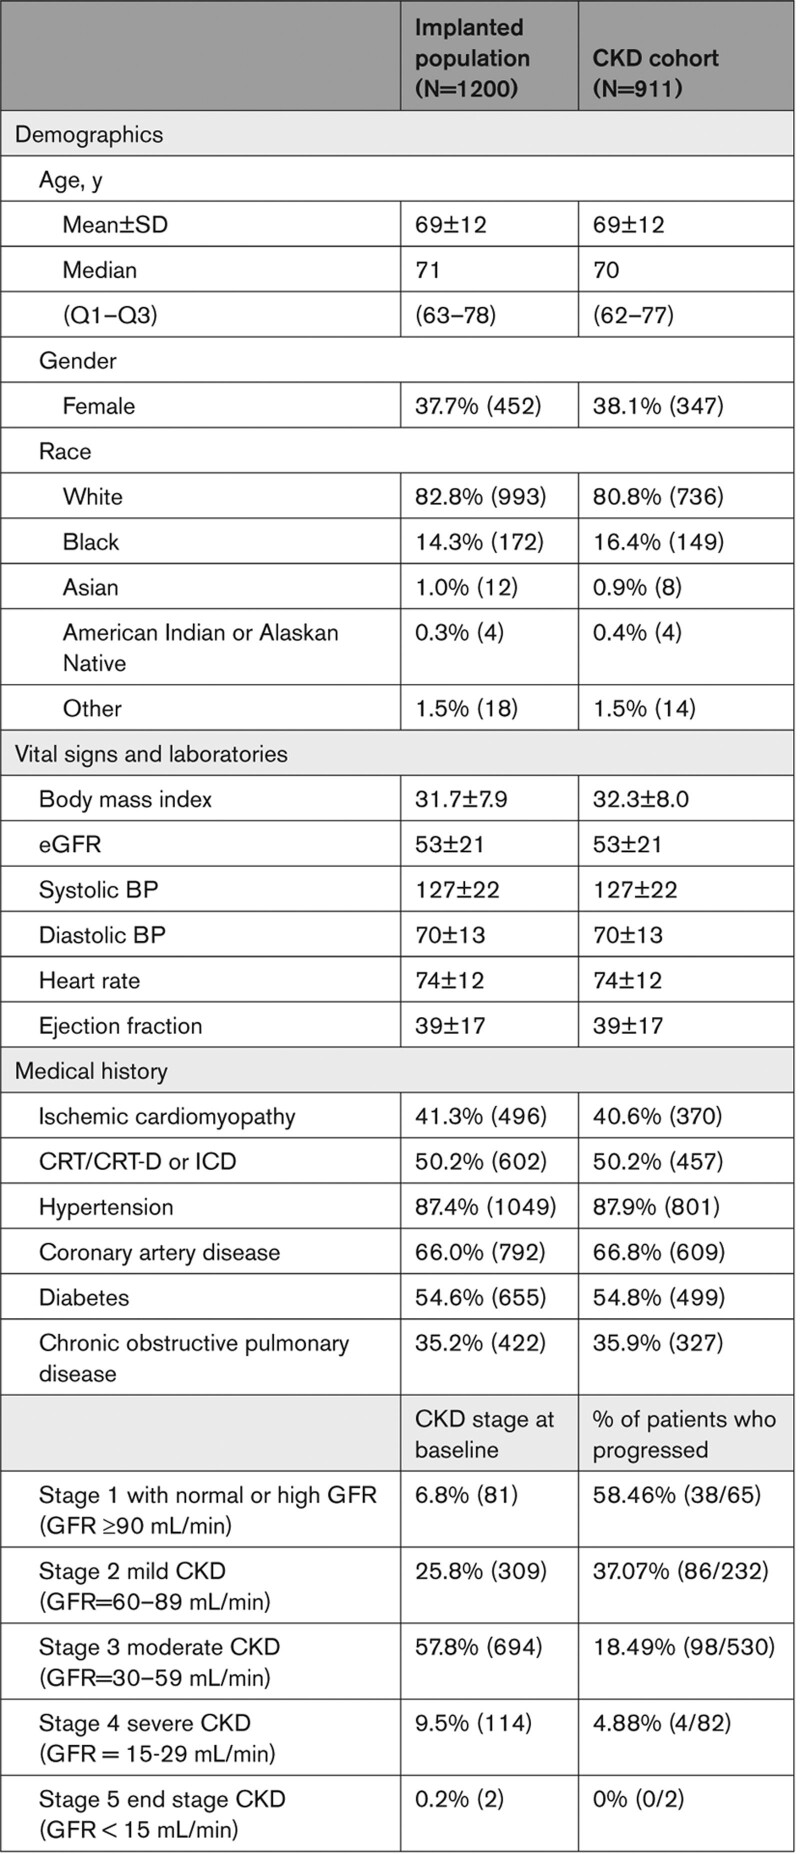
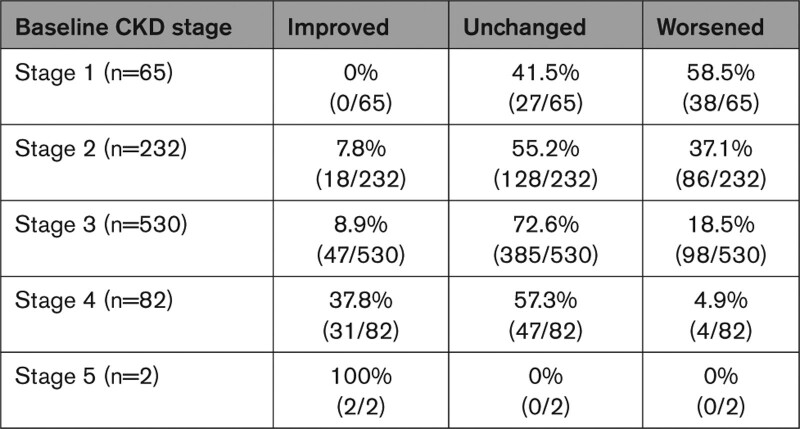
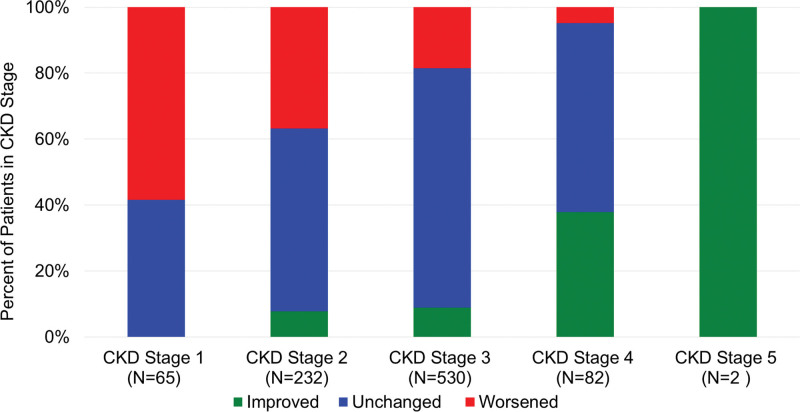
In the article by Raval et al, “Pulmonary Artery Pressure-Guided Heart Failure Management Reduces Hospitalizations in Patients With Chronic Kidney Disease,” which published online May 16, 2023 (Circulation: Heart Failure. 2023;16;e009721), the following corrections are needed.
In Table 1, the rows for “Stage 4 severe CKD (GFR = 15–29 mL/min)” and “Stage 5 end stage CKD (GFR <15 mL/min)” were missing. A corrected table is shown below and has been posted.
In Table 3, the values shown in row Stage 5 (n=2) under the column Improved and the column Unchanged were misplaced. A corrected table is shown below and has been posted.
The footnote indicators listed in the legend for Figure 1 were misplaced. The figure legend should read:
Figure 1. Composition of cohorts used to examine heart failure outcomes and renal progression hypotheses. The legend for Figure 2 was missing a title and footnote indicators. The legend should read:
Figure 2.Outcomes across eGFR quartiles. A, Heart failure hospitalization (HFH) rates 12 months before implantation compared with 12 months after implantation based on estimated glomerular filtration rate (eGFR) quartiles (n=1200). Change in pulmonary artery (PA) pressures over time using an area under the curve analysis, based on eGFR quartiles in the entire population of 1200 enrolled patients (B). C, Depicts Kaplan-Meier survival analysis of all patients stratified by eGFR quartile at baseline. Kaplan-Meier survival expressed as % (95% CI). EPPY indicates events per patient year. *Includes all Clinical Events Committee (CEC) adjudicated heart failure hospitalizations with an admission date on the date of implant and through 390 days prior to the date of implant. †Includes all CEC adjudicated heart failure hospitalizations with an admission date after the implant procedure discharge date through 390 days after the date of implant. ‡Hospitalization rate is an annualized rate estimated from the Andersen-Gill model. {95% CI on annualized hospitalization rate from the Andersen-Gill model. ||Hazard ratio, 95% CI, and P value estimated from the Andersen-Gill model with robust sandwich estimates.
In Figure 3, the second bar was incorrect, and there was a typo in the N value for Stage 5. Instead of (N=65), it should show (N=2). A corrected Figure has been posted.
The authors regret these errors.
The corrections have been made to the current version of the article, which is available at https://www.ahajournals.org/doi/10.1161/CIRCHEARTFAILURE.122.009721


