

Abstract
In this study, we estimate the first causal effects of in utero opioid exposure on infant health at birth and child protective services reports. We employ maternal fixed-effects models using linked administrative data capturing 259,723 infants born to 176,224 mothers enrolled in Medicaid between 2010 and 2019. Our preferred specifications suggest that neonatal abstinence syndrome and NICU admission bear strong associations with prenatal opioid exposure, concentrated on illicit and medication assisted treatment (MAT) exposure in the first and third trimesters. We find that prenatal opioid exposure is associated with increased CPS reports, low birth weight, preterm birth, and small for gestational age, though these measures are less sensitive with respect to the timing of exposure. While we detect relatively smaller effects of non-MAT prescription opioid exposure on NAS, NICU admission, low birthweight, these effects are not trivial, suggesting that medical professionals should consider balancing the potential for adverse side effects of infants with the benefits of pain management for pregnant women.
Keywords: Prenatal opioid exposure, medication-assisted treatment, opioids, fetal development, infant health, child protective services, in utero
Introduction
The United States has witnessed an increase in opioid use among pregnant women, as evidenced by an 83 percent increase in neonatal abstinence syndrome (NAS) between 2010 and 2017 (Hirai et al. 2021). Neonatal abstinence syndrome (NAS) is a withdrawal condition in a newborn often associated with substance use (typically opioid use) during pregnancy. In 2019, estimates suggest that 7 percent of women were prescribed opioids during pregnancy, of which 21 percent indicated misuse during pregnancy (Ko et al. 2020). Moreover, diagnoses of opioid use disorder (OUD) at delivery increased by 131 percent between 2010 and 2017. A large and growing body of economic literature has identified the disparate health effects of opioid use on adults, while largely omitting the causal effects of opioid exposure on infants and children. Given evidence from the medical literature on far-reaching effects of fetal exposure (Corsi et al. 2020; Jantzie et al. 2020), the potential for long-term harm in terms of adult health and human capital looms large (Nygaard et al. 2015; Odegaard, Pendyala, and Yelamanchili 2021). A key question is whether links between prenatal opioid exposure and adverse outcomes are causal in nature or rather representative of confounding factors. In this paper, we study the impact of in utero opioid exposure on infant health and wellbeing at birth.
Specifically, we estimate the plausibly causal effect of opioid exposure during critical periods of pregnancy on infant health at birth, including neonatal abstinence syndrome (NAS) diagnosis, birthweight, and gestational age, APGAR score, neonatal intensive care unit (NICU) admission after birth and reports to child protective services (CPS). We harness linked administrative data capturing birth records and Medicaid claims for the population of Medicaid-covered births in Wisconsin between 2010 and 2019. We leverage within-mother/across-sibling variation in the timing and intensity of narrowly defined exposures to prescribed opioids, including both medication-assisted treatment (MAT), used in treatment of OUD, and non-MAT opioid analgesics, as well as an innovative measure used to approximate illicit opioid use.
The opioid epidemic generates massive societal costs, reaching an estimated $1 trillion in 2017 (Maclean et al. 2021) that are likely underestimated (Bifulco and Shybalkina 2022). Estimates suggest that external, supply-side factors gave rise to the initial surges in widespread opioid use. However, mounting evidence suggests that physician prescribing behavior fueled the epidemic (Alpert et al. 2019; Arteaga and Barone 2021; Currie and Schwandt 2021). MAT and non-MAT opioids are FDA-approved for use during pregnancy due to a lack of concrete evidence of serious consequences resulting from prolonged or periodic use.2 Yet, existing medical research has documented correlations between fetal opioid exposure and diminished health at birth in the context of animal and human studies. A central challenge is that opioid use is not random. Women who use opioids during pregnancy might be more likely than those without opioid use to live in highly polluted areas, to delay prenatal care, or to experience higher rates of stress (Conradt, Crowell, and Lester 2018). As these factors similarly affect health at birth (Aizer, Stroud, and Buka 2015; Nilsson 2017) and are likely correlated with opioid use, failure to account for these and other unobserved factors will plausibly overstate the estimated effects of opioids in utero.
This study is motivated by the paucity of causal evidence that more fully accounts for unobserved differences across mothers and infants. Prior economic work identifies the probability of any exposure to opioids during the entire pregnancy period, making comparisons across women in either counties or states with varying levels of predicted exposure. To the extent that individual-level controls fully capture confounder factors vis-à-vis variation in opioid use and birth outcomes, the resulting estimates can be suggestive of causal effects. However, our estimates suggest that this is a strong assertion, with mother fixed-effect estimates attenuating cross-mother comparisons by 55 to 80 percent, suggesting that unobserved heterogeneity in maternal characteristics, health, or human capital endowments is spatially correlated with birth outcomes. In our study, we improve on the existing literature by adopting narrowly defined measures of opioid exposure by type (MAT, non-MAT, and illicit) during critical periods in pregnancy. By making comparisons in opioid exposure effects across siblings in maternal fixed-effects estimations, our estimates are less prone to bias due to unobserved heterogeneity between mothers.
Background
Opioid use has long been associated with economic disadvantage (Case and Deaton 2017). However, findings from a growing body of literature suggest that ‘demand-side’ economic disadvantage (e.g., unemployment or macroeconomic conditions) is not the key driver of the opioid epidemic. As macroeconomic forces or individual job loss fluctuate over time, patterns of opioid use and dependency demonstrate a weak overall association (Ruhm 2019). Moreover, efforts to alleviate financial and material hardships appear weakly associated with opioid use. For this reason, an economic literature has been devoted to identifying the ‘root causes’ of the epidemic.
Strikingly, mounting evidence suggests that ‘supply-side’ factors began and continue to fuel opioid use concentrated in economically disadvantaged areas (Alpert, Powell, and Pacula 2018; Buckles, Evans, and Lieber 2020; Powell 2021). With the evidence suggesting the importance of addressing physician prescribing behavior through increased advanced education and training (Schnell and Currie 2018) and behavioral interventions to deter prescribing behavior (Doctor et al. 2018), physicians have become a central focus for patient-centered interventions to both curb and prevent opioid dependence.
Opioid exposure can affect health at birth through many channels. A large body of medical literature has consistently demonstrated first-order effects of in utero opioid exposure on the incidence of neonatal abstinence syndrome (NAS) diagnosis, characterized by withdrawal symptoms from late trimester opioid use (Desai et al. 2015). NAS can result from use of medication-assisted treatment (MAT) opioids, prescription opioids (non-MAT), and illicit opioids, and some non-opioids such as antidepressants or benzodiazepines. The standard approach to treating opioid use disorder in pregnancy, as recommended by the American College of Obstetricians and Gynecologists, is treatment with MAT using methadone or buprenorphine, rather than medically-supervised withdrawal (American College of Obstetricians and Gynecologists, 2017). While MAT can also result in NAS, studies have found that MAT may lead to less severe outcomes relative to cycling on and off opioids, and that buprenorphine- as opposed to methadone-treated mothers may have infants with less severe NAS (e.g., shorter NICU stays, lower likelihood of medication to treat NAS) (Nørgaard, Nielsson, and Heide-Jørgensen 2015). Opioid exposed infants, both with and without a NAS diagnosis (or a neonatal opioid withdrawal syndrome [NOWS] diagnosis) have demonstrated higher rates of preterm birth and lower birth weight, and are generally small for gestational age (Brogly et al. 2021; Reddy et al. 2017). Moreover, studies using neuroimaging methods have identified both structural and functional changes in the brains of opioid exposed infants, representing a pathway through which fetal opioid exposure might affect later cognitive functioning and mental distress (Schlagal et al. 2021).
A major limitation to many medical studies is the omission of unobservable characteristics, such that estimates generated by comparing individuals across opioid use status likely reflect differences in other factors that are correlated with poor birth outcomes. One particularly strong study harnesses a propensity score matching method to create a control group of unexposed mothers in Canada (Corsi et al. 2020). The authors estimated that self-reported opioid exposure is associated with a 63 percent greater risk of preterm birth and a 191 percent greater likelihood of NICU admission. Despite the known limitations of matching methods, most notably that they are subject to omitted variable bias, that the authors matched on other forms of self-reported substance abuse is notable. An additional study also based on self-reported opioid use but estimated using an unmatched sample, found opioid use in utero to be associated with a 50 percent increase in preterm birth and a 87 percent increase in small-for-gestational age (SGA) birth, an outcome that was insignificant in the former study (Azuine et al. 2019).
Medical literature sheds light on the many potential neurobiological effects on infant health at birth resulting from opioid exposure. However, many of these outcomes closely resemble those associated with other substances and exposures, inhibiting estimates of long-term effects on adult health and human capital (wages, earnings, skills, productivity). The fetal origins of adult diseases hypothesis asserts that adulthood disease originates in fetal exposures to maternal disease and nutrition (Barker 1995), supported by an evidence base devoted to disentangling the many fetal exposures affecting health at birth (Almond, Currie, and Duque 2018). Several recent economic studies build on this literature to link an exogenous (external) shock in opioid exposure to the birth outcomes we examine here. One study harnessed the reduction in opioid use due to the adoption of PDMPs to estimate second order effects on infant health at birth (Gihleb, Giuntella, and Zhang 2020). Though the authors detect a 10 percent reduction in NAS incidence following PDMP implementation, they fail to detect changes in health at birth or infant mortality. Conversely, a more recent study estimates that a 10–40 percent reduction in prescription opioid sales due to PDMPs and “pill mill” legislation increased infant birthweight by 35 grams and reduced low birth weight incidence by 0.5 percentage points (Ziedan and Kaestner 2020). Another recent working paper finds that counties at the 75th percentile in county-level opioid prescriptions exhibit, on average, 0.7 percent lower average birth weights and 0.9 percent poorer APGAR scores than those at the to the 25th percentile of opioid prescriptions (Arteaga and Barone 2021). None of these studies observe actual maternal opioid use, however, representing an important gap the current study aims to fill.
In addition to effects on newborn health, maternal opioid use during pregnancy (and in the postpartum period) is associated with CPS involvement. In 2019, a survey of state child welfare agencies revealed that 44 states include prenatal exposure to drugs or alcohol in their statutory definition of abuse or neglect, 23 of which include fetal drug exposure alone.3 In Wisconsin (the focus of our study), as in many states, a positive drug screen is enough to prompt a report to CPS on the grounds that any exposure is harmful to the developing fetus. Wisconsin requires reporting of prenatal substance use, equates prenatal substance use with child abuse, and considers prenatal substance use as grounds for civil commitment of the mother during pregnancy.4 Several economic studies point to a complex relationship between opioid use policies and CPS involvement. In addition to detecting a strong correlation between opioid deaths and CPS reports over time (Chapman 2022), one study found that PDMPs reduced CPS reports (Bruzelius et al. 2021). One particularly well-designed study found that the opening of opioid treatment programs (OTP) is associated with a 22 percent decline in foster care placements, suggesting that treatment might yield protective effects on families and children (Bullinger, Wang, and Feder 2022). A related literature demonstrates that punitive substance abuse policies increase CPS involvement and foster care entry while failing to reduce infant rates of NAS (Atkins and Durrance 2020).
Our contribution is threefold. First, using precisely defined measures of maternal opioid exposure, our approach identifies the effects that accrue due to both the timing and intensity of maternal opioid use. Second, we estimate the independent and combined effects of MAT, non-MAT, and approximated illicit opioid exposure. Third, we use a rigorous maternal fixed-effects approach to compare siblings with and without indication of prenatal exposure while adjusting for stable observed and unobserved family characteristics that may be associated with selection into opioid use and child outcomes. Finally, we use administrative data of the census of Medicaid births in the State of Wisconsin, rather than self-reported substance use data for a more select sample.
Data
Our data comes from a unique linked administrative data, Big Data for Little Kids (BD4LK), that longitudinally captures detailed health, child protective services (CPS) involvement, employment, earnings, and benefit enrollment records for 259,723 Medicaid-covered births between 2010 and 2019. Administrative records come from the Wisconsin Administrative Data Core (WADC) consisting of an integrated data system on nearly 8 million unique individuals (for detailed description of the WADC, see Brown; et al. 2020). BD4LK is constructed by linking WADC for all observed individuals associated with live birth records. The data used for our analyses include birth certificate, CPS reports, and Medicaid/S-CHIP records for the focal child, their family, and in some cases, for previous generations. We identify all Medicaid deliveries among WADC mothers using the common set of Current Procedural Technology (CPT) procedure codes 59400–59620. Neonatal abstinence syndrome (NAS) is captured following the conventional ICD-9 and ICD-10 codes (779.5x and P96.1, respectively). We also test an alternative measure of ‘suspected’ NAS that includes the set of related conditions that are suggestive of NAS, including maternal use of drugs during pregnancy, P0449 in ICD-10 and 665.5 in ICD-9. We exclude those with low birthweight diagnosis in ICD-9 as well as these might be indicative of iatrogenic cases (765.00–765.05, 770.7, 772.10–772.14, 777.50–777.53, 777.6, and 779.7).5
We identify prescription non-MAT opioids using the National Drug Codes (NDC) in prescription claims as inclusive of any of the following drug classes of opioids (including drugs with generic names): Codeine, Dihydrocodeine, Fentanyl, Hydrocodone, Hydromorphone, Oxycodone, Meperidine, Morphine, Nalbuphine, Opium, Oxymorphone, Propoxyphene, Tapentadol, Tramadol, Pentazocine, and Butorphanol. We classify Methadone and Buprenorphine-containing opioids as medication assisted treatment (MAT). We note that Methadone claims are not filled through retail pharmacies, but through Opioid Treatment Programs (OTPs) or other Narcotic Treatment Centers (~ 90 percent in our sample), while Buprenorphine is commonly administered through retail pharmacies through a physician’s office-based prescription (~94 percent in our sample). Fortunately, we can observe both regardless of provider type, as long as Medicaid is billed by the provider.
Using information about the prescription filled date and number of days’ supply of each prescription observed in the Medicaid prescription claims, we constructed a daily exposure calendar indicating whether the mother held a prescription for either MAT or non-MAT opioids on each day in pregnancy. We then aggregate these data to capture the number of exposed days in each trimester or in the entire pregnancy period for non-MAT and MAT opioids separately. We also compute exposure based on the proportion of days covered by trimester or in the entire pregnancy, adjusting for differences in third trimester length based on birth timing. We transform the coefficient to interpret a10-percentage point increase in the fraction of pregnancy exposed, as this is equivalent to around 30 days relative to the mean in the full sample. We test this measure against a single indicator for exposure in each critical period and across the entire pregnancy to compare our results to prior literature.
Among the mothers with opioid use disorder (OUD) diagnosis identified using ICD codes, n=2,590 children did not have more than seven days with MAT or non-MAT prescription claims in the period prior to treatment. We use this sample to approximate illicit exposure which we define here as both illicit opioid use and illegally-obtained prescription opioid use as we are unable to differentiate the two Specifically, we assume that in the period prior to an OUD diagnosis and MAT use or between MAT prescriptions, the absence of prescription opioids is suggestive of illicit substance abuse. This period might be followed by non-MAT use, in which case the period is considered non-MAT exposed.
We similarly use data from birth records to construct indicators for preterm birth (< 37 weeks), low birthweight (<2,500g), small for gestational age (<10th percentile in weight-for-age), low five-minute APGAR score (<7), and NICU stay. A NAS diagnosis within 30 days (narrow NAS), and suspected NAS diagnosis within 30 days (broad NAS), are identified using infant Medicaid claims. Finally, we harness administrative child protective services (CPS) records from the Wisconsin Department of Children and Families (DFC) to capture maltreatment allegations for any reason generated within 7 days of the child’s date of birth given that such reports are highly likely to reflect suspected maternal substance use.
As shown in Table A1 in the appendix, Wisconsin residents are generally comparable to those in the balance of the United States, though there are some notable differences. Wisconsin is generally less diverse, having more White non-Hispanic (NH) residents on average than the US as a whole and fewer foreign born residents. Wisconsin residents are less likely to be without health insurance and exhibit slightly lower poverty rates. Yet, the opioid epidemic has been especially detrimental for Wisconsin residents. Though opioid-related deaths in Wisconsin generally follow the same trends as those in the US (Monnat 2022), as shown in Figure A1 in the appendix, deaths in Wisconsin rose more rapidly between 2010 and 2018 versus the US. During this same period, between 2009 and 2014, prenatal opioid exposure in Wisconsin increased threefold (Vivolo-Kantor et al. 2018). Access to treatment programs has not kept pace, with only four OTPs added between 2016 and 2020 according to reports from the Wisconsin Department of Health Services, shouldering a 132 percent increase in caseload.6 Like much of the US, access to treatment centers in rural counties is especially disparate.
Empirical Approach
An established medical literature has identified the neurobiological and physiological pathways through which in utero opioid exposure might impact fetal development and subsequent health at birth. To build on this literature, the primary aim of the present analysis is to establish whether these relationships are causal in nature and to assess the direction and magnitude of the plausibly causal effects. To assess the effects of in utero exposure to opioids, a simple linear probability model (LPM) comparison across opioid exposure status would take the following form:
| (1) |
where infant health or wellbeing outcomes are regressed on in utero opioid exposure, with i indexing the child and m the mother at time . We measure exposure as either the number of days of exposure to each category of opioid exposure type within each critical period, , the fraction of the period exposed, or using exposure indicators. We define exposure types as MAT, non-MAT, or illicit, and critical periods include either the entirety of pregnancy or each of three trimesters. Each model includes therefore nine bins (3×3) in the models with trimester-level exposure and three bins in the pregnancy-level models. We include a vector of individual controls () that captures maternal and child characteristics, including race/ethnicity (White NH, Black NH, Hispanic, and Other NH), maternal age at the start of pregnancy (< 22, 22–30, 31+), education (less than HS, HS or higher), marital status at delivery (married or single), birth order (1, 2, 3, 4 or higher), infant sex (male, female), plurality, birth quarter, and county urbanicity (urban/rural). In models in which we measure daily opioid exposure, we further include a measure of gestational age using the obstetric estimate. We include year-of-birth fixed effects to account for variation in outcomes specific to a year, including unobserved factors that vary by year but that might be correlated with both opioid use and birth outcomes (Arteaga and Barone 2021; Ruhm 2019). We cluster standard errors at the level of the mother to account for correlation of errors within families.
One limitation of this approach is that the error term could be correlated with other unobserved factors, yielding biased estimates of opioid exposure. To attenuate the bias stemming from these concerns, our preferred specification fits equation (1) with maternal fixed effects without time-invariant covariates. This approach enables us to account for any unobserved variation across mothers in health and behaviors before and during pregnancy by making within-mother/across-sibling comparisons. While this method is commonly adopted in the fetal origins hypothesis literature (see e.g. Aizer et al. 2015; Rosales-Rueda 2014) and in health economics, more generally, it has not been used to estimate the effects of opioid exposure during pregnancy on health and wellbeing outcomes at birth, to the best of our knowledge. It is not, however, without limitations. First, maternal fixed-effects estimates are limited to families with more than one child. Further, our maternal fixed-effects sample is limited to mothers who were covered by Medicaid for multiple births, suggesting that our sample of mothers might be more disadvantaged than those who are enrolled for a single birth who are retained in only LPM estimates.7 If our sample is negatively selected, our estimates would be biased downwards as mothers with only one Medicaid birth might have lost eligibility (e.g., due to increased earnings) between births. Sibling spillover effects might similarly threaten the internal validity of our estimates if one sibling reported to CPS mechanically ‘flags’ the following sibling for later surveillance. Spillover effects are less concerning regarding CPS outcomes than high-risk pregnancies, though to account for both possibilities we include birth order controls and other observed measures of pregnancy risk. A related concern is if subsequent fertility is endogenous, meaning that adverse outcomes in one pregnancy might systematically affect later fertility and by extension, sample selection (e.g., Persson & Rossin-Slater, 2018). We are unable to account for this possibility, however, are less concerned given the advantages gained from our narrowly defined exposure variable and careful accounting for cross-mother differences.
A central criticism of fixed-effects models is the exacerbation of random measurement error. Put differently, unobserved differences between pregnancies (siblings) might be systematic, meaning that maternal opioid use could be related to child characteristics (e.g., a ‘small for gestational age’ diagnosis, a terminal or chronic health condition) or external factors such as maternal mental health or relationship stability. To the extent that these factors are correlated with our covariates, any remaining variation is of much less concern.
Results
Descriptive statistics are shown in Table 1. In our full sample of mothers (n=259,723), roughly 1.6 and 3.4 percent of infants received a narrow or broad NAS diagnosis, about half the rate observed in our sibling-only sample (n=45,452), 4.7 and 8.0 percent, respectively. Critically, our sibling sample appears to be relatively negatively selected along this and nearly all other parameters as indicated by the statistically significant t-tests shown in the ‘sibling’ column, including higher rates of CPS involvement, diminished health at birth, and higher rates of NICU admission. Other notable differences include lower rates of firstborn births in the sibling sample and a larger fraction of plural births, and those in the sibling sample are younger, less likely to have graduated from high school, and to report being married, as well as higher rates of maternal smoking during pregnancy.
Table 1:
Descriptive statistics
| Full sample | Sibling sample | |||
|---|---|---|---|---|
|
|
||||
| N | % | N | % | |
|
| ||||
| Outcomes | ||||
| NAS diagnosis (narrow) | 4,284 | 1.60% | 2,137 | 4.7%*** |
| Suspected NAS (broad) | 8,792 | 3.40% | 3,637 | 8.0%*** |
| Low birthweight | 22,872 | 8.80% | 5,139 | 11.3%*** |
| Preterm | 27,157 | 10.50% | 5,996 | 13.2%*** |
| Small for gestational age | 31,055 | 12.00% | 6,194 | 13.6%*** |
| Five-minute APGAR score <7 | 6,415 | 2.50% | 1,139 | 2.50% |
| CPS investigation in 7 days | 3,721 | 1.40% | 1,383 | 3.0%*** |
| NICU admission | 22,724 | 9.80% | 5,025 | 12.5%*** |
| Prenatal and Birth Characteristics | ||||
| Received prenatal care T1 | 176,489 | 70.70% | 30,547 | 70.2%** |
| Infant died within 12 months | 1,790 | 0.70% | 495 | 1.1%*** |
| Male | 132,967 | 51.20% | 23,229 | 51.10% |
| Birth order | ||||
| First | 82,949 | 32.0% | 7,805 | 17.2%*** |
| Second | 75,730 | 29.2% | 12,496 | 27.5%*** |
| Third | 50,596 | 19.5% | 10,893 | 24.0%*** |
| Fourth or higher | 50,024 | 19.3% | 14,211 | 31.3%*** |
| Plural birth | 7,431 | 2.90% | 1,882 | 4.1%*** |
| Quarter of birth | ||||
| Q1 (Jan – Mar) | 64,521 | 24.80% | 11,451 | 25.20% |
| Q2 (Apr – Jun) | 64,491 | 24.80% | 11,208 | 24.70% |
| Q3 (Jul – Sep) | 67,845 | 26.10% | 11,765 | 25.90% |
| Q4 (Oct – Dec) | 62,866 | 24.20% | 11,028 | 24.30% |
| Mother Demographic Characteristics | ||||
| Mother’s residence at birth | ||||
| Rural | 64,994 | 25.0% | 11,482 | 25.3% |
| Maternal age | ||||
| < 22 | 56,542 | 21.80% | 9,093 | 20.0%*** |
| 22-30 | 143,989 | 55.40% | 27,770 | 61.1%*** |
| 31+ | 59,192 | 22.80% | 8,589 | 18.9%*** |
| Mother’s race/ethnicity | ||||
| Non-Hispanic White | 139,882 | 54.40% | 24,898 | 55.2%*** |
| Non-Hispanic Black | 51,389 | 20.00% | 10,973 | 24.3%*** |
| Hispanic | 39,516 | 15.40% | 5,158 | 11.5%*** |
| Other | 25,688 | 10.00% | 3,957 | 8.8%*** |
| Graduated HS | 208,530 | 80.30% | 34,713 | 76.4%*** |
| Married | 83,176 | 32.00% | 11,957 | 26.3%*** |
| Maternal morbidities | ||||
| Chronic diabetes | 3,113 | 1.2% | 614 | 1.4%*** |
| Chronic hypertension | 6,243 | 2.4% | 1,366 | 3.0%*** |
| GDM | 16,835 | 6.5% | 2,659 | 5.9%*** |
| Gestational hypertension | 14,757 | 5.7% | 2,348 | 5.2%*** |
| Mother smoking | 83,722 | 35.1% | 18,578 | 44.2%*** |
|
| ||||
| N | 259,723 | 45,452 | ||
Note: Data are from the 2010 –2019 birth cohorts in Wisconsin’s BD4LK linked administrative data. The full sample includes all Medicaid-enrolled live births in Wisconsin matched to birth records and Medicaid claims for mothers and infants. The sibling sample includes only continuously enrolled mothers with more than one child born in the same period. NAS = neonatal abstinence syndrome, CPS = child protective services, NICU = neonatal intensive care unit, T = trimester, HS = high school, and GDM = Gestational diabetes mellitus.
Table 2 summarizes the rates of opioid exposure during pregnancy using the three exposure measures for MAT, non-MAT, and illicit opioids in both the full and sibling samples overall (panel A) and among those with any exposure (panel B). Overall, we observe 6.256 days of exposure to any opioid in the full sample versus 21.054 in the sibling sample. Note that the full and sibling sample exhibit statistically different levels of exposure across all opioid exposure types and time periods, bolstering the assertion that mothers in the sibling sample are negatively selected. Among those with any type of opioid exposure during pregnancy (panel B), non-MAT prescriptions occur at the highest rate, followed by MAT and illicit opioids. The fractional and binary measures follow the same patterns, though we prefer the fractional measure as it is less prone to measurement error as it accounts for left censoring in the first trimester due to erroneous dating and truncation in the third due to variable pregnancy lengths.
Table 2:
Average opioid exposure rates among full sample (panel A) and exposed sample (panel B)
| Days exposed | Fraction exposed | Exposure indicator | ||||
|---|---|---|---|---|---|---|
|
|
||||||
| Full | Sibling | Full | Sibling | Full | Sibling | |
|
| ||||||
| Panel A: Full sample | ||||||
|
| ||||||
| MAT exposure | ||||||
| Pregnancy | 2.420 | 8.395*** | 0.009 | 0.032*** | 0.015 | 0.052*** |
| T1 | 0.638 | 2.277*** | 0.007 | 0.025*** | 0.010 | 0.036*** |
| T2 | 0.849 | 2.952*** | 0.009 | 0.033*** | 0.012 | 0.042*** |
| T3 | 0.933 | 3.165*** | 0.011 | 0.038*** | 0.014 | 0.046*** |
| Non-MAT exposure | ||||||
| Pregnancy | 2.819 | 9.388*** | 0.011 | 0.035*** | 0.151 | 0.518*** |
| T1 | 0.977 | 3.314*** | 0.011 | 0.036*** | 0.064 | 0.226*** |
| T2 | 0.909 | 3.037*** | 0.010 | 0.033*** | 0.069 | 0.236*** |
| T3 | 0.933 | 3.037*** | 0.011 | 0.037*** | 0.074 | 0.245*** |
| Illicit exposure | ||||||
| Pregnancy | 1.116 | 3.597*** | 0.004 | 0.014*** | 0.010 | 0.033*** |
| T1 | 0.605 | 1.951*** | 0.007 | 0.021*** | 0.009 | 0.029*** |
| T2 | 0.36 | 1.163*** | 0.004 | 0.013*** | 0.007 | 0.021*** |
| T3 | 0.152 | 0.484*** | 0.002 | 0.006*** | 0.004 | 0.012*** |
| Any exposure | ||||||
| Pregnancy | 6.256 | 21.054*** | 0.024 | 0.080*** | 0.162 | 0.556*** |
| T1 | 2.185 | 7.427*** | 0.024 | 0.082*** | 0.076 | 0.269*** |
| T2 | 2.084 | 7.039*** | 0.023 | 0.078*** | 0.082 | 0.279*** |
| T3 | 1.988 | 6.588*** | 0.024 | 0.080*** | 0.086 | 0.287*** |
|
| ||||||
| N | 259,723 | 45,452 | 259,723 | 45,452 | 259,723 | 45,452 |
|
| ||||||
| Panel B: Exposed sample | ||||||
|
| ||||||
| MAT exposure | ||||||
| Pregnancy | 14.893 | 15.092 | 0.056 | 0.057 | 0.095 | 0.094 |
| T1 | 3.927 | 4.093 | 0.043 | 0.045 | 0.064 | 0.065 |
| T2 | 5.225 | 5.308 | 0.058 | 0.058 | 0.075 | 0.075 |
| T3 | 5.741 | 5.691 | 0.069 | 0.069 | 0.083 | 0.083 |
| Non-MAT exposure | ||||||
| Pregnancy | 17.348 | 16.879 | 0.065 | 0.064 | 0.930 | 0.931 |
| T1 | 6.011 | 5.959 | 0.066 | 0.065 | 0.391 | 0.406*** |
| T2 | 5.595 | 5.461 | 0.062 | 0.060 | 0.426 | 0.424 |
| T3 | 5.741 | 5.459** | 0.069 | 0.066** | 0.452 | 0.441*** |
| Illicit exposure | ||||||
| Pregnancy | 6.869 | 6.467 | 0.026 | 0.025 | 0.062 | 0.059 |
| T1 | 3.72 | 3.507 | 0.041 | 0.039 | 0.055 | 0.052 |
| T2 | 2.215 | 2.09 | 0.024 | 0.023 | 0.04 | 0.038 |
| T3 | 0.934 | 0.87 | 0.011 | 0.01 | 0.024 | 0.022 |
| Any exposure | ||||||
| Pregnancy | 38.502 | 37.85 | 0.145 | 0.143 | 1 | 1.000*** |
| T1 | 13.448 | 13.353 | 0.148 | 0.147 | 0.469 | 0.483*** |
| T2 | 12.823 | 12.654 | 0.141 | 0.139 | 0.503 | 0.501 |
| T3 | 12.231 | 11.843* | 0.147 | 0.143 | 0.529 | 0.517*** |
|
| ||||||
| N | 42,204 | 25,282 | 42,204 | 25,282 | 42,204 | 25,282 |
Note: Data are from the 2010 –2019 birth cohorts in Wisconsin’s BD4LK linked administrative data. See caption on Table 1 for data details. We define MAT exposure as any observed prescription fills for Methadone and Buprenorphine-containing opioids known as medication assisted treatment (MAT), counting days of exposure starting from the first day of the fill through any subsequent fills. We measure non-MAT prescriptions similarly, including drug classes of opiate agonists and partial agonists: Codeine, Dihydrocodeine, Fentanyl, Hydrocodone, Hydromorphone, Oxycodone, Meperidine, Morphine, Nalbuphine, Opium, Oxymorphone, Propoxyphene, Tapentadol, Tramadol, Pentazocine, and Butorphanol. We define illicit opioid exposure as the period preceding MAT exposure without more than seven days of non-MAT prescription fills as well as between MAT fills. We estimate the fraction of pregnancy or a given trimester exposed at the individual level and binary exposure indicators for periods with at least one day of exposure.
p < 0.1
p < 0.05
p < 0.01
Table 3 presents our estimated effects of in utero opioid exposure on all eight measures of infant health and well-being for both intensive and extensive margin exposure measures during pregnancy estimated following equation 1, with the full sample and the sibling sample, as well as maternal fixed effects, our preferred specification. The point estimates using the fractional exposure measure imply that a 10 percentage-point increase in the fraction of pregnancy exposed to MAT (or around 30 days) is associated with a 355.0 percent increase in NAS diagnosis, attenuating to 86.0 percent when maternal fixed effects are included. The estimated effects using the exposure indicator, or on the extensive margin, are considerably lower, at 45.2, 13.3, and 4.7 percent, respectively. Our estimates of suspected (broad) NAS –that include cases for which the type of substance was unknown, or where the diagnosis was not later confirmed through toxicology screens – attenuated slightly relative to narrow NAS, though follow the same general pattern and statistical significance. For the remaining outcomes using the fractional exposure measure, the inclusion of maternal fixed effects attenuates the estimated effects of opioid exposure by 55 to 80 percent with the exception of preterm birth and APGAR score, in which maternal fixed effects estimates diminish statistical significance. All remaining health outcomes retain some degree of significance, with the incidence of small for gestational age and low birthweight and increasing by 4.6 to 4.8 percent. Further, in our preferred maternal fixed-effects specification, we find that a 10-percentage point increase in MAT exposure during pregnancy is associated with a 14.6 increase in NICU admission and a 19.7 percent increase in the likelihood of a CPS report, an effect that is four times larger than the effects on low birthweight and small for gestational age.
Table 3:
Estimated effects of any opioid exposure during pregnancy on infant health and wellbeing
| Fraction of pregnancy exposed | Exposure indicator | |||||
|---|---|---|---|---|---|---|
|
|
||||||
| Full | Sibling | Sibling | Full | Sibling | Sibling | |
|
| ||||||
| Narrow NAS | 0.568*** | 0.550*** | 0.404*** | 0.072*** | 0.062*** | 0.022*** |
| SE | (0.008) | (0.011) | (0.016) | (0.001) | (0.002) | (0.002) |
| % mean DV | 355.0% | 117.0% | 86.0% | 45.2% | 13.3% | 4.7% |
| Broad NAS | 0.707*** | 0.683*** | 0.493*** | 0.097*** | 0.08*** | 0.027*** |
| SE | (0.007) | (0.010) | (0.016) | (0.002) | (0.003) | (0.002) |
| % mean DV | 207.9% | 85.4% | 61.6% | 28.6% | 10.0% | 3.4% |
| Low birthweight | 0.125*** | 0.108*** | 0.055*** | 0.025*** | 0.006** | −0.007** |
| SE | (0.006) | (0.009) | (0.011) | (0.002) | (0.003) | (0.003) |
| % mean DV | 14.2% | 9.6% | 4.8% | 2.9% | 0.5% | −0.6% |
| Preterm | 0.0878*** | 0.073*** | 0.023* | 0.023*** | 0.000 | −0.01*** |
| SE | (0.006) | (0.009) | (0.012) | (0.002) | (0.003) | (0.003) |
| % mean DV | 8.4% | 5.5% | 1.7% | 2.2% | 0.0% | −0.8% |
| Small for gest. | 0.135*** | 0.114*** | 0.062*** | 0.026*** | 0.015*** | 0.004 |
| SE | (0.007) | (0.009) | (0.014) | (0.002) | (0.003) | (0.003) |
| % mean DV | 11.3% | 8.4% | 4.6% | 2.2% | 1.1% | 0.3% |
| APGAR <7 | 0.010*** | 0.009** | 0.008 | 0.004*** | −0.001 | −0.003 |
| SE | (0.003) | (0.003) | (0.006) | (0.001) | (0.002) | (0.002) |
| % mean DV | 4.2% | 3.5% | 3.3% | 1.5% | −0.4% | −1.0% |
| CPS in 7 days | 0.137*** | 0.130*** | 0.059*** | 0.021*** | 0.012*** | −0.000 |
| SE | (0.006) | (0.008) | (0.012) | (0.001) | (0.002) | (0.002) |
| % mean DV | 97.9% | 43.3% | 19.7% | 14.6% | 3.8% | −0.2% |
|
| ||||||
| N | 255,227 | 44,838 | 44,838 | 256,755 | 45,161 | 45,161 |
|
| ||||||
| NICU Admission | 0.318*** | 0.304*** | 0.183*** | 0.053*** | 0.032*** | −0.001 |
| SE | (0.008) | (0.011) | (0.017) | (0.002) | (0.003) | (0.003) |
| % mean DV | 32.4% | 24.3% | 14.6% | 5.4% | 2.6% | −0.1% |
|
| ||||||
| N | 227,053 | 39,575 | 39,575 | 228,352 | 39,854 | 39,854 |
|
| ||||||
| Year FE | YES | YES | YES | YES | YES | YES |
| MFE | NO | NO | YES | NO | NO | YES |
Note: Data are from the 2010 –2019 birth cohorts in Wisconsin’s BD4LK linked administrative data. See caption on Table 1 for data details and Table 2 for measure definitions. Outcomes include Narrow and broad definitions of neonatal abstinence syndrome (NAS), child protective services (CPS) report in the first seven days following birth, measured using administrative CPS records, admission to the neonatal intensive care unit (NICU) measured using Medicaid claims (available after 2010), having a low birthweight (LBW) diagnosis (< 2,500g), having a preterm diagnosis (born before 37 weeks), having a small-for-gestational age (SGA) diagnosis (<10th percentile for weight-for-age), and having a five-minute APGAR score of less than 7. Full sample includes all mothers and infants, whereas sibling sample includes only mothers with more than one infant. All models include controls for maternal and child characteristics, including race/ethnicity (White NH, Black NH, Hispanic, and Other NH), maternal age at the start of pregnancy (< 22, 22–30, 31+), education (less than HS, HS or higher), marital status at delivery (married or single), a continuous measure of birth order, infant sex (male, female), plurality, birth quarter, and county urbanicity (urban/rural). In models in which we measure daily opioid exposure, we further include a measure of gestational age using the obstetric estimate. Year fixed effects indicate the infant’s year of birth. Standard errors are clustered at the level of the mother.
p < 0.1
p < 0.05
p < 0.01
The results shown in Table 4 disaggregate opioid exposure during pregnancy by type. Our estimates suggest that NAS bears strong and consistent associations with all three exposure types, though the coefficients for MAT and illicit exposure are at least three times larger than that of non-MAT exposure. Specifically, we find in maternal fixed effects models that a 10-percentage point increase in the fraction of a pregnancy exposed to MAT is associated with a 110.0 percent increase in NAS diagnosis (narrow), illicit with a 94.0 percent increase in NAS diagnosis, while non-MAT is associated with a 32.1 percent increase in NAS diagnosis. Our estimates also suggest that MAT and illicit exposure are associated with a 4.5 to 5.3 percent increase in low birthweight, 5.0 to 5.9 percent increase in small for gestational age diagnosis, and 16.9 to 19.0 percent increase in NICU admissions, respectively. Preterm birth and APGAR score only retain marginal significance for MAT exposure, at 2.7 and 6.4 percent respectively. We detect the largest effects of MAT and illicit exposure on CPS reports at 7 days, at 24 and 30.7 percent, respectively. Estimates using the binary exposure indicator generally follow the same pattern as the fractional exposure estimates, with the exception of several models yielding negative effects on illicit and non-MAT exposure likely due to measurement error.
Table 4:
Estimated effects of any opioid exposure during pregnancy on infant health and wellbeing, by type of exposure
| Fraction of pregnancy exposed | Exposure indicator | |||||
|---|---|---|---|---|---|---|
|
|
||||||
| Full | Sibling | Sibling | Full | Sibling | Sibling | |
|
| ||||||
| Narrow NAS | ||||||
| MAT | 0.676*** | 0.652*** | 0.517*** | 0.546*** | 0.535*** | 0.376*** |
| SE | (0.013) | (0.016) | (0.025) | (0.014) | (0.018) | (0.024) |
| % mean DV | 422.5% | 138.7% | 110.0% | 341.3% | 113.8% | 80.0% |
| non-MAT | 0.248*** | 0.229*** | 0.151*** | 0.015*** | 0.007*** | 0.002 |
| SE | (0.012) | (0.017) | (0.022) | (0.001) | (0.002) | (0.001) |
| % mean DV | 155.0% | 48.7% | 32.1% | 9.4% | 1.5% | 0.4% |
| Illicit | 0.656*** | 0.620*** | 0.442*** | 0.079*** | 0.054** | 0.054** |
| SE | (0.020) | (0.027) | (0.033) | (0.017) | (0.022) | (0.025) |
| % mean DV | 410.0% | 131.9% | 94.0% | 49.4% | 11.5% | 11.5% |
| Broad NAS | ||||||
| MAT | 0.821*** | 0.788*** | 0.594*** | 0.673*** | 0.661*** | 0.447*** |
| SE | (0.010) | (0.013) | (0.023) | (0.012) | (0.016) | (0.023) |
| % mean DV | 241.5% | 98.5% | 74.3% | 197.9% | 82.6% | 55.9% |
| non-MAT | 0.374*** | 0.344*** | 0.249*** | 0.028*** | 0.012*** | 0.003 |
| SE | (0.014) | (0.020) | (0.024) | (0.001) | (0.002) | (0.002) |
| % mean DV | 110.0% | 43.0% | 31.1% | 8.2% | 1.5% | 0.4% |
| Illicit | 0.779*** | 0.748*** | 0.535*** | 0.080*** | 0.053*** | 0.054** |
| SE | (0.017) | (0.023) | (0.031) | (0.015) | (0.019) | (0.024) |
| % mean DV | 229.1% | 93.5% | 66.9% | 23.5% | 6.6% | 6.8% |
| Low birthweight | ||||||
| MAT | 0.124*** | 0.111*** | 0.060*** | 0.117*** | 0.104*** | 0.052*** |
| SE | (0.010) | (0.014) | (0.018) | (0.011) | (0.014) | (0.018) |
| % mean DV | 14.1% | 9.8% | 5.3% | 13.3% | 9.2% | 4.6% |
| non-MAT | 0.128*** | 0.097*** | 0.046** | 0.015*** | −0.004 | −0.009** |
| SE | (0.011) | (0.015) | (0.019) | (0.002) | (0.003) | (0.003) |
| % mean DV | 14.5% | 8.6% | 4.1% | 1.7% | −0.4% | −0.8% |
| Illicit | 0.110*** | 0.107*** | 0.051** | −0.008 | −0.011 | −0.016 |
| SE | (0.016) | (0.022) | (0.024) | (0.013) | (0.016) | (0.018) |
| % mean DV | 12.5% | 9.5% | 4.5% | −0.9% | −1.0% | −1.4% |
| Preterm | ||||||
| MAT | 0.071*** | 0.070*** | 0.036* | 0.072*** | 0.065*** | 0.029* |
| SE | (0.010) | (0.013) | (0.019) | (0.010) | (0.013) | (0.017) |
| % mean DV | 6.8% | 5.3% | 2.7% | 6.9% | 4.9% | 2.2% |
| non-MAT | 0.112*** | 0.073*** | 0.018 | 0.017*** | −0.007** | −0.012** |
| SE | (0.011) | (0.015) | (0.022) | (0.002) | (0.003) | (0.003) |
| % mean DV | 10.7% | 5.5% | 1.4% | 1.6% | −0.5% | −0.9% |
| Illicit | 0.081*** | 0.067*** | −0.001 | −0.003 | −0.009 | −0.019 |
| SE | (0.016) | (0.021) | (0.023) | (0.012) | (0.015) | (0.018) |
| % mean DV | 7.7% | 5.1% | −0.1% | −0.3% | −0.7% | −1.4% |
| Small for gestational age | ||||||
| MAT | 0.156*** | 0.130*** | 0.068*** | 0.137*** | 0.122*** | 0.057*** |
| SE | (0.011) | (0.015) | (0.022) | (0.012) | (0.015) | (0.020) |
| % mean DV | 13.0% | 9.6% | 5.0% | 11.4% | 9.0% | 4.2% |
| non-MAT | 0.100*** | 0.080*** | 0.038* | 0.014*** | 0.005 | 0.002 |
| SE | (0.011) | (0.016) | (0.022) | (0.002) | (0.003) | (0.003) |
| % mean DV | 8.3% | 5.9% | 2.8% | 1.2% | 0.4% | 0.1% |
| Illicit | 0.119*** | 0.108*** | 0.080*** | −0.007 | −0.012 | 0.005 |
| SE | (0.018) | (0.023) | (0.028) | (0.014) | (0.018) | (0.021) |
| % mean DV | 9.9% | 7.9% | 5.9% | −0.6% | −0.9% | 0.4% |
| APGAR < 7 | ||||||
| MAT | 0.010** | 0.006 | 0.016* | 0.024*** | 0.015** | 0.010 |
| SE | (0.005) | (0.006) | (0.009) | (0.006) | (0.007) | (0.011) |
| % mean DV | 4.0% | 2.4% | 6.4% | 9.6% | 6.0% | 4.0% |
| non-MAT | 0.015*** | 0.006 | −0.005 | 0.003*** | −0.002 | −0.003* |
| SE | (0.005) | (0.006) | (0.011) | (0.001) | (0.002) | (0.002) |
| % mean DV | 6.0% | 2.4% | −2.0% | 1.2% | −0.8% | −1.2% |
| Illicit | 0.007 | 0.016 | 0.010 | −0.020** | −0.009 | −0.001 |
| SE | (0.008) | (0.011) | (0.015) | (0.006) | (0.008) | (0.011) |
| % mean DV | 2.8% | 6.4% | 4.0% | −8.0% | −3.6% | −0.4% |
| CPS in 7 days | ||||||
| MAT | 0.115*** | 0.113*** | 0.072*** | 0.105*** | 0.103*** | 0.061*** |
| SE | (0.009) | (0.012) | (0.019) | (0.009) | (0.012) | (0.018) |
| % mean DV | 82.1% | 37.7% | 24.0% | 75.0% | 34.3% | 20.3% |
| non-MAT | 0.069*** | 0.057*** | 0.017 | 0.007*** | −0.002 | −0.003** |
| SE | (0.007) | (0.011) | (0.016) | (0.001) | (0.002) | (0.002) |
| % mean DV | 49.3% | 19.0% | 5.7% | 5.0% | −0.7% | −1.0% |
| Illicit | 0.251*** | 0.244*** | 0.092*** | 0.064*** | 0.056*** | 0.011 |
| SE | (0.018) | (0.024) | (0.030) | (0.012) | (0.016) | (0.019) |
| % mean DV | 179.3% | 81.3% | 30.7% | 45.7% | 18.7% | 3.7% |
|
| ||||||
| N | 255,227 | 44,838 | 44,838 | 256,755 | 45,161 | 45,161 |
|
| ||||||
| NICU Admission | ||||||
| MAT | 0.347*** | 0.334*** | 0.211*** | 0.307*** | 0.294*** | 0.183*** |
| SE | (0.014) | (0.018) | (0.026) | (0.014) | (0.018) | (0.026) |
| % mean DV | 35.4% | 26.7% | 16.9% | 31.3% | 23.5% | 14.6% |
| non-MAT | 0.197*** | 0.167*** | 0.062** | 0.021*** | −0.000 | −0.011** |
| SE | (0.013) | (0.018) | (0.027) | (0.002) | (0.003) | (0.003) |
| % mean DV | 20.1% | 13.4% | 5.0% | 2.1% | 0.0% | −0.9% |
| Illicit | 0.360*** | 0.357*** | 0.238*** | 0.015 | 0.014 | 0.006 |
| SE | (0.021) | (0.028) | (0.036) | (0.017) | (0.022) | (0.026) |
| % mean DV | 36.7% | 28.6% | 19.0% | 1.5% | 1.1% | 0.5% |
|
| ||||||
| N | 227,053 | 39,575 | 39,575 | 228,352 | 39,854 | 39,854 |
|
| ||||||
| Year FE | YES | YES | YES | YES | YES | YES |
| MFE | NO | NO | YES | NO | NO | YES |
Note: Data are from the 2010 –2019 birth cohorts in Wisconsin’s BD4LK linked administrative data. See caption on Table 1 for data details and Table 2 for measure definitions. Outcomes include Narrow and broad definitions of neonatal abstinence syndrome (NAS), child protective services (CPS) report in the first seven days following birth, measured using administrative CPS records, admission to the neonatal intensive care unit (NICU) measured using Medicaid claims (available after 2010), having a low birthweight (LBW) diagnosis (< 2,500g), having a preterm diagnosis (born before 37 weeks), having a small-for-gestational age (SGA) diagnosis (<10th percentile for weight-for-age), and having a five-minute APGAR score of less than 7. Full sample includes all mothers and infants, whereas sibling sample includes only mothers with more than one infant. All models include controls for maternal and child characteristics, including race/ethnicity (White NH, Black NH, Hispanic, and other), maternal age at the start of pregnancy (< 22, 22–30, 31+), education (less than HS, HS or higher), marital status at delivery (married or single), birth order, infant sex (male, female), an indicator for plurality, birth quarter, county urbanicity (urban/rural). In models in which we measure daily opioid exposure, we further include a measure of gestational age using the obstetric estimate. Year fixed effects indicate the infant’s year of birth. Standard errors are clustered at the level of the mother.
p < 0.1
p < 0.05
p < 0.01
Across all outcomes, non-MAT exposure yields either null effects or those that are smaller in magnitude than the other types of exposure. These effects are not trivial, though are substantially smaller than estimates in prior work, giving credence to the ‘supply side’ argument that prescribing behavior is partially responsible for the opioid epidemic. Indeed, we find that non-MAT exposure is associated with a 4.1 percent increase in low birthweight, a 2.8 percent increase in small for gestational age, and a 5.0 percent increase in NICU admission. Prior estimates are substantially larger for all outcomes, ranging from 15 percent to 191 percent (Azuine et al. 2019; Corsi et al. 2020), though these and other studies detect statistically significant increases in the incidence of preterm birth and APGAR score as well, closely resembling our LPM estimates for the full sample than maternal fixed effects estimates (Brogly et al. 2021; Nørgaard et al. 2015).
Figures 1–4 present the percent increases or decreases in the same outcomes shown above, however, with opioid exposure measured at the level of the trimester. The associated tables are shown in the Appendix (Tables A1–A3). Figure 1 presents our estimation of the effect of in utero opioid exposure on both narrow and broad NAS diagnosis, including LPM with both the full and sibling samples, as well as that with maternal fixed effects. Models with maternal fixed effects imply that a 10 percentage-point increase in opioid exposure due to non-MAT prescriptions (notated as ‘Rx’) is associated with an increase in NAS diagnosis during the first, second, and third trimesters by 13.2, 11.7, and 6.2 percent, respectively. MAT and illicit exposure appear to increase NAS rates by 22.1 and 17.9 percent in the first trimester and 60.6 and 53.0 percent in the third, implying that transitioning from illicit use to treatment in either period could increase the risk of NAS, but that those who begin treatment in the first trimester likely experience the lowest absolute rates of NAS diagnosis. Estimates using the broad NAS diagnosis definition are smaller but follow similar patterns.
Figure 1:

Estimated effects of the fraction of trimesters opioid exposed on NAS
Note: See notes on Tables 1 and 2 for data description and measure definitions and note on Table 3 for model specifications. Outcomes include narrow and broad neonatal abstinence syndrome (NAS), across three specifications: maternal fixed effects (MFE) estimated using sibling pairs and linear probability models (LPM) estimated using sibling pairs ‘sib’ and the full sample.
Figure 4:

Estimated effects of the fraction of trimesters opioid exposed on measures of child wellbeing
Note: See notes on Tables 1 and 2 for data description and measure definitions and note on Table 4 for model specifications. Outcomes include CPS report within seven days and NICU admission, across three specifications: maternal fixed effects (MFE) estimated using sibling pairs and linear probability models (LPM) estimated using sibling pairs ‘sib’ and the full sample.
An important caveat to our interpretation is that the variation in standard errors imply that our measures for MAT and illicit exposure are more prone to error than non-MAT (Rx) exposure. Though MAT use is measured (and observed) directly through prescription claims, like non-MAT exposure, MAT exposure appears to cycle on and off throughout pregnancy. Based on feedback from practitioners, we code these gaps in MAT exposure as ‘illicit’ to account for plausible use during these periods. As a result, the MAT and illicit measures could be easily conflated if they’re observed for equal lengths of time in a single trimester or pregnancy.
Figures 2–4 employ the same models for other measures of child health and wellbeing. In Figure 2, we observe relatively small effects on low birthweight and preterm birth when employing the LPM on the full and sibling sample, attenuated for all types of exposures and periods by the inclusion of maternal fixed effects except for second trimester exposure to non-MAT opioids. In contrast to the pregnancy-level models shown in Table 4, in which we detected negative birthweight effects for all types of exposures ranging from 4.1 to 5.3 percent, null trimester level effects imply that pregnancy-level measures might capture other forms of substance abuse or are otherwise subject to measurement error. We observe the same general pattern in Figure 3. Figure 4 presents the estimated effects of increased opioid exposure on CPS reports and NICU admission. CPS reports in the full and sibling samples estimated without maternal fixed effects, the inclusion of which attenuates our estimates in all except for first trimester non-MAT use. We observe the same pattern for NICU admission except for MAT and illicit use in the third trimester, for which we observe a 14.5 to 14.9 percent increase in our preferred maternal fixed effects models.
Figure 2:

Estimated effects of the fraction of trimesters opioid exposed on birthweight and gestational age
Note: See notes on Tables 1 and 2 for data description and measure definitions and note on Table 4 for model specifications. Outcomes include low birthweight (<2,500g) and preterm birth (< 37 weeks), across three specifications: maternal fixed effects (MFE) estimated using sibling pairs and linear probability models (LPM) estimated using sibling pairs ‘sib’ and the full sample.
Figure 3:
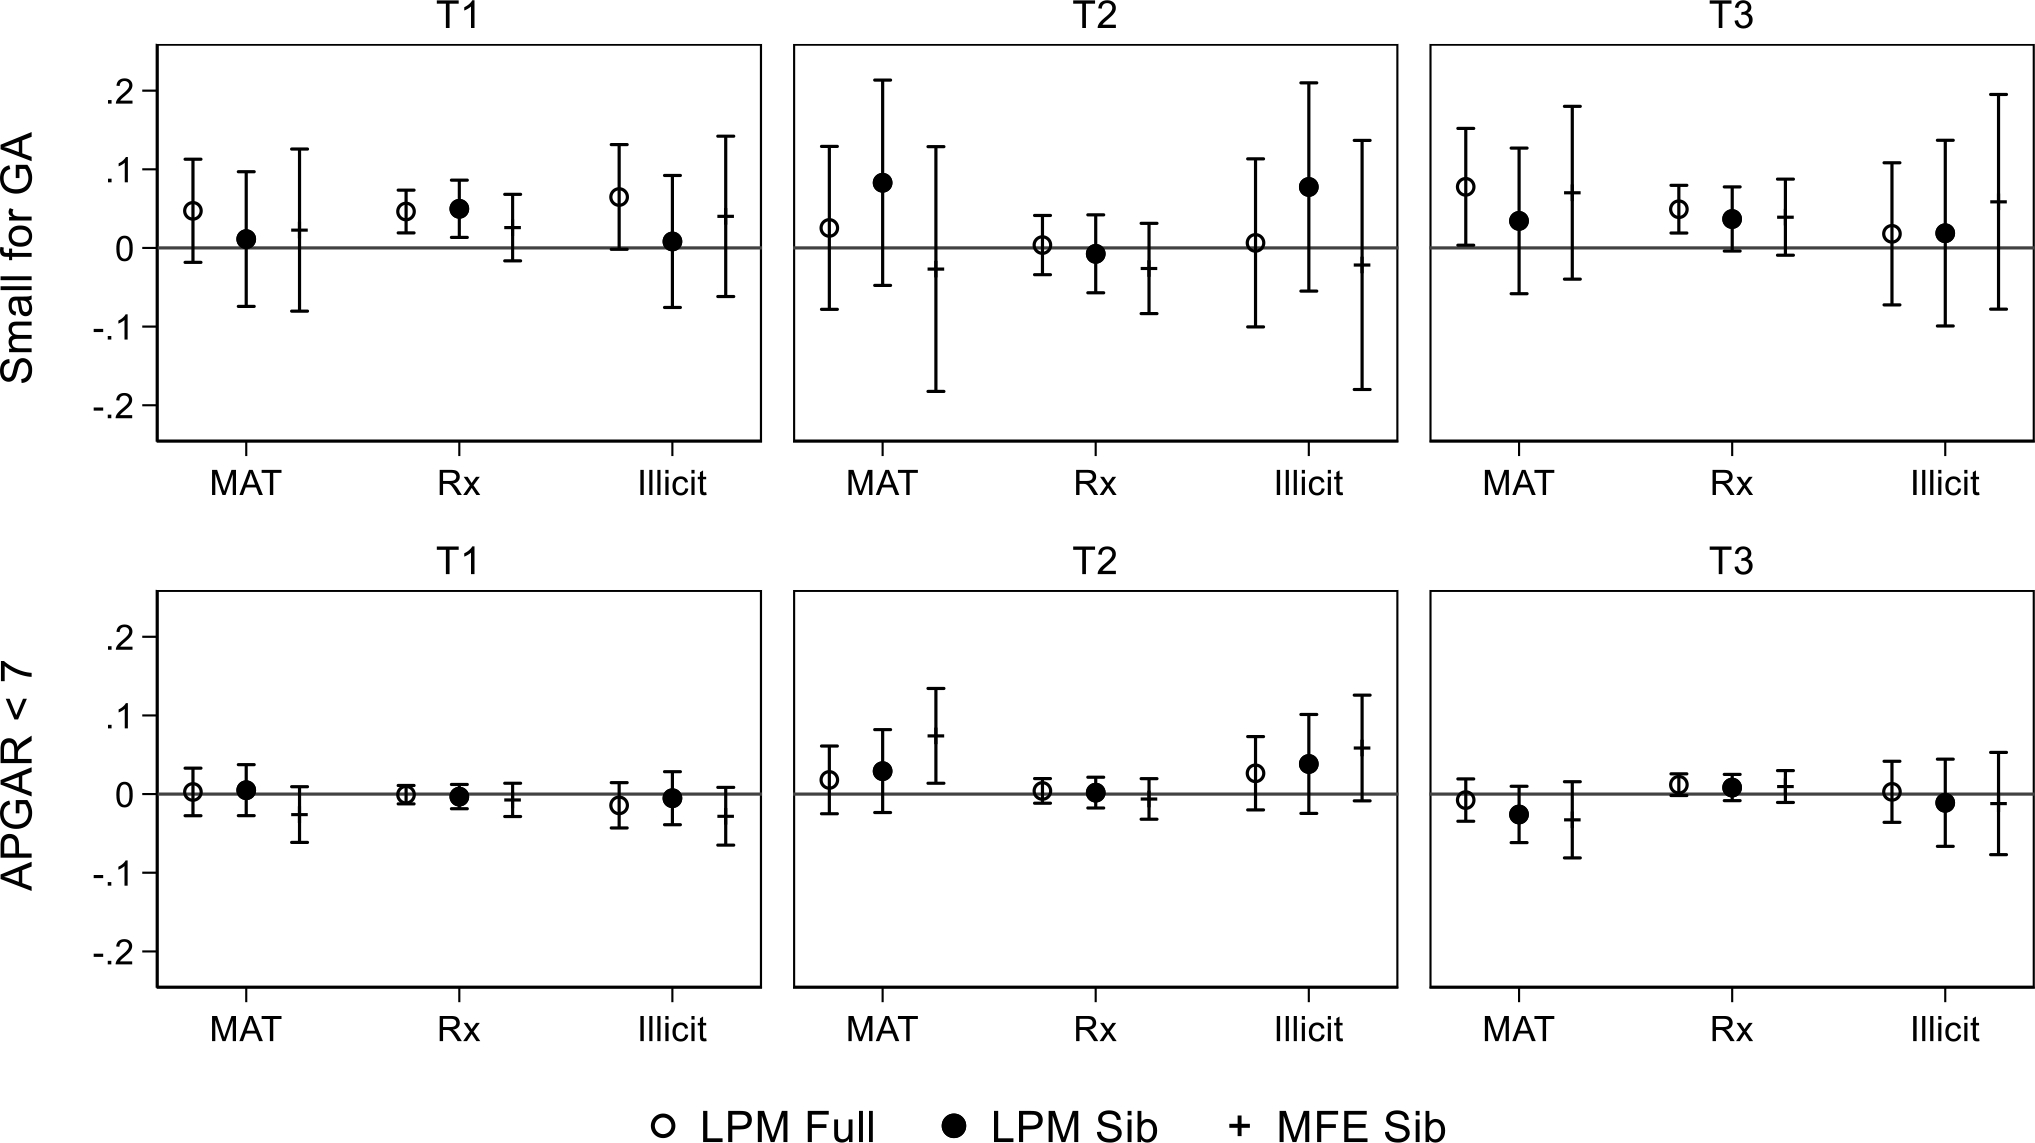
Estimated effects of the fraction of trimesters opioid exposed on health at birth
Note: See notes on Tables 1 and 2 for data description and measure definitions and note on Table 4 for model specifications. Outcomes include small for gestation age (< 10th percentile) and five-minute APGAR score <7, across three specifications: maternal fixed effects (MFE) estimated using sibling pairs and linear probability models (LPM) estimated using sibling pairs ‘sib’ and the full sample.
In summary, our preferred estimates imply that exposure to all three types of opioids during pregnancy is associated with increased risk of NAS, low birthweight, small for gestational age, NICU admissions, and CPS reports within 7 days, bearing the strongest associations with NAS. However, when we estimate fractional exposure at the trimester level, MAT and illicit exposure appear to drive NICU admissions in the third trimester and NAS in the first and third trimesters. Interestingly, preterm birth and APGAR score are insignificant in the pregnancy level models yet gain statistical significance in trimester-level models with effects concentrated in trimester 2. While exposure at the extensive margin is somewhat less consistent than estimates from fractional exposure measures, that we detect consistent effects from MAT exposures suggests that siblings exposed to MAT exhibited poorer health and a higher risk of CPS involvement at birth, relative to their sibling without MAT exposure.
Robustness checks
While maternal fixed effects control for unobserved differences across pregnancies, a central criticism is that pregnancy characteristics might be endogenous to birth order. Accordingly, we test for the robustness of inclusion of possibly endogenous controls, including trimester prenatal care began, smoking during pregnancy, and chronic/gestational diabetes and hypertension. As these measures might also be a function of substance use, their inclusion might bias the estimated effects of exposure on birth outcomes. However, the estimated effects of prenatal opioid exposure (not shown) are nearly identical to the effects we report here, suggesting that maternal fixed effects indeed absorb the cross-pregnancy variation in outcomes due to maternal health and ‘high-risk’ pregnancies.8
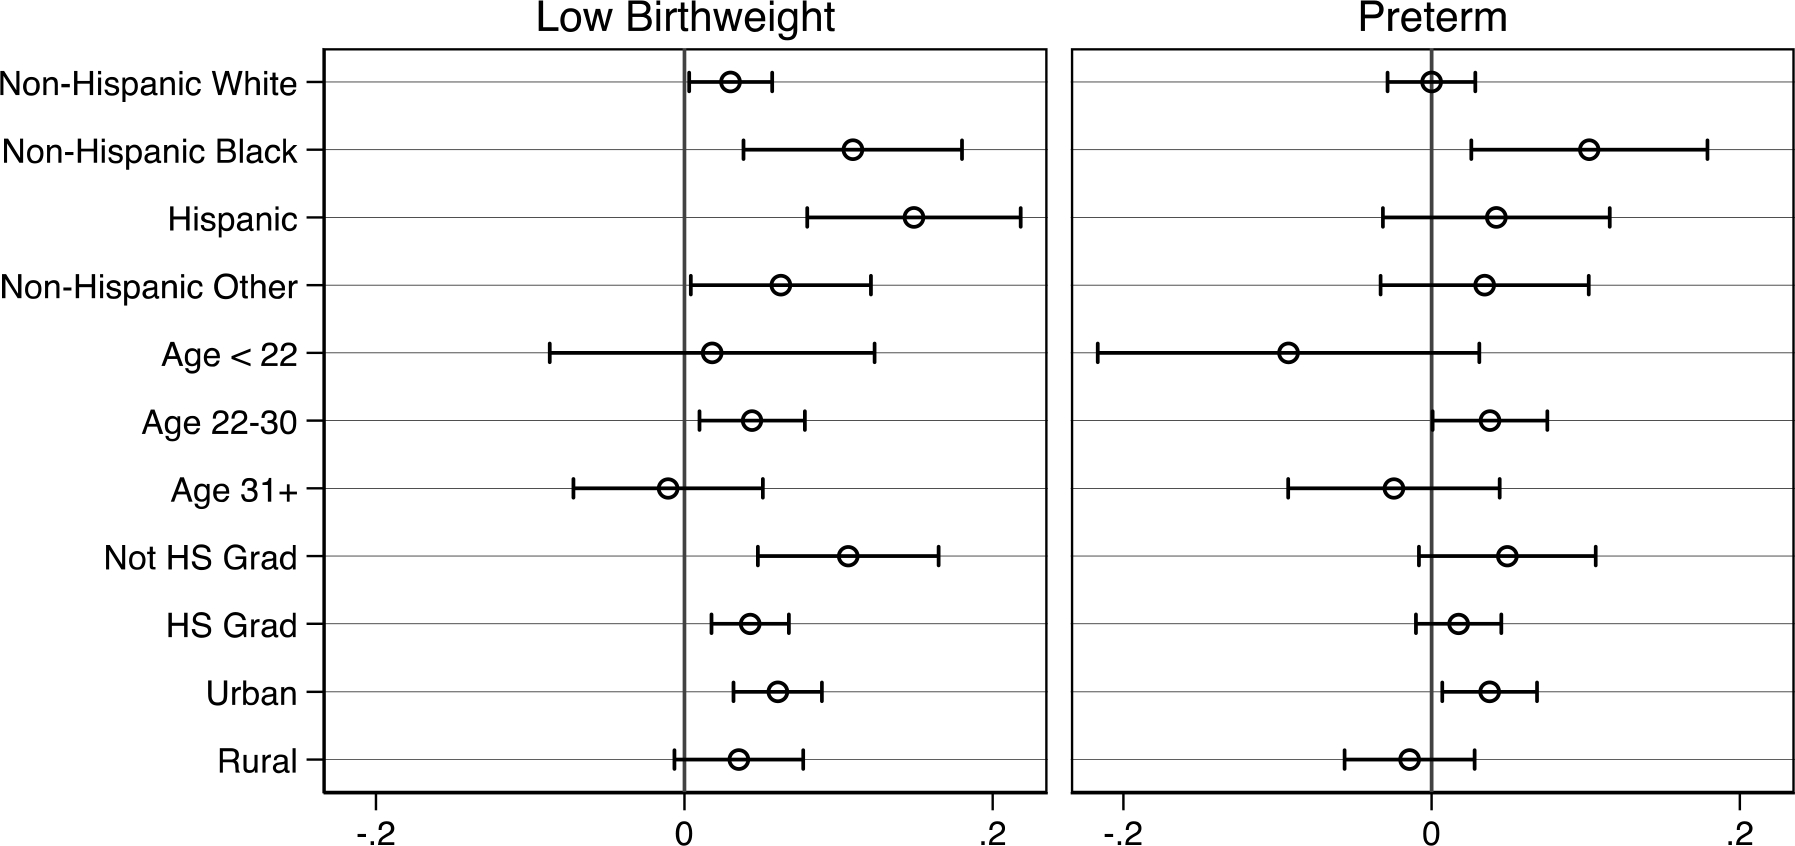
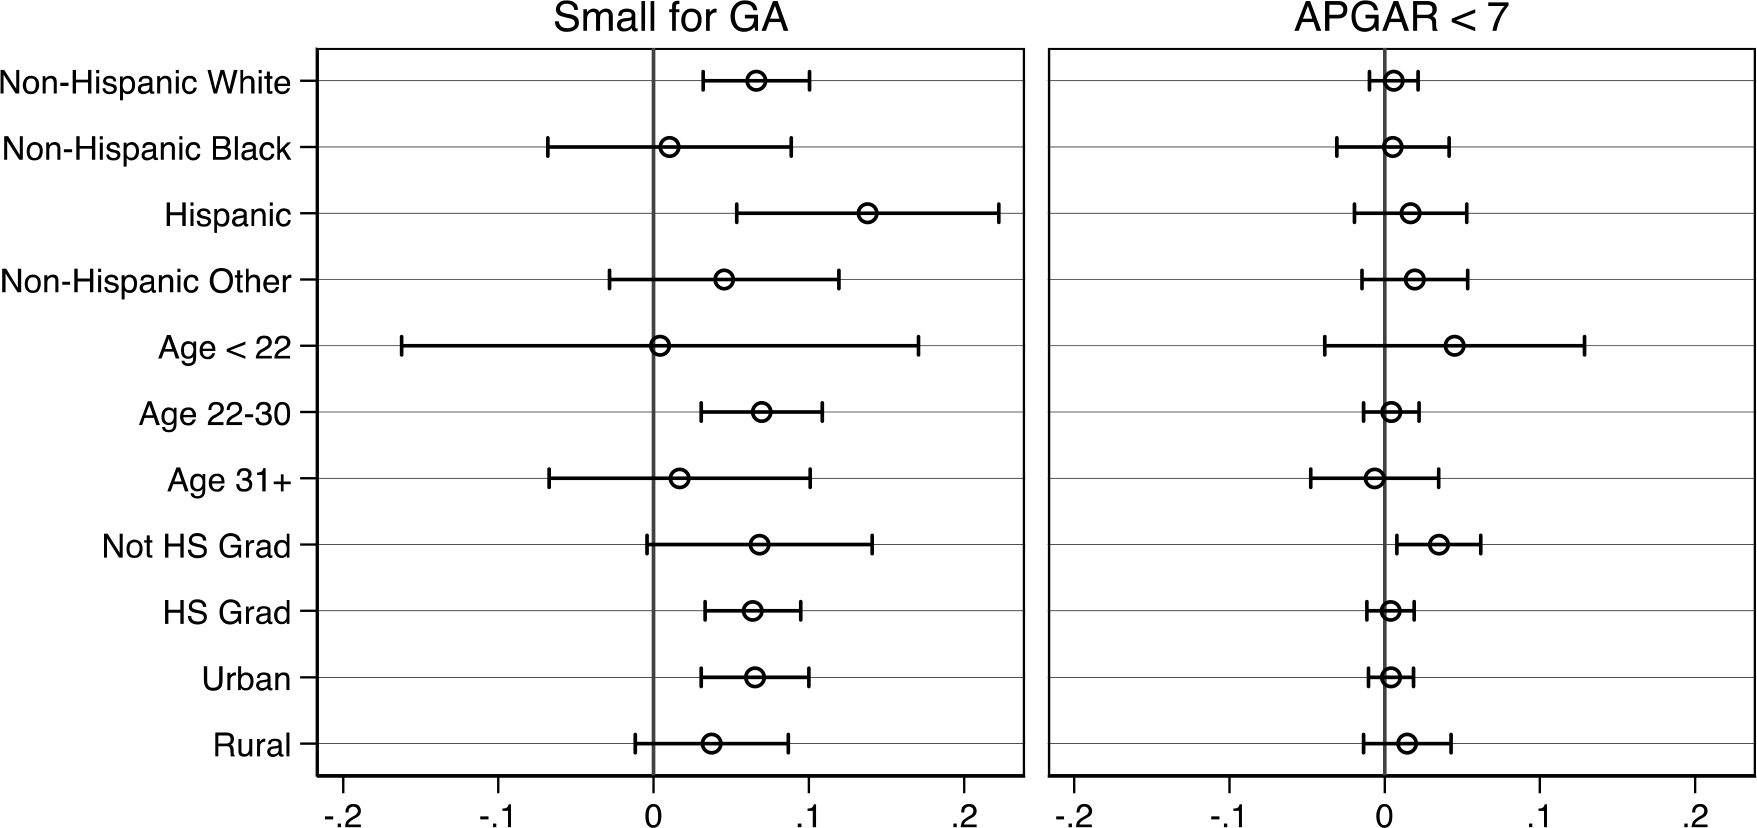
Further, we examine the heterogeneity of our estimated opioid exposure effects by stratifying models by maternal age (< 21, 22–30, and 31+), education (< high school, high school, some college, and BA or higher), geographic characteristics (rural versus urban), and race/ethnicity (White NH, Black NH, Hispanic, and Other NH). The plots presented in Figures A2 through A5 in the appendix show the coefficient estimates for the fraction of pregnancy exposed to any opioid type, estimated using maternal fixed effects (akin to those shown in Table 3) in the appendix. All subgroups exhibit large positive effects of opioid exposure on NAS diagnosis, though estimates for Black NH mothers and those age 31 or older are nominally smaller than the others. In terms of health measures, all effects are smaller in magnitude and closer to zero with few instances of meaningfully heterogeneous effects when confidence intervals are accounted for. The two exceptions are mothers of Hispanic ethnicity and those in urban counties, who exhibit larger effects on low birthweight, small for gestational age, and CPS reports within 7 days. Finally, NICU admission estimates are generally larger in magnitude and consistently significant, though we detect little heterogeneity across subgroups except for nominally larger effects among those with less than a high school degree.
Discussion and Conclusion
In this study, we used timing- (and type-) specific opioid exposure measures during pregnancy combined with maternal fixed-effects models to estimate the effect of in utero exposure to opioids on a range of health and wellbeing outcomes at birth. Our estimates reveal three key findings.
First, we find that all three types of exposure (MAT, non-MAT, illicit), at any time during a pregnancy, are strongly predictive of both narrow and broad measures of NAS. Though our estimates are similar in direction and significance to prior studies, our estimates are generally smaller in magnitude. This is in part because we proxy for illicit exposure using a novel method to characterize illicit use in reference to observed MAT and non-MAT use, plausibly capturing the timing and extent of all three types of prenatal opioid use in ways the existing literature has been unable to do. Our results show that a 10-percentage point increase in the fraction of the pregnancy exposed opioids is associated with an 86 percent increase in NAS diagnosis, driven by MAT and illicit exposure particularly in the third trimester, suggesting that that exposure closer to birth is more meaningful. Said differently, a 30-day increase in the number of pregnancy days exposed is associated with an 86 percent increase in the risk of NAS diagnosis. We also find that while non-MAT use is associated with NAS diagnosis, these effects are much smaller in magnitude and concentrated in the first two trimesters.
Second, we detect relatively mild effects of opioid exposure on all infant health measures except for NICU admission. When we examine any opioid exposure without consideration of exposure timing or intensity, we find substantially smaller effects for low birth weight and small for gestational age relative to prior literature, around a 5 percent increase for every 10-percentage point increase in exposure overall, and for each type of opioid exposure, but with little variation with respect to timing. In contrast, we find that NICU admission appears to be driven by third trimester exposure to MAT and illicit opioids. Similarly, our estimates suggest that the likelihood of CPS involvement increases by 19.7 percent for every 10-percentage point increase in the fraction of the pregnancy opioid exposed, largely driven by MAT and illicit opioids with little variation by trimester. On the extensive margin, our estimates indicate that for every 100 women who use MAT during pregnancy, around 20 infants will be subject to a CPS report in the first 7 days after birth. By estimating effects across type and timing of opioid exposure on both extensive and intensive margins, our results are better able to estimate critical periods during pregnancy that may be best suited for intervention.
Third, our findings also highlight the importance of increasing access to maternal opioid abuse treatment rather than expanding punitive policies that count maternal substance abuse as reportable to CPS. Failure to update treatment-deterring policies could cause history to repeat itself. Indeed, scores of children were permanently removed from their mothers (via termination of parental rights) during the crack-cocaine epidemic of the 1990’s, when fetal cocaine exposure was broadly considered a form of child abuse. Though initial claims of adverse birth effects were later unfounded, the irreparable damage exacted upon children and families only further aggravated class and racial divisions.8 Prior work has shown that supply-side solutions, such as Prescription Drug Monitoring Programs (PDMPs) might directly reduce CPS involvement (Bruzelius et al. 2021; Evans, Harris, and Kessler 2020; Gihleb, Giuntella, and Zhang 2018). To the extent that other measures of child health follow the same pattern, as ours and prior studies demonstrate (Arteaga and Barone 2021; Gihleb et al. 2020; Ziedan and Kaestner 2020), efforts to curb prescriptions should be met with other supportive interventions for mothers experiencing chronic pain.
We have shown that the effects of opioid exposure on infant health differ by timing and exposure type, with the largest and most consistent effects detected among illicit and MAT exposure overall and especially during the third trimester. Two key questions remain. First, our specification implicitly assumes that exposure is linearly related to the outcomes we examine here. Therefore, future work should test this assumption, enabling low-supply fills to have plausibly different effects than high-supply fills. A related concern is that the exposure days might not capture the intensity of exposure (dosage effects). A second question is whether the effects we observe exact a toll on health and cognition throughout childhood and adulthood. Future work should explore whether the timing and intensity of opioids in utero bear any long-term, causal consequences on children’s physical or mental health, cognitive ability, or behaviors as evidenced by several observational studies (Nygaard et al. 2020; Odegaard et al. 2021). If on one hand, the estimated effects of in utero exposure are indeed inflated at birth and fade later in life, we might conclude that the benefits of extended pain relief outweigh the short-lived harms, such as NAS and encounters with the child welfare system. On the other hand, if opioid exposure exacts a causal effect on health at birth, particularly with potential ongoing consequences, safer alternatives to opioids should be explored.
Acknowledgments
We gratefully acknowledge NIH support to complete this work (NIH R01 #HD102125-01, MPIs Berger and Ehrenthal) and the institutional support provided by the Institute for Research on Poverty. We thank HeeJin Kim for excellent research assistance as well. Jessica Pac was lead author on this paper. The other three others contributed equally to all aspects of the paper and their names are placed in alphabetical order.
The authors of this article are solely responsible for the content therein. The authors would like to thank the Wisconsin Department of Health Services and the Wisconsin Department of Children and Families for the use of data for this analysis, but these agencies do not certify the accuracy of the analyses presented.
Appendix
Figure A1:

Opioid deaths per 100,000 in Wisconsin compared to the United States
Note: US data are from the National Center for Health Statistics (NCHS) at the Centers for Disease Control and Prevention and Wisconsin data are from the Wisconsin Department of Health Services.
Figure A2:

Stratified fractional exposure estimates during pregnancy with maternal fixed effects
Figure A3:
Stratified fractional exposure estimates during pregnancy with maternal fixed effects
Figure A4:
Stratified fractional exposure estimates during pregnancy with maternal fixed effects
Figure A5:

Stratified fractional exposure estimates during pregnancy with maternal fixed effects
Table A1:
Wisconsin characteristics
| Year | Characteristic | Wisconsin | United States |
|---|---|---|---|
|
| |||
| 2021 | Population | 5,895,908 | 331,893,745 |
| 2021 | Children < 18 | 21.80% | 22.30% |
| 2021 | White NH | 87.00% | 76.30% |
| 2021 | Black NH | 6.70% | 13.40% |
| 2021 | Hispanic | 7.10% | 18.50% |
| 2016–2020 | Foreign born | 5.00% | 13.50% |
| 2016–2020 | Homeownership | 67.10% | 64.40% |
| 2016–2020 | Household size | 2.38 | 2.6 |
| 2016–2020 | Mobility (1 year) | 86.40% | 86.20% |
| 2016–2020 | Owns computer | 90.70% | 91.90% |
| 2016–2020 | HS graduate or higher | 92.60% | 88.50% |
| 2016–2020 | BA or higher | 30.80% | 32.90% |
| 2016–2020 | With a disability | 8.00% | 8.70% |
| 2016–2020 | Without health insurance | 6.80% | 10.20% |
| 2016–2020 | Labor force participant (female) | 62.60% | 58.40% |
| 2016–2020 | Median income | $63,293 | $64,994 |
| 2021 | In poverty | 10.00% | 11.40% |
Source: Census Bureau (2021) ‘Quick Facts’ data derived from: QuickFacts data are derived from: Population Estimates, American Community Survey, Census of Population and Housing, Current Population Survey, Small Area Health Insurance Estimates, Small Area Income and Poverty Estimates, State and County Housing Unit Estimates, County Business Patterns, Nonemployer Statistics, Economic Census, Survey of Business Owners, Building Permits
Table A2:
Fraction of trimester opioid exposed on Neonatal Abstinence Syndrome (NAS)
| Narrow NAS | Broad NAS | |||||
|---|---|---|---|---|---|---|
|
|
||||||
| Full sample | Sibling sample | Full sample | Sibling sample | |||
|
| ||||||
| MAT-T1 | 0.177*** | 0.179*** | 0.104* | 0.288*** | 0.284*** | 0.158*** |
| (0.037) | (0.050) | (0.061) | (0.039) | (0.053) | (0.060) | |
| 110.6% | 38.1% | 22.1% | 84.7% | 35.5% | 19.8% | |
| MAT-T2 | 0.014 | 0.063 | 0.125 | 0.019 | 0.066 | 0.161* |
| (0.059) | (0.077) | (0.096) | (0.062) | (0.082) | (0.096) | |
| 8.8% | 13.4% | 26.6% | 5.6% | 8.3% | 20.1% | |
| MAT-T3 | 0.477*** | 0.408*** | 0.285*** | 0.506*** | 0.436*** | 0.275*** |
| (0.042) | (0.055) | (0.069) | (0.043) | (0.056) | (0.068) | |
| 298.1% | 86.8% | 60.6% | 148.8% | 54.5% | 34.4% | |
| non-MAT-T1 | 0.075*** | 0.068*** | 0.062*** | 0.113*** | 0.108*** | 0.098*** |
| (0.012) | (0.016) | (0.019) | (0.014) | (0.019) | (0.023) | |
| 46.9% | 14.5% | 13.2% | 33.2% | 13.5% | 12.3% | |
| non-MAT-T2 | 0.050*** | 0.068*** | 0.055** | 0.056*** | 0.067** | 0.042 |
| (0.016) | (0.022) | (0.025) | (0.020) | (0.027) | (0.030) | |
| 31.3% | 14.5% | 11.7% | 16.5% | 8.4% | 5.3% | |
| non-MAT-T3 | 0.118*** | 0.088*** | 0.029 | 0.203*** | 0.168*** | 0.111*** |
| (0.013) | (0.018) | (0.021) | (0.017) | (0.023) | (0.027) | |
| 73.8% | 18.7% | 6.2% | 59.7% | 21.0% | 13.9% | |
| Illicit-T1 | 0.206*** | 0.166*** | 0.084 | 0.315*** | 0.282*** | 0.143** |
| (0.039) | (0.052) | (0.062) | (0.040) | (0.054) | (0.061) | |
| 128.8% | 35.3% | 17.9% | 92.6% | 35.3% | 17.9% | |
| Illicit-T2 | 0.033 | 0.084 | 0.120 | 0.037 | 0.104 | 0.176* |
| (0.062) | (0.081) | (0.099) | (0.063) | (0.083) | (0.098) | |
| 20.6% | 17.9% | 25.5% | 10.9% | 13.0% | 22.0% | |
| Illicit-T3 | 0.394*** | 0.392*** | 0.249*** | 0.374*** | 0.327*** | 0.193** |
| (0.053) | (0.070) | (0.084) | (0.051) | (0.068) | (0.080) | |
| 246.3% | 83.4% | 53.0% | 110.0% | 40.9% | 24.1% | |
|
| ||||||
| Year FE | YES | YES | YES | YES | YES | YES |
| MFE | NO | NO | YES | NO | NO | YES |
| N | 255,227 | 44,838 | 44,838 | 255,227 | 44,838 | 44,838 |
Table A3:
Fraction of trimester opioid exposed on birth outcomes
| LBW | Preterm | SGA | |||||||
|---|---|---|---|---|---|---|---|---|---|
| Full sample | Sibling sample | Full sample | Sibling sample | Full sample | Sibling sample | ||||
|
| |||||||||
| MAT-T1 | 0.050* | −0.004 | −0.011 | 0.059** | 0.024 | 0.055 | 0.047 | 0.011 | 0.023 |
| (0.028) | (0.036) | (0.047) | (0.028) | (0.037) | (0.046) | (0.033) | (0.044) | (0.053) | |
| 5.7% | −0.4% | −1.0% | 5.6% | 1.8% | 4.2% | 3.9% | 0.8% | 1.7% | |
| MAT-T2 | 0.085* | 0.141** | 0.045 | 0.026 | 0.080 | 0.024 | 0.025 | 0.083 | −0.027 |
| (0.046) | (0.056) | (0.062) | (0.042) | (0.055) | (0.059) | (0.053) | (0.067) | (0.079) | |
| 9.7% | 12.5% | 4.0% | 2.5% | 6.1% | 1.8% | 2.1% | 6.1% | −2.0% | |
| MAT-T3 | −0.002 | −0.021 | 0.029 | −0.002 | −0.024 | −0.030 | 0.078** | 0.034 | 0.070 |
| (0.035) | (0.042) | (0.043) | (0.030) | (0.038) | (0.040) | (0.038) | (0.047) | (0.056) | |
| −0.2% | −1.9% | 2.6% | −0.2% | −1.8% | −2.3% | 6.5% | 2.5% | 5.1% | |
| non-MAT-T1 | 0.056*** | 0.037** | 0.025 | 0.006 | −0.027 | −0.060*** | 0.046*** | 0.050*** | 0.026 |
| (0.013) | (0.017) | (0.020) | (0.014) | (0.018) | (0.022) | (0.014) | (0.019) | (0.022) | |
| 6.4% | 3.3% | 2.2% | 0.6% | −2.0% | −4.5% | 3.8% | 3.7% | 1.9% | |
| non-MAT-T2 | 0.036** | 0.033 | 0.041 | 0.045** | 0.058** | 0.086*** | 0.004 | −0.007 | −0.026 |
| (0.018) | (0.023) | (0.026) | (0.019) | (0.025) | (0.029) | (0.019) | (0.025) | (0.029) | |
| 4.1% | 2.9% | 3.6% | 4.3% | 4.4% | 6.5% | 0.3% | −0.5% | −1.9% | |
| non-MAT-T3 | 0.036** | 0.027 | −0.025 | 0.062*** | 0.044** | −0.009 | 0.049*** | 0.037* | 0.039 |
| (0.014) | (0.019) | (0.022) | (0.016) | (0.021) | (0.024) | (0.015) | (0.021) | (0.025) | |
| 4.1% | 2.4% | −2.2% | 5.9% | 3.3% | −0.7% | 4.1% | 2.7% | 2.9% | |
| Illicit-T1 | 0.030 | −0.001 | −0.015 | 0.041 | 0.006 | −0.004 | 0.065* | 0.008 | 0.040 |
| (0.028) | (0.036) | (0.045) | (0.029) | (0.038) | (0.046) | (0.034) | (0.043) | (0.052) | |
| 3.4% | −0.1% | −1.3% | 3.9% | 0.5% | −0.3% | 5.4% | 0.6% | 2.9% | |
| Illicit-T2 | 0.079 | 0.099* | 0.030 | 0.022 | 0.063 | 0.039 | 0.007 | 0.078 | −0.022 |
| (0.048) | (0.058) | (0.061) | (0.045) | (0.058) | (0.063) | (0.055) | (0.068) | (0.081) | |
| 9.0% | 8.8% | 2.7% | 2.1% | 4.8% | 3.0% | 0.6% | 5.7% | −1.6% | |
| Illicit-T3 | −0.024 | −0.000 | 0.033 | −0.002 | −0.021 | −0.044 | 0.018 | 0.019 | 0.059 |
| (0.043) | (0.054) | (0.053) | (0.039) | (0.052) | (0.055) | (0.046) | (0.060) | (0.070) | |
| −2.7% | 0.0% | 2.9% | −0.2% | −1.6% | −3.3% | 1.5% | 1.4% | 4.3% | |
|
| |||||||||
| Year FE | YES | YES | YES | YES | YES | YES | YES | YES | YES |
| MFE | NO | NO | YES | NO | NO | YES | NO | NO | YES |
| N | 255,227 | 44,838 | 44,838 | 255,227 | 44,838 | 44,838 | 255,227 | 44,838 | 44,838 |
Table A4:
Fraction of trimester opioid exposed on child well-being
| APGAR <7 | CPS in 7 days | NICU Admission | |||||||
|---|---|---|---|---|---|---|---|---|---|
| Full sample | Sibling sample | Full sample | Sibling sample | Full sample | Sibling sample | ||||
|
| |||||||||
| MAT-T1 | 0.003 | 0.005 | −0.026 | 0.095*** | 0.056 | 0.010 | 0.163*** | 0.162*** | 0.081 |
| (0.015) | (0.017) | (0.018) | (0.027) | (0.034) | (0.044) | (0.039) | (0.051) | (0.061) | |
| 1.2% | 2.0% | −10.4% | 67.9% | 18.7% | 3.3% | 16.6% | 13.0% | 6.5% | |
| MAT-T2 | 0.018 | 0.029 | 0.074** | −0.021 | 0.045 | 0.058 | −0.107* | −0.103 | −0.048 |
| (0.022) | (0.027) | (0.031) | (0.048) | (0.062) | (0.077) | (0.060) | (0.076) | (0.091) | |
| 7.2% | 11.6% | 29.6% | −15.0% | 15.0% | 19.3% | −10.9% | −8.2% | −3.8% | |
| MAT-T3 | −0.008 | −0.026 | −0.033 | 0.040 | 0.012 | 0.000 | 0.303*** | 0.287*** | 0.186*** |
| (0.014) | (0.018) | (0.025) | (0.037) | (0.049) | (0.059) | (0.042) | (0.052) | (0.066) | |
| −3.2% | −10.4% | −13.2% | 28.6% | 4.0% | 0.0% | 30.9% | 23.0% | 14.9% | |
| non-MAT-T1 | −0.001 | −0.003 | −0.007 | 0.038*** | 0.036*** | 0.031* | 0.052*** | 0.023 | 0.008 |
| (0.006) | (0.008) | (0.011) | (0.009) | (0.013) | (0.016) | (0.016) | (0.020) | (0.027) | |
| −0.4% | −1.2% | −2.8% | 27.1% | 12.0% | 10.3% | 5.3% | 1.8% | 0.6% | |
| non-MAT-T2 | 0.004 | 0.002 | −0.006 | 0.020 | 0.013 | 0.002 | 0.048** | 0.058** | 0.056 |
| (0.008) | (0.010) | (0.013) | (0.012) | (0.017) | (0.021) | (0.022) | (0.028) | (0.035) | |
| 1.6% | 0.8% | −2.4% | 14.3% | 4.3% | 0.7% | 4.9% | 4.6% | 4.5% | |
| non-MAT-T3 | 0.012* | 0.008 | 0.010 | 0.012 | 0.009 | −0.014 | 0.096*** | 0.088*** | −0.004 |
| (0.007) | (0.009) | (0.010) | (0.010) | (0.014) | (0.016) | (0.017) | (0.023) | (0.030) | |
| 4.8% | 3.2% | 4.0% | 8.6% | 3.0% | −4.7% | 9.8% | 7.0% | −0.3% | |
| Illicit-T1 | −0.014 | −0.005 | −0.028 | 0.154*** | 0.118*** | 0.040 | 0.126*** | 0.121** | 0.073 |
| (0.015) | (0.017) | (0.019) | (0.029) | (0.036) | (0.046) | (0.040) | (0.051) | (0.059) | |
| −5.6% | −2.0% | −11.2% | 110.0% | 39.3% | 13.3% | 12.9% | 9.7% | 5.8% | |
| Illicit-T2 | 0.026 | 0.038 | 0.059* | −0.011 | 0.035 | 0.017 | −0.028 | −0.035 | −0.015 |
| (0.024) | (0.032) | (0.034) | (0.051) | (0.066) | (0.081) | (0.063) | (0.081) | (0.095) | |
| 10.4% | 15.2% | 23.6% | −7.9% | 11.7% | 5.7% | −2.9% | −2.8% | −1.2% | |
| Illicit-T3 | 0.003 | −0.011 | −0.012 | 0.123*** | 0.117* | 0.056 | 0.246*** | 0.282*** | 0.181** |
| (0.020) | (0.028) | (0.033) | (0.047) | (0.064) | (0.074) | (0.054) | (0.071) | (0.086) | |
| 1.2% | −4.4% | −4.8% | 87.9% | 39.0% | 18.7% | 25.1% | 22.6% | 14.5% | |
|
| |||||||||
| Year FE | YES | YES | YES | YES | YES | YES | YES | YES | YES |
| MFE | NO | NO | YES | NO | NO | YES | NO | NO | YES |
| N | 255,227 | 44,838 | 44,838 | 255,227 | 44,838 | 44,838 | 227,053 | 39,575 | 39,575 |
Footnotes
See https://www.guttmacher.org/state-policy/explore/substance-use-during-pregnancy for an up-to-date overview of policies related to substance during pregnancy
The same exclusion is not required for ICD-10 NAS cases, which would have been coded separately (P96.2).
The same exclusion is not required for ICD-10 NAS cases, which would have been coded separately (P96.2).
Results available upon request.
References
- Aizer Anna, Stroud Laura, and Buka Stephen. 2015. “Maternal Stress and Child Outcomes: Evidence from Siblings.” Journal of Human Resources 51(3):523–55. [DOI] [PMC free article] [PubMed] [Google Scholar]
- Almond Douglas, Currie Janet, and Duque Valentina. 2018. “Childhood Circumstances and Adult Outcomes: Act II.” Journal of Economic Literature 56:1360–1446. [Google Scholar]
- Alpert Abby E., Evans William N., Lieber Ethan M. J., and Powell David. 2019. “Origins of the Opioid Crisis and its Enduring Impacts.” NBER Worging Paper Series. [DOI] [PMC free article] [PubMed] [Google Scholar]
- Alpert Abby, Powell David, and Pacula Rosalie Liccardo. 2018. “Supply-Side Drug Policy in the Presence of Substitutes: Evidence from the Introduction of Abuse-Deterrent Opioids.” American Economic Journal: Economic Policy 10(4):1–35. [DOI] [PMC free article] [PubMed] [Google Scholar]
- Anon. 2017. Committee Opinion No. 711: Opioid Use and Opioid Use Disorder in Pregnancy. Vol. 130. [DOI] [PubMed] [Google Scholar]
- Arteaga Carolina and Barone Victoria. 2021. “The Opioid Epidemic : Causes and Consequences.” Working Paper. [Google Scholar]
- Atkins Danielle N. and Durrance Christine Piette. 2020. “State Policies That Treat Prenatal Substance Use as Child Abuse or Neglect Fail to Achieve Their Intended Goals.” Health Affairs 39(5):756–63. [DOI] [PubMed] [Google Scholar]
- Azuine Romuladus E., Ji Yuelong, Hsing Yuan Chang Yoona Kim, Ji Hongkai, Dibari Jessica, Hong Xiumei, Wang Guoying, Singh Gopal K., Pearson Colleen, Zuckerman Barry, Surkan Pamela J., and Wang Xiaobin. 2019. “Prenatal Risk Factors and Perinatal and Postnatal Outcomes Associated with Maternal Opioid Exposure in an Urban, Low-Income, Multiethnic US Population.” JAMA Network Open 2(6):1–14. [DOI] [PMC free article] [PubMed] [Google Scholar]
- Barker DJ 1995. “Fetal Origins of Coronary Heart Disease.” BMJ (Clinical Research Ed.) 311(6998):171–74. [DOI] [PMC free article] [PubMed] [Google Scholar]
- Bifulco Robert and Shybalkina Iuliia. 2022. “Fiscal Impacts of the Opioid Crisis on State and Local Governments: How Big?” The American Academy of Political and Social Science. [Google Scholar]
- Brogly Susan B., Velez Maria P., Werler Martha M., Li Wenbin, Camden Andi, and Guttmann Astrid. 2021. “Prenatal Opioid Analgesics and the Risk of Adverse Birth Outcomes.” Epidemiology 32(3):448–56. [DOI] [PMC free article] [PubMed] [Google Scholar]
- Brown Patricia, Thornton Katie, Ross Dan, Smith Jane, and Wimer Lynn. 2020. Technical Report on Lessons Learned in the Development of the Institute for Research on Poverty’s Wisconsin Administrative Data Core. [Google Scholar]
- Bruzelius Emilie, Levy Natalie S., Okuda Mayumi, Suglia Shakira F., and Martins Silvia S.. 2021. “Prescription Drug Monitoring and Child Maltreatment in the United States, 2004–2018.” The Journal of Pediatrics. [DOI] [PMC free article] [PubMed] [Google Scholar]
- Buckles Kasey, Evans William N., and Lieber Ethan M. J.. 2020. “THE DRUG CRISIS AND THE LIVING ARRANGEMENTS OF CHILDREN.” NBER Worging Paper Series. [DOI] [PubMed] [Google Scholar]
- Bullinger Lindsey Rose, Wang Vivian, and Feder Kenneth. 2022. “Effects of Opioid Treatment Programs on Child Well-Being.” The American Academy of Political and Social Science. [Google Scholar]
- Case Anne and Deaton Angus. 2017. “Mortality and Morbidity in the 21st Century.” Brookings Papers on Economic Activity 2017(Spring):397–476. [DOI] [PMC free article] [PubMed] [Google Scholar]
- Chapman Alexander. 2022. “The Dynamic Relationship Between the Opioid Crisis and Child Maltreatment Across Counties and Time in the United States 2007–2017.” The American Academy of Political and Social Science. [Google Scholar]
- Conradt Elisabeth, Crowell Sheila E., and Lester Barry M.. 2018. “Early Life Stress and Environmental Influences on the Neurodevelopment of Children with Prenatal Opioid Exposure.” Neurobiology of Stress 9(March):48–54. [DOI] [PMC free article] [PubMed] [Google Scholar]
- Corsi Daniel J., Hsu Helen, Fell Deshayne B., Wen Shi Wu, and Walker Mark. 2020. “Association of Maternal Opioid Use in Pregnancy with Adverse Perinatal Outcomes in Ontario, Canada, from 2012 to 2018.” JAMA Network Open 3(7):1–13. [DOI] [PMC free article] [PubMed] [Google Scholar]
- Currie Janet and Schwandt Hannes. 2021. “The Opioid Epidemic Was Not Caused by Economic Distress but by Factors That Could Be More Rapidly Addressed.” Annals of the American Academy of Political and Social Science 695(1):276–91. [Google Scholar]
- Desai Rishi J., Huybrechts Krista F., Sonia Hernandez-Diaz Helen Mogun, Patorno Elisabetta, Kaltenbach Karol, Kerzner Leslie S., and Bateman Brian T.. 2015. “Exposure to Prescription Opioid Analgesics in Utero and Risk of Neonatal Abstinence Syndrome: Population Based Cohort Study.” BMJ (Clinical Research Ed.) 350:h2102. [DOI] [PMC free article] [PubMed] [Google Scholar]
- Doctor Jason N., Nguyen Andy, Lev Roneet, Lucas Jonathan, Knight Tara, Zhao Henu, and Menchine Michael. 2018. “Opioid Prescribing Decreases after Learning of a Patient’s Fatal Overdose.” Science 361(6402):588–90. [DOI] [PubMed] [Google Scholar]
- Evans Mary F., Harris Matthew, and Kessler Lawrence. 2020. “The Hazards of Unwinding the Prescription Opioid Epidemic: Implications for Child Abuse and Neglect.” American Economic Review. [Google Scholar]
- Gihleb Rania, Giuntella Osea, and Zhang Ning. 2018. The Effects of Mandatory Prescription Drug Monitoring Programs on Foster Care Admissions.
- Gihleb Rania, Giuntella Osea, and Zhang Ning. 2020. “Prescription Drug Monitoring Programs and Neonatal Outcomes.” Regional Science and Urban Economics 81(December 2018):103497. [Google Scholar]
- Hirai Ashley H., Ko Jean Y., Owens Pamela L., Stocks Carol, and Patrick Stephen W.. 2021. “Neonatal Abstinence Syndrome and Maternal Opioid-Related Diagnoses in the US, 2010–2017.” JAMA - Journal of the American Medical Association 325(2):146–55. [DOI] [PMC free article] [PubMed] [Google Scholar]
- Jantzie Lauren L., Maxwell Jessie R., Newville Jessie C., Yellowhair Tracylyn R., Kitase Yuma, Madurai Nethra, Ramachandra Sindhu, Bakhireva Ludmila N., Northington Frances J., Gerner Gwendolyn, Tekes Aylin, Milio Lorraine A., Brigman Jonathan L., Robinson Shenandoah, and Allan Andrea. 2020. “Prenatal Opioid Exposure: The next Neonatal Neuroinflammatory Disease.” Brain, Behavior, and Immunity 84(October 2019):45–58. [DOI] [PMC free article] [PubMed] [Google Scholar]
- Ko Jean Y., D’Angelo Denise V., Haight Sarah C., Morrow Brian, Cox Shanna, von Essen Beatriz Salvesen, Strahan Andrea E., Harrison Leslie, Tevendale Heather D., Warner Lee, Kroelinger Charlan D., and Barfield Wanda D.. 2020. “ Vital Signs: Prescription Opioid Pain Reliever Use During Pregnancy — 34 U.S. Jurisdictions, 2019.” MMWR. Morbidity and Mortality Weekly Report 69(28):897–903. [DOI] [PMC free article] [PubMed] [Google Scholar]
- Maclean Johanna Catherine, Mallatt Justine, Ruhm Christopher J., and Simon Kosali. 2021. “ECONOMIC STUDIES ON THE OPIOID CRISIS: A REVIEW.” NBER Working Paper Series. [Google Scholar]
- Monnat Shannon M. 2022. “Sociodemographic and Geographic Variation in Drug Overdose Rates in the United States.” The American Academy of Political and Social Science. [DOI] [PMC free article] [PubMed] [Google Scholar]
- Nilsson J Peter. 2017. “Alcohol Availability, Prenatal Conditions, and Long-Term Economic Outcomes.” Journal of Political Economy 125(4):1149–1207. [Google Scholar]
- Nørgaard Mette, Nielsson Malene Schou, and Heide-Jørgensen Uffe. 2015. “Birth and Neonatal Outcomes Following Opioid Use in Pregnancy: A Danish Population-Based Study.” Substance Abuse: Research and Treatment 9:5–11. [DOI] [PMC free article] [PubMed] [Google Scholar]
- Nygaard Egil, Moe Vibeke, Slinning Kari, and Walhovd Kristine B.. 2015. “Longitudinal Cognitive Development of Children Born to Mothers with Opioid and Polysubstance Use.” Pediatric Research 78(3):330–35. [DOI] [PMC free article] [PubMed] [Google Scholar]
- Nygaard Egil, Slinning Kari, Moe Vibeke, Fjell Anders, and Walhovd Kristine B.. 2020. “Mental Health in Youth Prenatally Exposed to Opioids and Poly-Drugs and Raised in Permanent Foster/Adoptive Homes: A Prospective Longitudinal Study.” Early Human Development 140(October 2019):104910. [DOI] [PubMed] [Google Scholar]
- Odegaard Katherine E., Pendyala Gurudutt, and Yelamanchili Sowmya V.. 2021. “Generational Effects of Opioid Exposure.” Encyclopedia 1(1):99–114. [DOI] [PMC free article] [PubMed] [Google Scholar]
- Persson Petra and Rossin-Slater Maya. 2018. “Family Ruptures, Stress, and the Mental Health of the next Generation.” American Economic Review 108(4–5):1253–55. [PubMed] [Google Scholar]
- Powell David. 2021. “The Labor Supply Consequences of the Opioid Crisis.” SSRN Electronic Journal (June). [Google Scholar]
- Reddy Uma M., Davis Jonathan M., Ren Zhaoxia, and Greene Michael F.. 2017. Opioid Use in Pregnancy, Neonatal Abstinence Syndrome, and Childhood Outcomes: Executive Summary of a Joint Workshop by the Eunice Kennedy Shriver National Institute of Child Health and Human Development, American College of Obstetricians and Gynecologist. Vol. 72. [DOI] [PMC free article] [PubMed] [Google Scholar]
- Rosales-Rueda Maria Fernanda. 2014. “Family Investment Responses to Childhood Health Conditions: Intrafamily Allocation of Resources.” Journal of Health Economics 37(1):41–57. [DOI] [PubMed] [Google Scholar]
- Ruhm Christopher J. 2019. “Drivers of the Fatal Drug Epidemic.” Journal of Health Economics 64:25–42. [DOI] [PubMed] [Google Scholar]
- Schlagal Caitlin R., Dunn Tiffany J., Xu Pei, Felsing Daniel E., Merritt Christina R., Manja Sanjana, Fox Robert G., Buffington Shelly A., Saade George, Dineley Kelly T., Yu Yongjia, Cunningham Kathryn A., and Wu Ping. 2021. “Maternal Opioid Exposure Culminates in Perturbed Murine Neurodevelopment and Hyperactive Phenotype in Adolescence.” Neuroscience 463:272–87. [DOI] [PMC free article] [PubMed] [Google Scholar]
- Schnell Molly and Currie Janet. 2018. “Addressing the Opioid Epidemic: Is There a Role for Physician Education?” American Journal of Health Economics 4(3):383–410. [DOI] [PMC free article] [PubMed] [Google Scholar]
- Vivolo-Kantor Alana M., Seth Puja, Gladden R. Matthew, Mattson Christine L., Baldwin Grant T., Kite-Powell Aaron, and Coletta Michael A.. 2018. “Vital Signs : Trends in Emergency Department Visits for Suspected Opioid Overdoses — United States, July 2016–September 2017.” MMWR. Morbidity and Mortality Weekly Report 67(9):279–85. [DOI] [PMC free article] [PubMed] [Google Scholar]
- Ziedan Engy and Kaestner Robert. 2020. “Effect of Prescription Opioids and Prescription Opioid Control Policies on Infant Health.” NBER Working Paper 53(9):1689–99. [Google Scholar]