

Abstract
Unconscious acquisition of sequence structure from experienced events can lead to explicit awareness of the pattern through extended practice. Although the implicit-to-explicit transition has been extensively studied in humans using the serial reaction time (SRT) task, the subtle neural activity supporting this transition remains unclear. Here, we investigated whether frequency-specific neural signal transfer contributes to this transition. A total of 208 participants (107 females) learned a sequence pattern through a multisession SRT task, allowing us to observe the transitions. Session-by-session measures of participants’ awareness for sequence knowledge were conducted during the SRT task to identify the session when the transition occurred. By analyzing time course RT data using switchpoint modeling, we identified an increase in learning benefit specifically at the transition session. Electroencephalogram (EEG)/magnetoencephalogram (MEG) recordings revealed increased theta power in parietal (precuneus) regions one session before the transition (pretransition) and a prefrontal (superior frontal gyrus; SFG) one at the transition session. Phase transfer entropy (PTE) analysis confirmed that directional theta transfer from precuneus → SFG occurred at the pretransition session and its strength positively predicted learning improvement at the subsequent transition session. Furthermore, repetitive transcranial magnetic stimulation (TMS) modulated precuneus theta power and altered transfer strength from precuneus to SFG, resulting in changes in both transition rate and learning benefit at that specific point of transition. Our brain-stimulation evidence supports a role for parietal → prefrontal theta signal transfer in igniting conscious awareness of implicitly acquired knowledge.
SIGNIFICANCE STATEMENT There exists a pervasive phenomenon wherein individuals unconsciously acquire sequence patterns from their environment, gradually becoming aware of the underlying regularities through repeated practice. While previous studies have established the robustness of this implicit-to-explicit transition in humans, the refined neural mechanisms facilitating conscious access to implicit knowledge remain poorly understood. Here, we demonstrate that prefrontal activity, known to be crucial for conscious awareness, is triggered by neural signal transfer originating from the posterior brain region, specifically the precuneus. By employing brain stimulation techniques, we establish a causal link between neural signal transfer and the occurrence of awareness. Our findings unveil a mechanism by which implicit knowledge becomes consciously accessible in human cognition.
Keywords: brain signal transfer, conscious awareness, phase transfer entropy, sequence learning, theta oscillation
Introduction
Acquiring the order of events helps people adapt to future occurrences (Nobre and Van Ede, 2018). Research on implicit learning shows that individuals can react faster to regular sequences than random ones, even without awareness of the pattern (Monroy et al., 2019). With prolonged learning, learners can develop conscious awareness of sequence knowledge, indicating an implicit-to-explicit transition (Lustig et al., 2022). Investigating brain mechanisms underlying this transition is essential for understanding human consciousness (Esser et al., 2022); however, these mechanisms still remain elusive.
One challenge to capturing neural characteristics of the transition is to pinpoint its occurrence. The serial reaction time (SRT) task is a useful paradigm for observing sequence learning and detecting the transition, as a rapid RT reduction serves as a potential localizer of transition (Rose et al., 2010; Wessel et al., 2012). In previous SRT studies, participants were classified as either transition or nontransition learners based on their postlearning verbal reports regarding the sequence. Analyses of RT timelines revealed that transition learners exhibited a steep drop in RTs to sequential stimuli; in contrast, nontransition learners did not show such an RT drop. However, relying solely on postexperiment verbal tests limits the testability of whether this RT drop synchronizes with the transition onset. So, we used an awareness measure after each session to pinpoint the juncture when the transition happened and adopted an RT switchpoint (drop) modeling (Spaak and de Lange, 2020) to examine the synchrony between the switchpoint and transition.
Neural evidence from sequence learning demonstrated that the prefrontal cortex (PFC) is essential for explicit knowledge acquisition but not necessary for implicit learning, suggesting a role in awareness of knowledge during learning (Gobel et al., 2011; Janacsek et al., 2020). However, bilateral PFC transcranial magnetic stimulation (TMS) failed to modulate awareness emergence or RT acceleration in the SRT task (Prutean et al., 2021). One plausible explanation is that the PFC activation is not locally initiated but rather induced through interplays with other regions (Seth and Bayne, 2022). Evidence from nonhuman primates indicates that PFC activation is a hallmark for awareness onset in response to near-threshold perceptual stimuli, and, notably, this activation is prompted by signals from posterior regions such as the parietal cortex (Van Vugt et al., 2018). We proposed that a similar mechanism of forward signal transfer probably exists for the transition.
The precuneus exhibits differential involvement in implicit and explicit learning (Janacsek et al., 2020) and is proposed to function as a memory buffer for acquired knowledge (Oishi et al., 2005). Our focus on the precuneus stems from three distinct characteristics of its activation: an increase during the intermediate phase of learning preceding PFC activation (Sakai et al., 1998), a prediction on scores in postlearning explicit tests (van der Graaf et al., 2006), and a correlation with the extent of RT decline resembling a switchpoint during learning (Oishi et al., 2005). Resting-state imaging demonstrates that the precuneus transmits abundant information to the PFC within the default network (Cavanna and Trimble, 2006). Based on this evidence, we infer a precuneus→PFC signal transfer underlying the transition.
The transferring of neural information between regions is manifested as traveling waves characterized by specific frequencies (Muller et al., 2018). Theta (4–7 Hz) oscillations are associated with new knowledge formation and are considered a neuropsychological marker of learning (Rozengurt et al., 2016; Köster et al., 2019). Enhanced theta activity has been observed during implicit learning tasks (Loonis et al., 2017; Meissner et al., 2018). Successful modulation of learning benefits (RT reduction) was achieved by applying repetitive TMS on parietal theta power (Whybird et al., 2021). Importantly, ∼5-Hz prefrontal theta oscillation has been linked to explicit awareness development across various contexts [such as visual awareness (Hobot et al., 2023), conscious episodic retrieval (Klimesch et al., 2001), and subliminal versus conscious conflicts (Giller et al., 2020)]. Therefore, we focused precuneus → prefrontal signal transmission into the theta band.
We employed phase transfer entropy (PTE; Lobier et al., 2014) to measure the theta signal transfer. We found that theta (∼5 Hz) transfer of precuneus → PFC specifically occurred at the pretransition (N−1th) session and predicted the learning benefit at the transition (Nth) session. Transfer strength was modulated by using precuneus rTMS at theta band, thereby influencing both the learners’ transition rate and the learning benefit. We suggested a mechanism of parietal → prefrontal signal transfer that ignites the awareness of sequence knowledge during learning.
Materials and Methods
Participants
A total of 208 participants (107 females) were recruited, including 78 (42 females; mean age = 21.54 years, SD = 2.57 years) in experiment 1, 34 (17 females; mean age = 22.03 years, SD = 1.81 years) in experiment 2, 40 (20 females; mean age = 22.63 years, SD = 2.65 years) in experiment 3, and 56 (28 females; mean age = 21.56 years, SD = 2.76 years) in experiment 4. All of them had normal or corrected-to-normal vision, were right-handed, and reported no history of neurologic disease or taking psychotropic drugs. All participants signed the informed consent before the experiment and received remuneration for participation. This study was approved by the Committee on Human Research Protection of East China Normal University.
The sample size was decided before executing experiments. One previous literature reported an SRT effect size ηp2 = 0.68 (N = 153) for learning a five-stimulus sequence and setting nine sessions each with 120 trials (Kaufman et al., 2010). Based on this effect size, prior power analysis yielded a sample size more than or equal to nine participants to reach α ≤ 0.05 and power ≥ 0.95 using within-subject repeated-measures ANOVA (G*Power 3.1.9.2; Faul et al., 2007). We doubled this minimal sample size up to ≥18 participants per group, given that previous implicit-to-explicit transition studies had revealed a ∼50% transition rate across participants (Esser and Haider, 2017).
Data exclusion
All participants took a brief interview at the end of the experiment to ask whether they possessed knowledge about implicit learning before this participation. One participant in experiment 2 was excluded because of prior participation in other implicit learning studies; the rest of them had not participated in any previous implicit learning experiment and were naive to the existence of a sequential rule in the task. In experiment 4, one participant in the rTMS-intensive group was excluded because of stimulator fault, and one participant’s electroencephalogram (EEG) data in the rTMS-suppressive group was excluded because of recording failure.
Experimental design
Figure 1 depicts the experimental design. We adopted a verbal measure on the awareness of sequence knowledge, used session by session during the SRT task (Fig. 1a). We opted for this measure because the conventional awareness measures, such as the inclusion/exclusion test or the structural knowledge test, may inevitably inform the existence of rules in the task and are thus more appropriate for postlearning test. As our session-by-session measure has not been used extensively in prior studies, we examined whether its discrimination on explicit knowledge owners versus nonexplicit knowledge owners was consistent with the after-learning scores. For postlearning assessment, we employed the structural knowledge test, a routine postlearning awareness measure for sequence learning (as used in Dienes and Scott, 2005; Guo et al., 2013; Paciorek and Williams, 2015; Jurchiş and Opre, 2016; Fu et al., 2018; Ivanchei and Moroshkina, 2018; Qiao et al., 2018; Norman et al., 2019; Neil and Higham, 2020; Waroquier et al., 2020; Zhang and Liu, 2021). This test enabled us to repeatedly measure the responses (10 repetitions) to every pair of stimuli (i.e., two-stimulus chunk: “1–5,” “5–3,” “3–2,” “2–4,” and “4–1”) within a learnable sequence (position sequence “1–5–3–2–4”) for each participant and evaluate the specific cognitive basis underlying recognition of regular versus random sequences, including Guess, Intuition, Memory, or Rule.
Figure 1.

Diagram of experimental design. a, Scheme of detecting transition (Nth) using session-by-session awareness measure during nine-session serial reaction time (SRT) task. b–d, Scheme of design in experiments 1–4.
The design of experiment 1 employed a cross-sectional approach (Fig. 1b) to prevent the disclosure of sequence rules to participants caused by administering a structural knowledge test. We randomly assigned 20 participants (10 females; mean age = 21.40, SD = 2.76) to learn one session SRT task, 22 (10 males; mean age = 20.95, SD = 2.54) to learn two sessions, 18 (8 males; mean age = 22.67, SD = 2.72) to learn eight sessions, and 18 (7 males; mean age = 21.28, SD = 2.05) to learn nine sessions each with identical sequence pattern and same number of sequence repetitions. The use of extreme groups as settings enables the postlearning scores to reveal whether implicit sequence learning occurred in the initial sessions and whether explicit knowledge was formed in the final sessions, to reflect an emergence of implicit-explicit transition. By linking detections of explicit knowledge between session-by-session measures and structural knowledge tests, we demonstrated the consistency between these two awareness measures used as evidence for validity of our session-wise awareness measure.
Experiment 2 and experiment 3 explored neural changes underlying the transition using EEG and magnetoencephalogram (MEG), respectively (Fig. 1c). We employed a within-subject design of sequence type (regular vs random) × session (1st–9th). The 34 participants in experiment 2 and 40 participants in experiment 3 completed a nine-session learning while being measured for awareness after each session. EEG analysis in experiment 2 revealed a parietal → frontal theta signal transfer underlying the transition. This prompts us to conduct an additional MEG experiment (experiment 3) for improved source-space localization through co-registration with MRI and to measure theta signal transfers on the cortex.
Experiment 4 aimed to test the causal link between the theta signal transfer and the transition (Fig. 1d). We leveraged rTMS to modulate the theta oscillation at the signal efferent area identified in experiment 3. A mixed design of sequence type (regular vs random) × session (1st–9th) × rTMS group (intensive vs suppressive) was employed, with 28 participants randomly assigned to the intensive-rTMS group (14 males; mean age = 21.36, SD = 2.72) and another 28 to the suppressive-rTMS group (14 males; mean age = 21.75, SD = 2.80). Both groups completed the same nine-session SRT task, with rTMS delivered for 30 s before each session to either enhance or inhibit theta power according to their respective groups. EEG data were recorded throughout the task for both groups to estimate theta power and theta signal transfer, as EEG is well-suited for use alongside rTMS. By comparing intensive versus suppressive rTMS groups as a mutual control, we tested whether rTMS exerted an effect on theta signal transfer and whether this induced differences in transition rate or learning benefit between groups.
Materials and procedure
Serial reaction time task
Participants were seated ∼ 0.7 m far from the screen (resolution = 1024 × 768, refresh rate = 60 Hz). Participants were instructed to put five fingers on buttons in a one-to-one correspondence manner. Each trial began with the presentation of a cross fixation for 500 ms, followed by the exposure of a dot (diameter = 0.3 cm, visual angle ≈ 0.25°) within one of the five circles (Fig. 2a). These circles were arranged horizontally from left to right as positions 1–5. Each circle had a diameter of 1.2 cm (∼0.98°), and collectively occupied a horizontal space of ∼7 cm (∼5.72°). Participants responded by pressing the corresponding button aligned with the position where the dot appeared. The dot remained visible for up to 1 s but disappeared immediately on button press regardless of whether this response was correct or incorrect. Afterward, a blank screen was presented for an unpredictable duration ranging between 500 and 800 ms before the next trial commenced. Before formal task, all participants had to completed practice trials consisting of nine random sequences (45 stimuli) until achieving an accuracy above 90% to pass. During each session in the formal task, participants conducted serial reactions for 60 stimuli including nine regular sequences (45 stimuli) and three random sequences (15 stimuli; see Fig. 2b for detailed condition order). The regular sequence adhered a pattern: position sequence “1–5–3–2–4.” A random sequence could be any other combination composed of five nonrepeated positions such as “2–1–4–3–5” or “1–3–4–5–2,” etc. To counterbalance initial positions in regular sequences, each starting position (e.g., “1–5–3–2–4,” “2–4–1–5–3,” “3–2–4–1–5”) occurred with equal probability (∼16 times or 20%) across sessions.
Figure 2.

Illustrations of trial structure in behavioral tasks. a, An example of event sequence in two successive trials in the SRT task. b, Order of regular and random sequences in nine-session SRT task. c, One example trial in the structural knowledge test.
Session-by-session awareness measure
A verbal awareness measure was conducted straight after every single session using a two-step procedure. First, a postsession interview was conducted by the experimenter, consisting of a uniform question “What do you feel about the session you just performed? This is an open-ended question. Any feelings are meaningful and need to be reported.” Moreover, the experimenter would confirm with the participant that all intended content has been reported. Such a formulation was found to exert no influence on subsequent learning (Seidler et al., 2005; Schuck et al., 2015).
Upon completion of the first-step interview, the experimenter would promptly classify the verbal reports into “sequence knowledge” and “nonsequence knowledge.” “Nonsequence knowledge” refers to the answers that do not contain information about the sequence, rules, order, pattern, regularity, succession, or position of the stimuli or keystrokes. For example, participants reported “I feel like I am reacting faster than before,” or “I believe I inadvertently pressed the incorrect button a few times.” Such sequence-irrelevant reporting would terminate the verbal measure at this step.
The other category “sequence knowledge” pertains to the mention of relevant information about the sequence, rules, order, pattern, regularity, succession, or position of stimuli or keystrokes, as exemplified by “I found the dot positions were regular,” or “I felt the order of the dots.” If participants gave any relevant response at whichever session, the second-step measure would follow-up. A Yes/No question “Did you mean there were rules for dot presentation?” would be posed to verify participants’ sequence knowledge. In case of a “Yes” response, participants were asked to try to describe the rules. Participants were allowed to report fragmentary sequence chunks in this step, such as “the first position was followed by the fifth position,” “the fifth position was followed by the third position,” etc. A “No” response would terminate the measure.
An SRT session would be identified as the transition session (Nth) for a given participant if the Nth measure showed the first occurrence of sequence knowledge awareness. To determine the presence of awareness at each measure, we applied a criterion on the accuracy of sequence description which necessitates correct reporting of at least three out of five chunks (1–5, 5–3, 3–2, 2–4, and 4–1).
Our decision to employ the 3/5 criterion was made by Bayes factor (BF) inference. This Bayes factor calculation used a Bernoulli likelihood and modeled alternative hypothesis (H1) as a Beta distribution (Dienes, 2015). There were five Bernoulli trials corresponding to five correct dual-stimulus chunks. Setting the Beta coefficients for modeling H1 as a = 8 (hypothetical successes) and b = 5 (hypothetical failures) gives mean = 0.625, SD = 0.19 for the distribution of H1, namely, a distribution with plausible H1 values lying between roughly 0.25 and close to 1. Given that the probability of correct guessing equals 0.25 (with no repeated positions allowed in the regularity), any three successes out of five trials (chunks) yield a B = 3.31 in favor of H1 over null hypothesis (H0), supporting the state of explicitly knowing the regularity.
This criterion also meets the conventional method of inferential statistics. The probability of a given subject getting a correct answer using perfect guess is p = 0.25, and the probability of giving a wrong answer is q = 0.75 (as two adjacent positions do not repeat), which conforms to the binomial distribution. The probabilities for zero to five correct answers are 0.237, 0.396, 0.264, 0.088, 0.015, and 0.001, respectively. One can know that three out of five correct answers yield a left-side p = 98.44%, at a > 95% confidence level, which supports that the subject does not respond based on blind guess (H0) but has explicit sequence knowledge (H1).
Structural knowledge test
A total of 100 trials were conducted (Fig. 2c). Fifty trials presented a dual-stimulus chunk following the regularity in the SRT task (i.e., 1–5, 5–3, 3–2, 2–4, or 4–1) and the other 50 trials presented random chunks (e.g., 1–3, 4–2, or 2–5). During each trial, participants received either a regular or random chunk and then determined whether this chunk conformed to the regularity in the SRT task. Afterward, they had to select one out of four different attributions, Guess, Intuition, Memory, and Rule, indicating which one served as the basis for their conformable-or-not classification. Definitions of each attribution were displayed on-screen throughout the test: Guess, “there is no any basis for the judgment, just like tossing a coin”; Intuition, “there somewhat is a confidence that the judgment is right to a certain extent, but having no idea why it is right”; Memory, “giving the judgment because you remembered that the two positions where these two dots successively occurred had happened in previous reaction task”; Rule, “giving the judgment because you have found the positions where the dots successively occurred followed a specific rule that you can tell explicitly.” Choosing either guess or intuition represents an implicit state of structural knowledge while opting for memory or rule represents its explicit state.
Data recording and preprocessing
EEG
In experiments 2 and 4, EEG date were recorded using a 64-channel 10–20 system device (GmbH Amplifier, Brain Products) and a TMS-compatible 64-channel device (Eego Mylab, ANT Neuro), respectively. The sampling rate for both experiments were set at 1 kHz with a recording bandpass of 0.01–100 Hz. The ground electrode was AFz. HEOG electrode was placed at ∼1 cm to the outer canthus of the left eye. VEOG was placed at ∼1 cm beneath the right eye. EEG electrodes were online-referenced to FCz. Impedances were kept below 5kΩ.
EEG preprocessing was performed using the EEGLAB toolbox (Delorme and Makeig, 2004). Raw EEG signals were re-referenced to the average scalp potential (Tsuchimoto et al., 2021). A bandpass filter of 1–30 Hz was used to emphasize theta oscillations of interest (Thönes et al., 2021). The data were segmented into a time window of −200–1200 ms relative to the stimuli (dot) onset, with a baseline correction of 200 ms before stimuli presentation. Independent component analysis (ICA) was performed, and artifact components were identified and removed using MARA diagnosis. On average, there were 5.18/64 and 9.58/63 artifact components removed per subject in experiments 2 and 4, respectively. Epochs exceeding ± 100 μV were rejected, resulting in 556.44/580 and 538.93/580 artifact-free epochs per subject for experiments 2 and 4, respectively.
MEG
In experiment 3, MEG data were recorded using a 306-channel whole-head system (Elekta-Neuromag) with a sampling rate = 1 kHz. The standard protocol (Gross et al., 2013) was followed for our MEG acquisition. Head position was localized at the beginning of each session using four head position indicator coils, and the displacements were kept below 5 mm. Three landmarks (nasion and bilateral preauricular) and ∼200 points on the head shape grid were digitized. EOG electrodes were attached above the right and below the left eye, respectively. Participants were instructed to avoid any unnecessary movements during recordings. Empty-room data collection lasted at least 120 s to estimate environmental noises.
Temporal signal space separation (tSSS) was initially executed on raw MEG data. Subsequent preprocessing steps were performed using the Brainstorm toolbox (Tadel et al., 2011). ICA was separately conducted on magnetometer (MAG) and gradiometer (GRAD) sensor data, resulting in the identification of the top 30 independent components highly correlated with EOG activity. Artifact components associated with blinks, eye movements, and cardiac signals were discarded. On average, 2.25 MAG components and 2.18 GRAD components were removed at this step. Additionally, a spectrum auto-detection method was employed to identify intervals containing eye movements, body movements, dental work artifacts (in the frequency range of 1–7 Hz), as well as muscle noise and sensor artifacts (in the frequency range of 40–240 Hz). These marked intervals were subsequently rejected from further analysis. The remaining artifact-free trials accounted for an average retention rate of 93.33%. Finally, a low-pass filter at 30 Hz was applied to the data which were then segmented into −200–1200 ms.
Structural MRI
Structure brain imaging data were acquired in experiment 3 for MEG co-registration and in experiment 4 for TMS neuronavigation. A Siemens Prisma 3T MR scanner with a 64-channel head-neck coil was used. The high-resolution anatomic scan was obtained using a 3D magnetization-prepared rapid gradient-echo (MPRAGE) T1-weighted sequence [192 continuously sagittal slices, repetition time (TR) = 2530 ms, echo time (TE) = 2.98 ms, inversion time (TI) = 1100 ms, flip angle (FA) = 7°, bandwidth = 240 Hz/pixel, Field-of-view (FOV) = 256 mm (feet–head, FH) × 224 mm (anterior–posterior, AP), matrix = 256 × 224, slice thickness = 1 mm, voxel size = 1 × 1 × 1 mm, isotropic, interpolated to 0.5 × 0.5 × 1 mm, and the time of acquisition = 5 min 58 s]. Distortion in structural images was corrected using Siemens Syngo software.
rTMS
Before each session in experiment 4, participants received a 30-s continuous rTMS (150 pluses) targeting the bilateral precuneus. The rTMS was administered using Visor 2TM ST system (ANT Neuro) and a liquid-cooled figure-of-eight TMS coil. Resting motor threshold (MT) for each participant was measured before the experiment following a standard procedure (Stubbeman et al., 2018). Two electromyography electrodes were attached to the first dorsal interosseous (FDI) muscle of the right hand, and a ground electrode was placed on the right-hand carpal bone. Single-pulse bipolar (1 Hz) TMS was applied to the motor cortex of the right thumb at 45° angle from anterior-posterior axis. MT was defined as minimal TMS intensity that evoked >50 μV FDI motor potential in at least five out of 10 stimulations, following previous studies (Laakso et al., 2018; Stubbeman et al., 2018). In our study, rTMS intensity was set at 1.25 times MT (Cotovio et al., 2021). On average, rTMS intensity across participants corresponded to 54.15% (SD = 5.82%) of maximum output of the stimulator.
The placement of TMS coil during the experiment was guided by neuronavigation. Three head landmarks (the nasion, left, and right preauricular) were used for co-registration along with over 200 digitalized head-shape points. These digitalized points were evenly dispersed across the scalp with a mean gap to the scalp <3 mm. The TMS coil was positioned to target participants’ bilateral precuneus in a −90° direction based on their own structural imaging. The translational and rotational waggles of the TMS coil were controlled to <2 mm and <2°, respectively. For rTMS-intensive group participants, 150 TMS pulses were delivered as unipolar at10 Hz of half sine. In contrast, rTMS-suppressive group participants received 150 bipolar pulses at 5 Hz of sine. The duration of each rTMS session (150 pulses) was maintained for 30 s in both groups. This stimulation scheme was previously validated and shown to have a persistent effect lasting over 10 min (Albouy et al., 2017; Rachid, 2017), which transcends the individual SRT session duration of 2.3 min.
Analysis
Postlearning awareness measure
Recognition accuracy for Guess, Intuition, Memory, and Rule was calculated separately. To adjust the bias on chance performance when there were very few or no choices attributed to a specific category (Guess, Intuition, Memory, or Rule), we applied a correction formula: (Nc + 0.5)/(N + 1), where Nc represents the number of correct responses and N is the total number of responses (Dienes and Scott, 2005). This correction provides an adjusted accuracy corresponding to chance level when N approaches zero.
In addition to the accuracy, we assessed the proportion of Nc under each category out of total Nc as an indicator of knowledge allocation toward Guess, Intuition, Memory, or Rule categories. One-way ANOVA was performed to examine group differences in both recognition accuracy and knowledge proportion.
Receiver operating characteristic (ROC) curve
The ROC was used to evaluate the consistency of transition versus nontransition classification made by two tests, session-by-session awareness measures and the postlearning structural knowledge test, for all 78 participants who underwent one, two, eight, or nine sessions in experiment 1. Each participant had nine scores: one from session-by-session measure during learning (transition or nontransition), the eight postlearning scores that included recognition accuracy and knowledge proportion of Guess, Intuition, Memory, and Rule outputted by structural knowledge test.
A ROC curve was plotted to determine the extent of overlap between these two test results overlap (Bamber, 1975). Specifically, we plotted ROC curves for verbal awareness measures referencing each category’s accuracy or proportion. Based on an arbitrary classification criterion that drifts within the distribution of a given score type according to signal detection theory (Green and Swets, 1974), each participant was classified as either transition (above-criterion) or nontransition (below-criterion) using two tests. We then calculated a hit rate (ratio of participants detected by verbal measure over those detected by postlearning test) and a false-alarm rate (ratio of participants detected by verbal measure over those missed by postlearning test). After applying a total of 30 different criteria, we obtained 30 pairs of hit and false-alarm rates to plot the curve. Finally, we estimated the area under the ROC curve (AUC). The ROC analysis was performed using the R pROC package (https://cran.r-project.org/web/packages/pROC/index.html).
Switchpoint model fit
We conducted a Bayesian model (PyMC3 library for Python; Salvatier et al., 2016) to analyze participants who underwent an implicit-to-explicit transition. This modeling approach has been previously used to investigate the sudden increase in learning benefit (Spaak and de Lange, 2020). To test whether there was a switchpoint of learning benefit at the transition session, we considered three models: the no switchpoint model assumed that was no switchpoint throughout the task; the transition switchpoint model assumed that there was a switchpoint precisely at the transition (Nth) session; nontransition switchpoint models assumed that a switchpoint occurred at any one of all the nontransition (non-Nth) sessions, including eight possible locations (1st,…N−1th, N+1th,…9th), excluding Nth. A better fit of transition switchpoint model over both no switchpoint and nontransition switchpoint models demonstrated a switchpoint at the transition session.
When modeling, the log-transformed and linear-detrended RTs were fitted as drawn from a normal distribution with given SD ( ) and mean ( ) according to the individual participant’s RT sample. Specifically, the log-RT for an individual trial y with index k was modeled as follows:
Where, and are sample mean and sample SD of log-RTs, respectively. denoted the log-RT differences between regular and random trials, namely, learning scores.
The no switchpoint model, in which was constant across all sessions, was defined as follows:
For the transition switchpoint model, the before and after the transition session were sampled from independent distributions. This model included an extra parameter N, which refers to the actual Nth session of a given individual:
The nontransition switchpoint model was the same as the model 2, except that parameter N refers to all possible non-Nth sessions, generating eight fit scores for individual participant.
At practice, we used Markov Chain Monte Carlo (MCMC) with a Metropolis–Hastings sampling scheme to obtain posterior estimates for the unknown variables in models. For each model, there were four chains each with 40,000 samples. The first half of samples were discarded for reliability, and only every fifth sample of the remaining was used with the goal of reducing autocorrelation. The Watanabe–Akaike Information Criterion (WAIC; Watanabe, 2010) was computed as an index for fit. Since describing a switchpoint necessitates RT samples before and after it, we restricted our analyses to subjects who exhibited the transition within sessions 3–7 (n = 13, 18, 22, and 17 in experiments 1–4, respectively; these sample sizes yielded post hoc powers ≥ 0.97). For comparing model fits, we transformed WAICs into z-scores within each subject (Spaak and de Lange, 2020). To obtain unbiased significance of pairwise tests such as transition versus nontransition models comparison, we performed a permutation test with 10,000 iterations. In the text, we reported the median of WAIC z-scores across participants. Both uncorrected and Bonferroni-corrected p values were reported.
Source computation
We used minimal-norm estimation (MNE) to trace MEG data in experiment 3 to the cortex (Ou et al., 2009). Participants’ MEG data were co-registered with their own 3D-reconstruction MRI (reconstruction generated using FreeSurfer package; Dale et al., 1999). We computed an overlapping sphere head model containing 15,002 vertices for each participant. Noise covariance matrix was computed using >120-s empty-room noise data; data covariance matrix was derived from the MEG signals across all trials and sessions. After that, unconstrained sources were estimated over the entire cortex for each trial × session combination using both MAG and GRAD sensors via MNE (default parameters: depth weighting = 0.5, regularize noise covariance = 0.1, signal-to-noise ratio = 3). Individual source maps were projected onto ICBM152 Nonlinear atlases (Fonov et al., 2011) and smoothed spatially with full-width-with-half-maximum (FWHM) Gaussian kernel = 3 mm.
Source computation for EEG data in experiment 4 followed the same procedure as that for MEG, with adjustments made to ensure applicability. Specifically, a default head model was created across participants using OpenMEEG (Gramfort et al., 2010), and noise covariance was computed from 200 ms prestimulus baseline of all trials across sessions.
Time-frequency analysis
We applied Morlet wavelet (Bertrand and Tallon-Baudry, 2000) to transform EEG or MEG activity into a time-frequency representation. Within each trial per session, we decomposed neural oscillations into 1–30 Hz (step = 1 Hz; central frequency = 1 Hz; time resolution FWHM = 3 s) for a time window of −200–1200 ms. Afterward, trial-wise time-frequency maps were averaged according to trial × session condition combinations. Baseline was corrected by event-related perturbation which transforms unit μV2 into power change (%) against baseline (Pfurtscheller and Lopes da Silva, 1999).
ROI selection
Our neural analyses were conducted on five types of sessions in relation to the transition session: the first (1st), the pretransition (N−1th), the transition (Nth), the posttransition (N+1th), and the last (9th) session, as these maintain consistent meaning across participants. Regions of interest (ROIs) were defined by comparing stimulus-evoked oscillatory activity with baseline activity across trials (regular and random) and sessions (1st, N−1th, Nth, N+1th, and 9th). A time-series t test was performed on 1200 ms poststimulus theta activity against the 200 ms prestimulus baseline, in a step of 50 ms. The resulting p value was Bonferroni corrected for signal × frequency × time dimensions. An ROI was selected if Bonferroni-corrected p ≤ 0.001 within this region.
In experiment 2, we conducted the stimulus-versus-baseline contrast to select EEG ROI across the entire scalp and reported the selected EEG ROIs based on standard 10–20 system electrode positions. In experiment 3, this contrast was conducted on whole cortex after source reconstruction, and the selected ROIs were reported using Desikan-Killiany (D-K) parcellation. In experiment 4, we defined the precuneus and superior frontal gyrus (SFG) cortex as ROIs based on D-K parcellation because of our observation on theta activity in experiment 3 revealing its association with transitions.
Theta signal transfer
Phase transfer entropy (PTE) is a useful metric for measuring causal and directional information flow in neural oscillations between regions (Lobier et al., 2014). When the signal of one region (10) transfers to the other one (y), the present activity Y(t) of y depends not only on its past activity Y(t – δ), but more on the past activities of both Y(t – δ) and X(t – δ). Given this principle, it can be seen that the uncertainty of current signal Y(t) determined by its own past signal Y(t – δ) is greater than the uncertainty jointly determined by both Y(t – δ) and X(t – δ). The uncertainty can be solved by Shannon entropy:
The transfer entropy from x to y (TEx→y) can be computed by:
Using a continuous Morlet wavelet transform on X(t), one can obtain activity at a given frequency , where A(t) is the instantaneous amplitude at time t and θ(t) is the instantaneous phase at time t.
The frequency-specific phase transfer entropy from x to y (PTEx→y) can be represented by:
Then, directional PTEx→y can be estimated to reduce bias (Hillebrand et al., 2016) as follows:
A dPTEx→y ranges within [0, 1]. A dPTEx→y > 0.5 means a preferential signal transfer from x to y, whereas <0.5 means an inverse directional transfer. A dPTEx→y = 0.5 means no directional transfer.
We normalized dPTE into a signed value using a method recommended by Wang et al. (2019):
So, a positive value indicates a transfer of x→y and a negative one indicates a transfer of y→x. A value of zero shows no directional transfer.
Normalized dPTE was calculated between each pairwise ROIs for each combination of trial × session conditions. The frequency of interest was theta (∼5 Hz), and the time window for PTE computation was −0.2–1.2 s. A significance conclusion for signal transfer at a given session requires two pieces of evidence: a positive normalized dPTE in the regular condition; and this normalized dPTE exceeds the normalized dPTE in the random (control) condition. Statistical tests were performed using paired t test.
Bayes factor
Bayes factors (BFs) were estimated for pairwise comparisons using a H1 modeling approach (Dienes, 2019). A normal distribution was used to model H1 for RT, AUC, and PTE, and a Cauchy used for recognition accuracy (ACC), knowledge proportion, and model fit (WAIC z-score). The hypothesized mean difference (SD of H1) between regular versus random conditions in RT was set at 15.28 ms based on a previous study (Kaufman et al., 2010). An upper limit raw effect size = 0.5 (i.e., SD = 0.25) was used for ACC, knowledge proportion, AUC, and PTE following the room-to-move heuristic (Dienes, 2019). For model fit comparisons, we adopted a noninformative prior with a default Cauchy scale factor = 0.707 as previously used in a study (Spaak and de Lange, 2020). In all pairwise comparisons, half of norm (BHN(0,SD)) or half of Cauchy (BHC(0,SD)) were employed; however, for comparisons between rTMS-intensive and rTMS-suppressive groups in experiment 4 where no directionality constraint was imposed, two-sided distributions (BN(0,2SD) or BC(0,2SD)) were applied. When interpreting BF values, we followed a common practice (Dienes, 2016): good enough evidence for an effect (BF > 3) or not good enough evidence for an effect (3 > BF > 0.33) or good enough evidence for no effect (BF < 0.33). All BFs were computed using R script (Dienes and Mclatchie, 2018).
Data and code availability
Data supporting the findings in this paper are deposited at https://osf.io/ch4xf/. The custom Python code for modeling is available at https://github.com/HeidiYan/Transition.
Results
Transition rate and transition session
Figure 3 illustrated the detected transition for individual participants in experiments 1–3. In experiment 1, the session-by-session awareness measure detected 0/22, 2/22, 15/18, and 10/18 participants (transition rate = 0%, 9.09%, 83.33%, 55.56%) in one-, two-, eight-, and nine-session groups, respectively. The rate was greater in eight- or nine-session groups than in one- or two-session groups (Zs ≥ 3.19, Bonferroni-corrected ps ≤ 0.009, rank test), but there was no significant difference between one- versus two-session group or eight- versus nine-session group (Zs ≤ 1.81, Bonferroni-corrected ps ≥ 0.423, rank test).

Transitions detected by session-by-session awareness measure within SRT task for individual participants of experiments 1–3.
In both experiments 2 and 3 using the nine-session SRT task, the transition rate was similar with values of, respectively, 20/33 (60.61%) and 27/40 (67.50%), which were not significantly different from each other nor from the transition rate of eight- and nine-session groups in experiment 1 (group-merged transition rate = 69.44%, Zs ≤ 0.77, ps ≥ 0.441, rank test). These results indicated that over half of the participants experienced a transition when completing their final sessions.
Our awareness measure was implemented following every session to determine each participant’s position of transition during learning. We found that most transitions occurred within sessions 3–7 (median = 4) across all transition participants, this pattern was consistent for experiments 2 and 3, as well as eight-session and nine-session groups in experiment 1.
Postlearning scores
In experiment 1, in addition to the session-by-session awareness measure used during SRT task, we conducted the structural knowledge test for each group after learning to evaluate the awareness state of sequence knowledge.
The overall ACC of each group was tested against a chance level of 50%. The mean ACC values and 95% confidence intervals were 57.11 [54.42, 59.81]%, 62.89 [58.33, 67.45]%, 65.65 [59.51, 71.79]%, and 61.58 [56.67, 67.00]% for one-, two-, eight-, and nine-session groups, respectively; all these ACCs exceeded the chance level (ts ≥ 4.51, ps < 0.001, BHC(0,0.25) ≥ 3851.78), indicating that the participants correctly discriminated the regular sequence from random ones after learning.
A one-way ANOVA was conducted to determine group differences in terms of ACC based on four categories: Guess (ACCguess), Intuition (ACCintuition), Memory (ACCmemory), and Rule (ACCrule; see Fig. 4a, upper panel). We found that only ACCrule differed between groups (F(3,74) = 3.38, p = 0.023, ηp2 = 0.12), while there was no group difference in ACCguess, ACCintuition, or ACCmemory (F(3,74) ≤ 1.58, ps ≥ 0.201, ηp2 ≤ 0.06).
Figure 4.

Awareness scores in experiment 1. a, Postlearning scores obtained by structural knowledge test. Significance bars represent p < 0.01 (Bonferroni-corrected p ≤ 0.06). b, Postlearning scores of each category are distinguished according to transition and nontransition participants that were identified by the session-by-session awareness measure. Significance bras, p < 0.001 (Bonferroni-corrected p ≤ 0.002). c, ROC curve of transition versus nontransition participants by the postlearning scores. Error bars in panels a and b represent 1 SD (±SD).
Post hoc comparison revealed a lower ACCrule in one-session group (57.88%, [50.18, 65.59]%) than in either eight-session (76.41 [65.61, 87.20]%) or nine-session group (73.47 [64.14, 82.80]%; ps ≤ 0.010, Bonferroni-corrected ps ≤ 0.060, and BHC(0,0.25) ≥ 5.63), and no significant difference was found among other pairwise comparisons (ps ≥ 0.101, BHC(0,0.25) ≤ 0.80). This result suggested a trend toward higher explicit recognition accuracy using rules as a basis with final compared with initial sessions completed.
In addition to ACC, we also estimated knowledge proportion to indicate how many correct recognitions resulted from guess (proportionguess), intuition (proportionintuition), memory (proportionmemory), and rule (proportionrule). The one-way ANOVA results showed differences in proportionintuition and proportionrule between groups (F(3, 74) ≥ 3.02, ps ≤ 0.035, ηp2 ≥ 0.11), but not for proportionguess or proportionmemory (F(3,74) ≤ 2.42, ps ≥ 0.073, ηp2 ≤ 0.09; Fig. 4a, lower panel).
Post hoc comparisons revealed that, in comparison to the one-session group (8.50 [3.15, 13.85]%), both the eight-session (32.59 [22.35, 42.83]%) and nine-session (27.15 [15.70, 38.60]%) groups exhibited higher proportionrule (Bonferroni-corrected ps ≤ 0.030, and BHC(0,0.25) ≥ 16.92). Additionally, the proportionrule was also higher in the eight-session group compared with the two-session group (14.10 [4.36, 23.83]%; p = 0.009, Bonferroni-corrected p = 0.055, BHC(0,0.25) = 6.57). Regarding the proportionintuition, it was higher in the one-session group (39.28 [30.10, 48.45]%) than in the eight-session group (25.09 [19.76, 30.41]%; p = 0.009, Bonferroni-corrected p = 0.054, BHC(0,0.25) = 6.77). These findings suggested an increase reliance on explicit rule choice and less to implicit intuition choice after final compared with initial sessions. Together with ACC evidence, the results indicated a transition from implicit to explicit conscious state of sequence knowledge acquisition with increasing number of learning sessions.
ROC of session-by-session detection by postlearning scores
For a given participant in experiment 1, awareness scores were obtained from both the session-by-session verbal measure and postlearning structural knowledge test. The ROC curve was generated for the session-by-session measure using scores from structural knowledge test including the ACC and knowledge proportion. Figure 4b illustrates how the classification of transition versus nontransition made by session-by-session measure was associated with ACC or knowledge proportion scores. Compared with the nontransition participants, transition ones showed higher ACCrule and higher proportionrule but lower proportionintuition (F(1,76) ≥ 13.43, Bonferroni-corrected ps ≤ 0.002, ηp2 ≥ 0.15, BHC(0,0.25) ≥ 1856.63), indicating that these score distributions separated transition participants from nontransition participants.
Figure 4c, upper panel, showed that a participant who had higher ACCrule after learning was more likely to be detected as having the transition through session-by-session awareness measure during learning, as evidenced by the ROC for ACCrule exceeding the chance (AUC = 0.84 [0.76, 0.93], p < 0.001, BHN(0,0.25) = 3.22 × 10¹²), while the ROCs of ACCguess (0.60 [0.47, 0.74]), ACCintuition (0.54 [0.40, 0.68]), or ACCmemory (0.50 [0.36, 0.63]) did not exceed the chance level (ps ≥ 0.072, BHN0,0.25) ≤ 1.37).
Using the knowledge proportion scores (Fig. 4c, lower panel), we found that the ROC of proportionrule (AUC = 0.87 [0.78, 0.95]) was higher than the chance level (p < 0.001, BHN(0,0.25) = 9.98 × 10¹³). In contrast, the ROCs of proportionintuition (AUC = 0.26, [0.15, 0.37]) and proportionmemory (AUC = 0.36 [0.23, 0.49]) were both lower than the chance level (ps ≤ 0.021, BHN(0,0.25) ≥ 3.77). The ROC of proportionguess (AUC = 0.40 [0.27, 0.52]) did not differ from the chance level (p = 0.060, BHN(0,0.25) = 1.51). These suggested that participants were more likely to be detected as having the transition by session-wise awareness measure if their correct recognitions relied on rules rather than other categories such as intuition or memory.
This series of ROC results demonstrated that the detection of transition through session-by-session awareness measure is associated with an increase in accuracy and proportion of rule choices as well as a decline in the proportion of other choices. These findings provide validation for employing the session-by-session awareness measure to assess the state of awareness regarding sequence regularity.
Switchpoint of RT learning benefit at the transition (Nth) session
A growth trend in RT learning benefit was observed, as indicated by the RT difference of random versus regular conditions. The RT difference was greater than zero starting from the second session and extended in following sessions. This effect was consistently observed across experiments 1–3 (mean difference = 39.71 ms across experiments; paired ts ≥ 4.45, ps ≤ 0.001, d ≥ 0.95, BHN(0, 15.28) ≥ 1845.10), indicating that the RT learning benefit increased with more sessions of practice.
We determined whether there was a switchpoint where there was a sudden increase in RT learning benefit at the transition session (Fig. 5a). Participants’ RTs were fitted to no switchpoint, transition switchpoint, and nontransition switchpoint models (Fig. 5b). Across sample of experiment 1 (n = 13), the strongest evidence supported the transition switchpoint model (WAIC = −1.44), followed by the nontransition switchpoint model (WAIC = 0.23), and then the no switchpoint model (WAIC = 0.85). The pairwise differences between the transition switchpoint model and the other two models were significant (vs no switchpoint model: p < 1 × 10⁻⁵, BHC(0,0.707) = 1.22 × 10²⁰; vs nontransition switchpoint model: p < 1 × 10⁻⁵, BHC(0,0.707) = 2.36 × 10⁸; all Bonferroni-corrected ps < 0.001).
Figure 5.

RT switchpoint across experiments 1–3. a, Mean RT in regular and random conditions. Error bars represent 1 SEM. b, Z-scored WAIC for each of the switchpoint models. Dots represent the score of individual participants. Inside the violin plot, white dots denote the median; thick boxes denote quartiles; and thin lines denote quartiles ± 1.5 × interquartile range.
The results in experiments 2 and 3 were consistent with those obtained in experiment 1. In experiment 2 (n = 18), the comparison revealed a superior fit for the transition switchpoint model (WAIC = −1.56) compared with the nontransition switchpoint model (WAIC = 0.26) and then the no switchpoint model (WAIC = 1.00), ps < 1 × 10⁻⁵, BHC(0,0.707) ≥ 4.40 × 10¹⁰. Similarly, in experiment 3 (n = 22), the transition switchpoint model (WAIC = −1.02) demonstrated a better fit for RT learning benefit observations compared with both the nontransition switchpoint (WAIC = 0.17) and the no switchpoint models (WAIC = 1.06), ps ≤ 1 × 10⁻⁵, BHC(0,0.707) ≥ 1.19 × 10⁹; all Bonferroni-corrected ps < 0.001.
Theta activity associated with the transition
The stimulus-versus-baseline t test identified two clusters of theta activity (Fig. 6a). The first cluster was located in the parietal region from 25 to 280 ms with a peak at 150 ms after stimulus onset. A subsequent frontal cluster was detected from 50 to 450 ms with a peak at 350 ms, Bonferroni-corrected ps < 0.001. Figure 6b,c displays the average activity of ROI across electrodes within a frequency band of 1–30 Hz.
Figure 6.

Theta activity in EEG experiment 2. a, ROI identification. Topography shows stimulus versus baseline t value on mean theta power across trials (regular and random) and sessions (1st, N−1th, Nth, N+1th, and 9th). Parietal and frontal ROIs are illustrated at peak time of 150 and 450 ms, respectively. The electrodes selected for ROIs are denoted by an asterisk, signal × time × frequency Bonferroni-corrected p < 0.001. b, c, Time-frequency representation of ROIs identified in panel a. Panels b, c show the power in parietal and fontal ROIs across selected electrodes, respectively. ***p < 0.001 after signal × time × frequency Bonferroni correction.
Theta power in each ROI was averaged across electrodes and then submitted to a repeated-measure ANOVA with 2 (sequence type: regular vs random) × 5 (session type: 1st, N−1th, Nth, N+1th, and 9th). There was a significant interaction on parietal EEG ROI (F(4,68) = 4.36, p = 0.003, ηp2 = 0.20), which showed that regular sequences elicited greater theta power than random sequences only at the pretransition (N−1th) session (F(1,17) = 14.59, Bonferroni-corrected p = 0.0015, ηp2 = 0.46), but not in other types of sessions (F(1,17) ≤ 1.23, ps ≥ 0.271, ηp2 ≤ 0.07; Fig. 7a).
Figure 7.

ANOVA results of ROIs in EEG experiment 2. Mean theta power in (a) parietal ROI and (b) frontal ROI, and (c) mean beta power in frontal ROI. Dots and crosses represent individual participants. Error bars represent ± 1 SEM; *p < 0.05, **p < 0.01, and ***p < 0.001, after Bonferroni correction.
A similar interaction was observed on the frontal cluster (F(4,68) = 3.89, p = 0.007, ηp2 = 0.19), where the regular > random simple effect presented merely at the transition (Nth) session (F(1,17) = 19.10, Bonferroni-corrected p < 0.001, ηp2 = 0.53), but not in other types of sessions (F(1,17) ≤ 1.72, ps ≥ 0.193, ηp2 ≤ 0.09; Fig. 7b). These results suggested that theta oscillation is associated with learning, which is in line with numerous previous studies (Rozengurt et al., 2016; Loonis et al., 2017; Meissner et al., 2018), and that its location shifts toward the frontal region with the transition.
We also noticed a strong beta activity (16–20 Hz; time window = 30–120 ms) in frontal EEG ROI at the Nth session (see Fig. 6c). The same 2 × 5 ANOVA on this beta power showed an interaction effect (F(4,68) = 2.67, p = 0.039, ηp2 = 0.14). The regular > random simple effect was significant at the Nth (F(1,17) = 15.36, Bonferroni-corrected p = 0.001, ηp2 = 0.47), but not in other sessions (F(1,17) ≤ 2.51, ps ≥ 0.118, ηp2 ≤ 0.13; Fig. 7c), suggesting that beta power is specifically associated with emerging awareness of sequence in addition to theta activity. Interestingly, this unexpected effect on beta oscillation endorses the occurrence of explicit consciousness of sequence rules at the transition session since previous studies have demonstrated that frontal β waves are typically linked to waking consciousness and active concentration (Liu et al., 2015; Quentin et al., 2015).
Theta signal transfer of parietal → prefrontal at the pretransition (N–1th) session
Given that the location shift in theta activity implies potential signal transfer, we leveraged PTE to estimate the information flow from parietal to frontal EEG ROIs, encompassing a total of 10 × 10 directional paths between electrodes. Within this matrix, the 7 × 3 PTEparietal→frontal values are of our interest. Notably, to show that our PTE captures features beyond power increase, we extracted the average of all positive PTE values within the 7 × 7 parietal and 3 × 3 frontal ROIs as a control. This PTEwithin ROI can serve as a stringent control because activity among adjacent electrodes tends to be more synchronized. If the PTEparietal→frontal exceeds the PTEwithin ROI, it suggests that our PTE results are not simply caused by power modulations but rather capture long-distance signal transfer.
A transfer of parietal→frontal was detected in regular condition at the N−1th session (Fig. 8a). This PTEparietal→frontal = 0.11 [0.07, 0.14] averaged across 21 paths was greater than zero (t(17) = 6.34, Bonferroni-corrected p < 0.001, d = 1.49, BHN(0,0.25) = 6.52 × 10⁷) and also greater than that observed in the random condition which had a value of 0.02 [−0.01, 0.05] (t(17) = 3.88, Bonferroni-corrected p = 0.004, d = 0.92, BHN(0,0.25) = 323.81). In our control analysis, we found the PTEparietal→frontal in regular condition at N−1th also exceeded the PTEwithin ROI (0.05 [0.03, 0.06]; t(17) = 3.43, Bonferroni-corrected p = 0.010, d = 0.81, BHN(0,0.25) = 51.25). However, no significant PTEs were detected in the other types of sessions (ps ≥ 0.178, BHN(0,0.25) ≤ 0.23; Fig. 8b).
Figure 8.
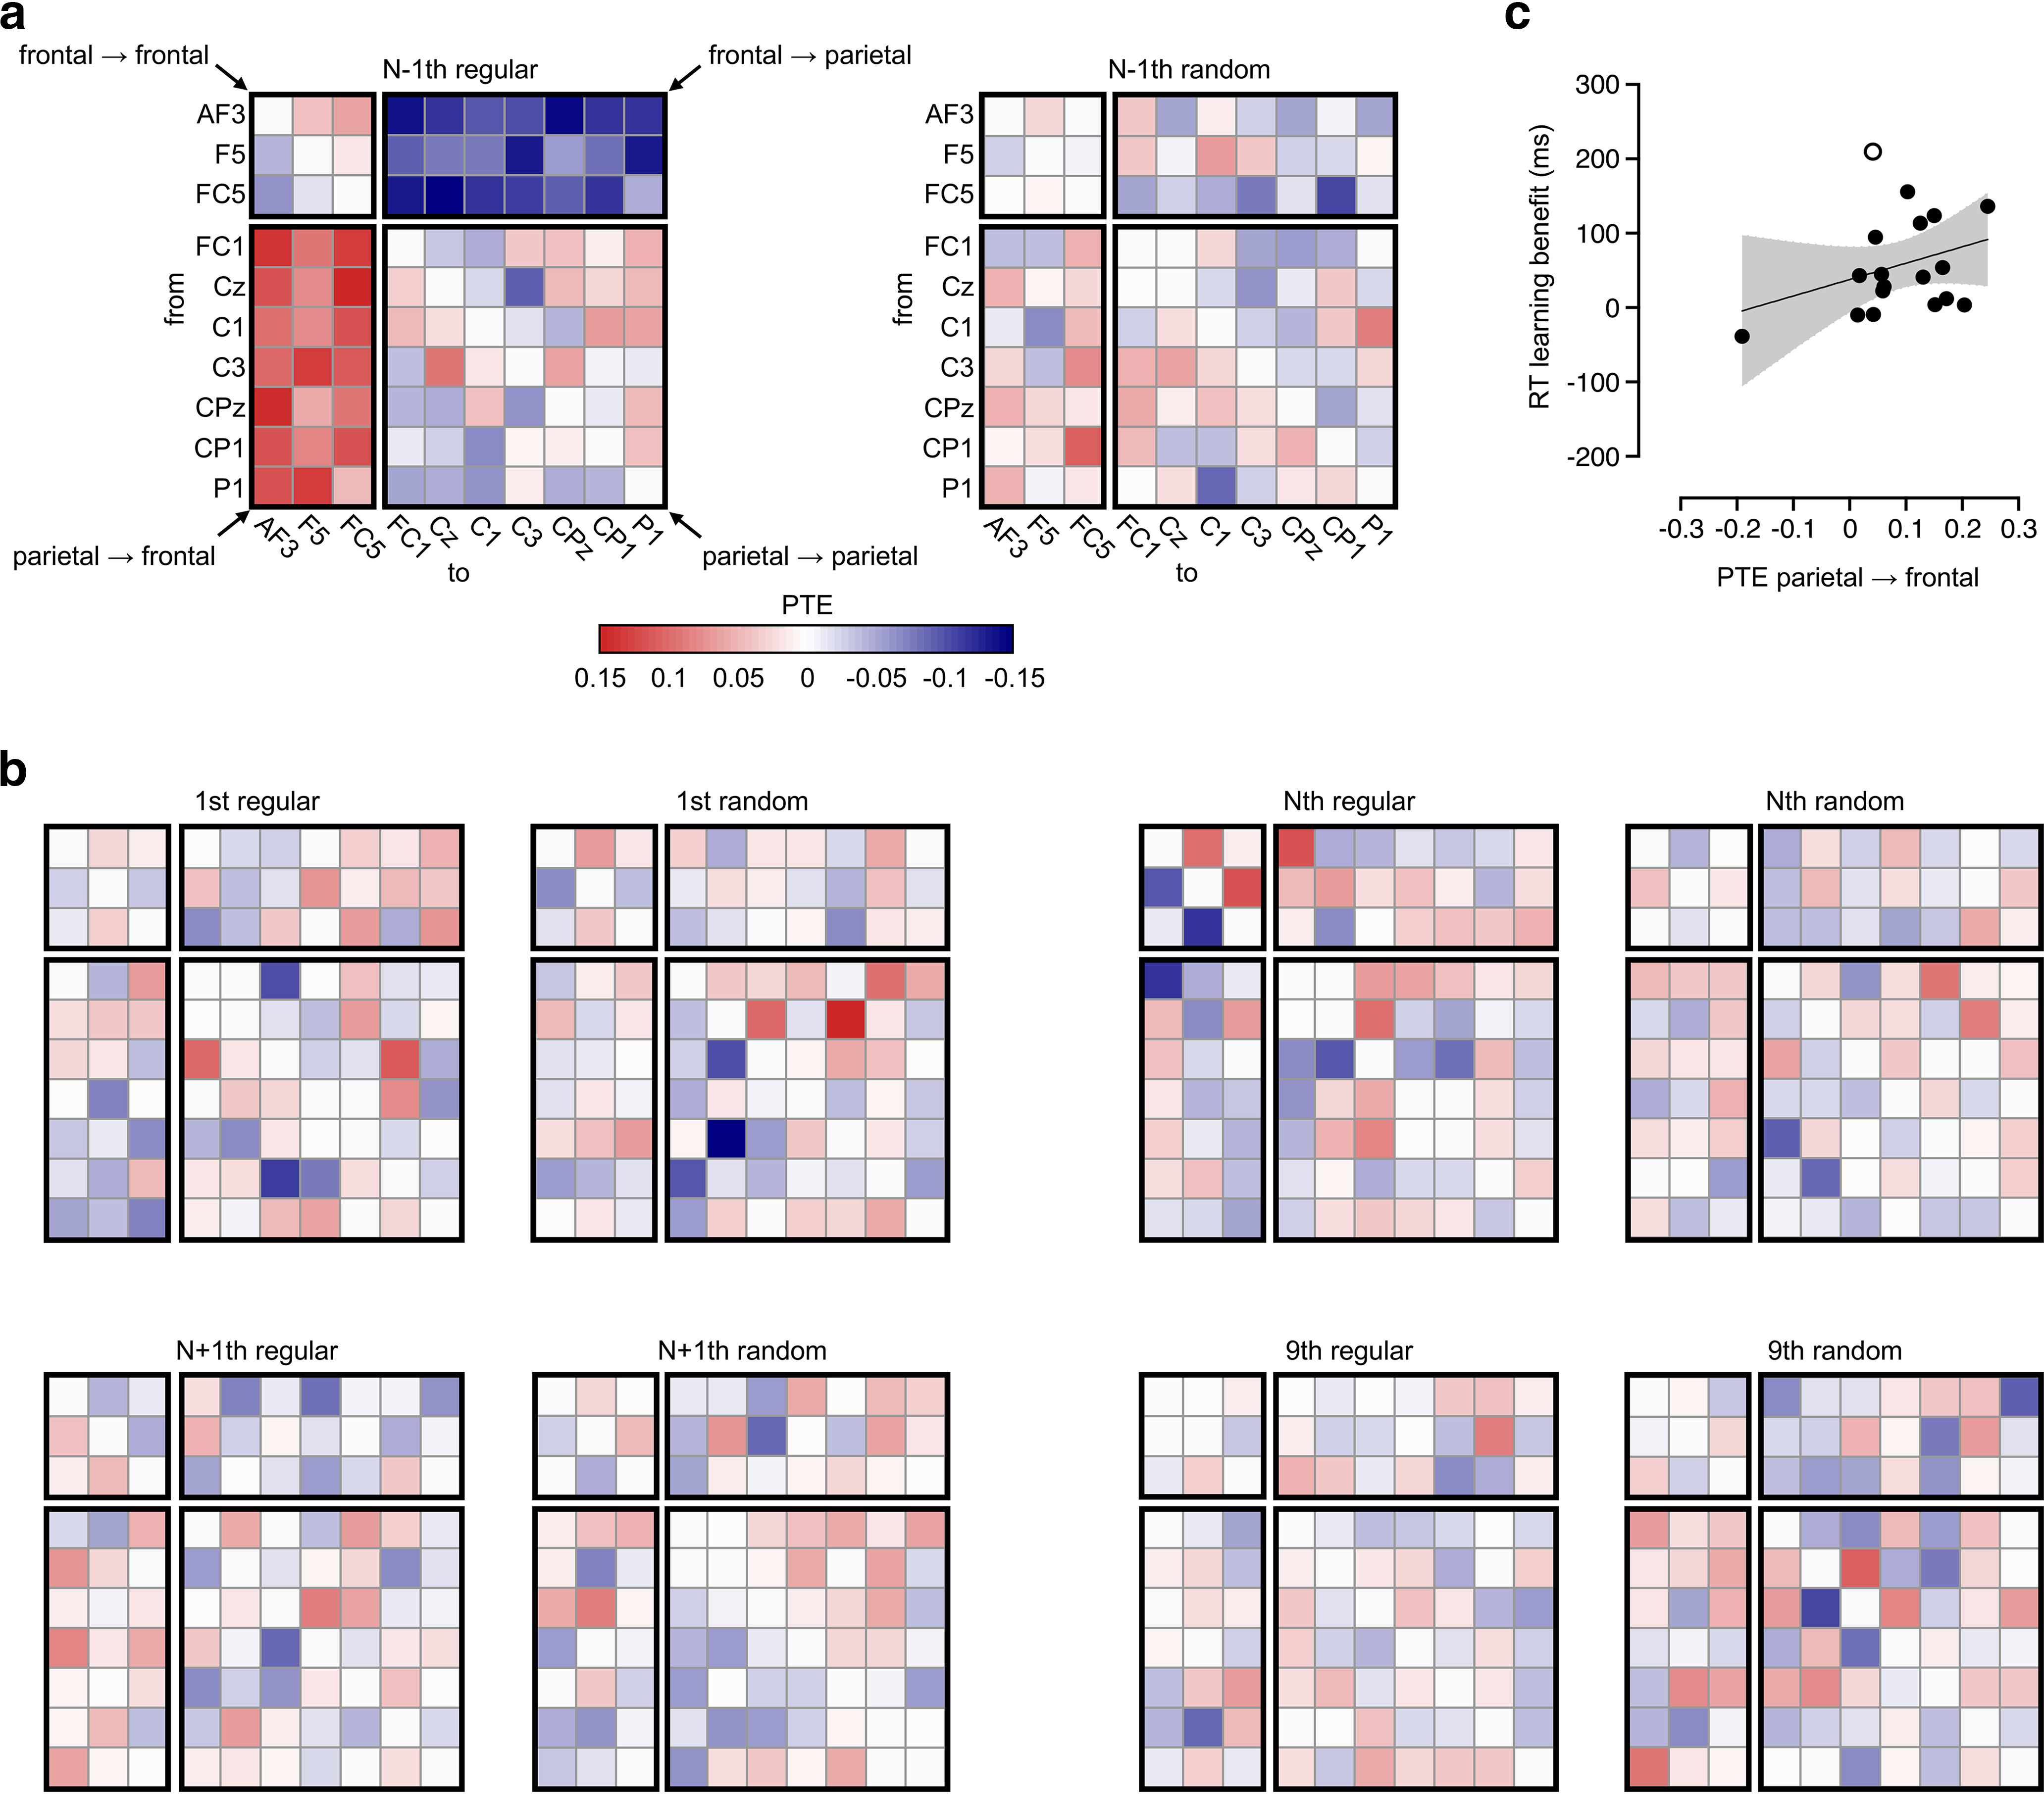
Theta signal transfer of parietal → frontal in experiment 2. a, Phase transfer entropy (PTE) of the 10 × 10 matrix at the pretransition (N−1th) session. b, PTE at the 1st, Nth, N+1th, and 9th sessions in experiment 2. The rows and columns are as in panel a. c, Relationship between PTEparietal→frontal and learning benefit. PTEparietal→frontal is indicated by the difference between regular and random trials at N−1th. Learning benefit is the increase of RT difference (RTrandom − RTregular) at Nth from N−1th. Scatters represent the individual participants. Line shows the linear correlation. Shade area represents the 95% confidence interval. The white dot is marked as the outlier value of learning benefit.
We tested whether this PTEparietal→frontal transfer linked with the RT learning benefit at the transition (Nth). The difference (regular > random) score of the N−1th PTEs parietal→frontal was calculated, serving as the neural index reflecting the learning effect. The increase of learning (RT) benefit from N−1th to Nth was calculated to show the transition effect on RT acceleration. We found that the correlation between PTEparietal→frontal difference score and RT benefit increase was not significant (r = 0.32, p = 0.200, n = 18); however, this correlation raised to r = 0.47 (p = 0.056, n = 17), on exclusion of an outlier value of learning benefit (210 ms > mean + 2 × SD = 57 + 2 × 67 ms = 191 ms; Fig. 8c).
Cortical theta transfer of precuneus → SFG at the N–1th
The theta signal transfer found in EEG data (experiment 2) was reproduced in MEG source-level data (experiment 3) using the same analysis pipeline. The use of MRI registration with MEG signal provided a satisfactory spatial resolution (see Methods).
The stimulus-versus-baseline contrast was performed on source-space theta activity for MEG ROI selection. Figure 9a displays a median parietal source (labeled as precuneus in D-K parcellation) from 150 to 450 ms, peaking at 250 ms, followed by a prefrontal source (superior frontal gyrus; SFG) after 200 ms, peaking at 600 ms (Bonferroni-corrected ps < 0.001). Theta power was extracted from these ROIs according to default D-K parcellation that contains 314 vertices (area = 47.15 cm2) in the left precuneus, 325 vertices (48.02 cm2) in the right precuneus, 671 vertices (98.64 cm2) in left SFG, and 603 vertices (91.65 cm2) in right SFG. Bilateral power values were averaged and used for ROI analysis.
Figure 9.

Theta activity in MEG experiment 3. a, Cortical ROI identification. t value map shows stimulus versus baseline contrast results, with a threshold of p < 0.001 after Bonferroni correction. Blue dots mark the peak sites. Left precuneus, MNI x, y, z = −1.1, −58.2, 39.1; left precuneus, 1.5, −60.3, 53.5; left SFG, −20.5, 43.4, 38.9; right SFG, 17.5, 46.4, 38.9. b, c, Mean theta power in bilateral precuneus (panel b) and SFG (panel c) selected in panel a. Error bars and significance are as in Figure 7.
We first examined whether observations of theta power on MEG source space are parallel to those on EEG. A repeated-measures ANOVA of 2 (sequence type: regular vs random) × 5 (session type: 1st, N−1th, Nth, N+1th, and 9th) revealed an interaction on theta power in both the precuneus and SFG (F(4,84) ≥ 2.69, ps ≤ 0.036, ηp2 ≥ 0.11). Specifically, the regular > random effect on precuneus theta power was only observed at the N−1th session (F(1,21) = 12.55, Bonferroni-corrected p = 0.003, ηp2 = 0.37), whereas no significant difference was found at other sessions after Bonferroni correction (uncorrected p = 0.040 and Bonferroni-corrected p = 0.201 at Nth; uncorrected ps ≥ 0.288 at 1st, N+1th, and 9th; Fig. 9b).
For SFG theta power, the regular > random effect was exclusively present at the Nth session (F(1,21) = 9.77, Bonferroni-corrected p = 0.012, ηp2 = 0.32), with no significant differences detected at other session (uncorrected ps ≥ 0.316; Fig. 9c). This pattern of results is consistent with our finding from EEG data.
Next, the theta signal transfer of parietal → frontal was tested. The cortical PTEs were calculated between bilateral precuneus and SFG regions, resulting in a 4 × 4 matrix comprising of PTEprecuneus→SFG (2 × 2), left – right precuneus PTE (2 × 1), and left–right SFG PTE (2 × 1). Positive PTEs in left–right precuneus and left–right SFG transfers were averaged and used as the PTEwithin ROI . A result of PTEprecuneus→SFG > PTEwithin ROI (control) supports a long-distance forward transfer over a synchronization between bilateral areas.
Figure 10a showed a significant theta signal transfer of precuneus → SFG in the regular condition at the N−1th session. This positive PTEprecuneus→SFG = 0.08 [0.06, 0.11] surpassed the PTEprecuneus→SFG (−0.01 [−0.04, 0.01]) in the random condition (t(21) = 4.44, Bonferroni-corrected p = 0.001, d = 0.95, BHN(0,0.25) = 3122.04). In control analysis, there was no significant difference between this PTEprecuneus→SFG in regular condition and the PTEwithin ROI (0.07 [0.05, 0.09]; t(21) = 0.68, uncorrected p = 0.504, d = 0.14, BHN(0,0.25) = 0.14). However, when comparing it to positive PTE values between bilateral precuneus (0.05 [0.03, 0.07]) as control, the PTEprecuneus→SFG showed superiority (t(21) = 1.95, pone-tail = 0.033), suggesting stronger signal transfer to prefrontal cortex compared with contralateral precuneus region. No significant PTE was detected at the 1st, Nth, N+1th, and 9th sessions (ps ≥ 0.132, BHN(0,0.25) ≤ 0.69; Fig. 10b).
Figure 10.

Theta signal transfer of precuneus → SFG in experiment 3. a, PTE of the 4 × 4 matrix at pretransition (N−1th). b, PTE at the 1st, Nth, N+1th, and 9th sessions in experiment 3. The rows and columns are as in panel a. c, Relationship between PTEprecuneus→SFG and learning benefit. Line and shade area are as in Figure 8c.
We examined the correlation between the theta signal transfer of precuneus → SFG at the N−1th and the RT learning benefit at the Nth, to establish the neural-behavior link (Fig. 10c). Our findings revealed a positive correlation between the N−1th PTEprecuneus→SFG (difference score of regular vs random) and the increment of RT learning benefit from N−1th to Nth (r = 0.47, p = 0.029). This suggested that the stronger theta transfer from precuneus to prefrontal cortex before the transition (pretransition) leads to better performance at the transition.
rTMS effect on theta signal transfer of precuneus → SFG
In experiment 4, we aimed to establish the causal link between the transfer and the transition by leveraging rTMS techniques. To validate the manipulation of rTMS, we assessed the impact of rTMS on precuneus theta power using EEG data. Comparing precuneus theta power across 9 sessions between groups, where rTMS was administered before each session, we observed significantly higher power in the rTMS-intensive group compared with the rTMS-suppressive group (time window: 150–450 ms; whole-brain FDR-corrected p < 0.05, 1000-time permutation test based on independent t test; Fig. 11a). This indicated a successful manipulation of rTMS.
Figure 11.

Effect of rTMS for all participants between groups. a, Group difference in average theta power across trials (regular and random) and sessions (1st, N−1th, Nth, N+1th, and 9th). b, PTEprecuneus→SFG difference between groups across trials and sessions. Inside the violin plot, the thick line denotes the median, and the thin line represents quartiles. **p < 0.01. c, Transition sessions of individual participants in two groups.
Regarding whether rTMS also influenced the transfer of theta signal from precuneus to SFG, we estimated PTEprecuneus→SFG based on D-K parcellation using the same method as in experiment 3. A comparison of PTEprecuneus→SFG between groups was executed using a 5000-time permutation test to determine between-group significance. The results revealed that the PTEprecuneus→SFG was stronger in the rTMS-intensive (0.05 [0.02, 0.08]) compared with the rTMS-suppressive group (−0.01 [−0.03, 0.01]; 5000-time permuted p = 0.001, BN(0,0.5) = 1645.84; Fig. 11b). This finding supports that the rTMS modulated the theta signal transfer of precuneus → SFG.
Neural-behavior causal link between the theta signal transfer and the transition
In experiment 4, the session-by-session awareness measure detected 16 out of 27 participants in the rTMS-intensive group, resulting in a transition rate = 59.26%, and 10/28 participants in the rTMS-suppressive with a rate = 35.71% (Fig. 11c). The transition rate was significantly higher in the rTMS-intensive group compared with the rTMS-suppressive group (z = 1.75, pone-tail = 0.040, rank test), indicating that a greater number of participants experienced the transition among those who received intensive rTMS as opposed to suppressive rTMS.
Among participants who underwent the transition within sessions 3–7, the rTMS-intensive group exhibited a greater increase in RT learning benefit from N−1th to Nth (80.14 ms, [34.75, 125.53] ms; n = 10) compared with the rTMS-suppressive group (22.63 [7.54, 37.73] ms; n = 7), t(15) = 2.74, p = 0.020, d = 1.34, BN(0, 15.28) = 2.97 (Fig. 12a). Additionally, within this subgroup of these participants with transition experience, the rTMS-intensive group still demonstrated stronger N−1th PTEprecuneus→SFG (regular > random difference) than the rTMS-suppressive group did (0.14 [0.04, 0.24]) versus −0.01 [−0.14, 0.12], respectively), 5000-time permuted p = 0.044, BN(0, 0.5) = 5.83 (Fig. 12b).
Figure 12.

Effect of rTMS in transition participants between groups. a, Violin plots for RT learning benefit in two groups. This learning benefit is indicated by the RT difference of (Nthrandom – Nthregular) – (N−1thrandom – N−1thregular). b, PTE of precuneus → SFG at N−1th in two groups. Violin plots are as in Figure 11b. *p < 0.05. c, Mean RT in regular and random conditions for two groups; format is as Figure 5a. d, Z-scored WAIC for each of the switchpoint models in two groups; violin plots are as Figure 5b.
Although both groups exhibited an increase in RT learning benefit at the transition, it remains to be confirmed whether this increment occurred as a switchpoint. Model-fit comparisons were conducted on RT learning benefit (see Fig. 12c) following our previous experiments. Among these transition participants in the rTMS- intensive group (n = 10), the transition switchpoint model (WAIC = −1.29) outperformed both the no switchpoint model (WAIC = 0.74; p = 7 × 10⁻⁴, Bonferroni-corrected p = 0.002, BHC(0,0.707) = 1041.08) and nontransition switchpoint model (WAIC = 0.27; p = 1 × 10⁻⁴, Bonferroni-corrected p = 3 × 10⁻⁴, BHC(0,0.707) = 2027.64; Fig. 12d, left).
For these transition participants in the rTMS-suppressive group (n = 7); however, we observed equivalent results with minor differences between models. The fit of transition switchpoint model (WAIC = −0.80) presented better than that of no switchpoint model (WAIC = 1.05; p = 0.009, Bonferroni-corrected p = 0.027, BHC(0,0.707) = 16.39), but did not significantly surpass nontransition switchpoint model (WAIC = −0.05; p = 0.021, Bonferroni-corrected p = 0.064, BHC(0,0.707) = 4.47; Fig. 12d, right).
Overall, we found that the theta signal transfer from precuneus to SFG was affected by the precuneus theta oscillation modified via rTMS, resulting in changes in both the participants’ transition rate and the performance speed at the transition.
Discussion
Although it has been proven that humans can develop conscious awareness of implicit sequence knowledge through training (Cleeremans, 2008; Lustig et al., 2022), the refined brain mechanisms underlying this process remain unclear. Our study uncovered a mechanism of theta signal transfer by which implicit sequence knowledge accesses consciousness during continual learning.
The behavioral results established that a switchpoint-like RT drop serves as a behavioral hallmark of transition occurrence. Previous studies have identified two indicators of transition: a rapid decrease in RT and verbal expression of sequence knowledge (Haider and Frensch, 2005; Wessel et al., 2012; Esser et al., 2022). However, these two falls short of evidence on temporal coherence because of the delayed implementation of verbal awareness measures after task completion, while sudden RT drop occurs during the task. We used a session-wise verbal awareness measure to pinpoint the transition and detected a switchpoint of RT benefit exclusive to the corresponding session across experiments 1-3. This indicates that the verbally reportable knowledge and the switchpoint-like RT drop occurred simultaneously in the same session. A common explanation for the RT switchpoint is that participants’ implicit sequence knowledge becomes explicit, enabling them to anticipate future stimuli based on prior presentations and resulting in an abrupt increase in performance speed approaching simple RT levels (Lustig et al., 2022).
Neural oscillation studies have shown a positive correlation between theta power and enhancement in learning performance (Crivelli-Decker et al., 2018; Meissner et al., 2018; Reddy et al., 2021). However, further evidence is needed to elucidate the role of theta oscillation in this transition. We found that the frontal theta power, as measured by scalp EEG in experiment 2, exhibited higher levels in regular sequences compared with random sequences at the transition session. Similarly, analysis of source-level MEG data from experiment 3 indicated a comparable effect at the superior frontal cortex. These results provide evidence supporting the critical involvement of the PFC in explicit learning by facilitating knowledge awareness, which aligns with previous research (Aizenstein et al., 2006; Loonis et al., 2017; Robertson and Pascual-Leone, 2003). Intriguingly, we also observed an elevated parietal theta power just before the emergence of awareness (pretransition session), suggesting engagement of parietal theta activity in the transition. This location shift from parietal to prefrontal regions across time may indicate the neural information transfer analogous to nonhuman primate studies where posterior signals trigger awareness-related prefrontal activation (van Vugt et al., 2018).
The PTE analysis of EEG and MEG data confirmed the signal transfer hypothesis. In the pretransition session, we observed a stronger theta signal transfer from the parietal to prefrontal regions in response to regular sequences compared with random sequences. Also, this difference in transfer strength predicted the extent of RT learning benefit at the transition. This finding fits a long-standing view that theta activity facilitates long-distance information transfer along connected neurons (Buzsáki, 2006). Additionally, our findings align with previous research on cognitive function and structural connections of precuneus as a meta-analysis discovered it is one of the most frequently activated regions during sequence learning (Konovalov and Krajbich, 2018; Janacsek et al., 2020) and acts as a memory buffer for sequence knowledge (Oishi et al., 2005). Precuneus serves as a hub for structural networks with an affluent white-matter connection to PFC (Cavanna and Trimble, 2006; Cavanna, 2007; Margulies et al., 2009), which can bear abundant information exchanges. Furthermore, our study provides a specific insight into how precuneus ignites awareness-related PFC activation through signal transferring.
Our study revealed that the emergence of awareness regarding acquired knowledge during learning is specifically associated with an increase in prefrontal theta activity. However, Spaak and de Lange (2020) observed that despite the increase in prefrontal theta power, the acquired knowledge remains implicit. To address this inconsistency, we propose that when interpreting the function of the prefrontal cortex, it is crucial to consider its activation mode, specifically whether such activation is ignited by the feedforward process or not. In their spatial-context learning task (Spaak and de Lange, 2020), the implicitly acquired knowledge assists participants in inhibiting attention toward distractors (like forming a saccade pattern) which elicits stronger executive control of PFC and probably does not involve forward signal transfers. In our study, the pattern of prefrontal activation fits with a feedforward neural signaling model. Evidence from animal experiments suggests that such a feedforward pattern gives rise to conscious experience in bottom-up information processing (van Vugt et al., 2018). So, in our study, prefrontal activation functions primarily in the conscious awareness of knowledge representations formed through bottom-to-up processes rather than top-down control (if it were a matter of attention control, frontal theta power would be greater in random sequences because of increased cognitive conflicts). Given our novel evidence supporting the role of forward signal transfer in conscious awareness among humans, future research can differentiate whether the prefrontal cortex primarily serves awareness or cognitive control by investigating whether heightened PFC activity is triggered by posterior brain regions.
We have established a causal link between the transfer of theta signals from precuneus to SFG and the transition from implicit to explicit knowledge. Participants with increased theta power in their precuneus exhibited a more pronounced transfer of precuneus → SFG compared with those with decreased power, confirming the efferent role of the precuneus in this theta signal transfer. As a result, an increased number of participants experienced a transition and encountered an expanded RT switchpoint at this juncture. Future research could investigate whether white matter connections between the precuneus and PFC also play a role in determining this transition using techniques such as diffusion tensor imaging, given that these structural connections constitute the physical basis for neural signal transfer.
Footnotes
This work was supported by the National Science Foundation of China Grant 32071051 and the Fundamental Research Funds for the Central Universities Grant 2020ECNU-GXJC001. We thank professor Zoltan Dienes from University of Sussex for fruitful discussions on the results and suggesting the bayes factor calculation.
The authors declare no competing financial interests.
References
- Aizenstein HJ, Butters MA, Clark KA, Figurski JL, Andrew Stenger V, Nebes RD, Reynolds CF, Carter CS (2006) Prefrontal and striatal activation in elderly subjects during concurrent implicit and explicit sequence learning. Neurobiol Aging 27:741–751. 10.1016/j.neurobiolaging.2005.03.017 [DOI] [PubMed] [Google Scholar]
- Albouy P, Weiss A, Baillet S, Zatorre RJ (2017) Selective entrainment of theta oscillations in the dorsal stream causally enhances auditory working memory performance. Neuron 94:193–206.e5. 10.1016/j.neuron.2017.03.015 [DOI] [PubMed] [Google Scholar]
- Bamber D (1975) The area above the ordinal dominance graph and the area below the receiver operating characteristic graph. J Math Psychol 12:387–415. 10.1016/0022-2496(75)90001-2 [DOI] [Google Scholar]
- Bertrand O, Tallon-Baudry C (2000) Oscillatory gamma activity in humans: a possible role for object representation. Int J Psychophysiol 38:211–223. 10.1016/s0167-8760(00)00166-5 [DOI] [PubMed] [Google Scholar]
- Buzsáki G (2006) Rhythms of the brain. Oxford: Oxford University Press. [Google Scholar]
- Cavanna AE (2007) The precuneus and consciousness. CNS Spectr 12:545–552. 10.1017/s1092852900021295 [DOI] [PubMed] [Google Scholar]
- Cavanna AE, Trimble MR (2006) The precuneus: a review of its functional anatomy and behavioural correlates. Brain 129:564–583. 10.1093/brain/awl004 [DOI] [PubMed] [Google Scholar]
- Cleeremans A (2008) Consciousness: the radical plasticity thesis. Prog Brain Res 168:19–33. 10.1016/S0079-6123(07)68003-0 [DOI] [PubMed] [Google Scholar]
- Cotovio G, Oliveira-Maia AJ, Paul C, Faro Viana F, Rodrigues da Silva D, Seybert C, Stern AP, Pascual-Leone A, Press DZ (2021) Day-to-day variability in motor threshold during rTMS treatment for depression: clinical implications. Brain Stimul 14:1118–1125. 10.1016/j.brs.2021.07.013 [DOI] [PubMed] [Google Scholar]
- Crivelli-Decker J, Hsieh LT, Clarke A, Ranganath C (2018) Theta oscillations promote temporal sequence learning. Neurobiol Learn Mem 153:92–103. 10.1016/j.nlm.2018.05.001 [DOI] [PubMed] [Google Scholar]
- Dale AM, Fischl B, Sereno MI (1999) Cortical surface-based analysis: I. Segmentation and surface reconstruction. Neuroimage 9:179–194. 10.1006/nimg.1998.0395 [DOI] [PubMed] [Google Scholar]
- Delorme A, Makeig S (2004) EEGLAB: an open source toolbox for analysis of single-trial EEG dynamics including independent component analysis. J Neurosci Methods 134:9–21. 10.1016/j.jneumeth.2003.10.009 [DOI] [PubMed] [Google Scholar]
- Dienes Z (2015) How Bayesian statistics are needed to determine whether mental states are unconscious. In: Behavioral methods in consciousness research (Overgaard M, ed), pp 199–220. Oxford: Oxford University Press. [Google Scholar]
- Dienes Z (2016) How Bayes factors change scientific practice. J Math Psychol 72:78–89. 10.1016/j.jmp.2015.10.003 [DOI] [Google Scholar]
- Dienes Z (2019) How do I know what my theory predicts? Adv Methods Pract Psychol Sci 2:364–377. 10.1177/2515245919876960 [DOI] [Google Scholar]
- Dienes Z, Scott R (2005) Measuring unconscious knowledge: distinguishing structural knowledge and judgment knowledge. Psychol Res 69:338–351. 10.1007/s00426-004-0208-3 [DOI] [PubMed] [Google Scholar]
- Dienes Z, Mclatchie N (2018) Four reasons to prefer Bayesian analyses over significance testing. Psychon Bull Rev 25:207–218. 10.3758/s13423-017-1266-z [DOI] [PMC free article] [PubMed] [Google Scholar]
- Esser S, Haider H (2017) The emergence of explicit knowledge in a serial reaction time task: the role of experienced fluency and strength of representation. Front Psychol 8:502. 10.3389/fpsyg.2017.00502 [DOI] [PMC free article] [PubMed] [Google Scholar]
- Esser S, Lustig C, Haider H (2022) What triggers explicit awareness in implicit sequence learning? Implications from theories of consciousness. Psychol Res 86:1442–1457. 10.1007/s00426-021-01594-3 [DOI] [PMC free article] [PubMed] [Google Scholar]
- Faul F, Erdfelder E, Lang A-G, Buchner A (2007) G*Power 3: a flexible statistical power analysis program for the social, behavioral, and biomedical sciences. Behav Res Methods 39:175–191. 10.3758/bf03193146 [DOI] [PubMed] [Google Scholar]
- Fonov V, Evans AC, Botteron K, Almli CR, McKinstry RC, Collins DL; Brain Development Cooperative Group (2011) Unbiased average age-appropriate atlases for pediatric studies. Neuroimage 54:313–327. 10.1016/j.neuroimage.2010.07.033 [DOI] [PMC free article] [PubMed] [Google Scholar]
- Fu Q, Sun H, Dienes Z, Fu X (2018) Implicit sequence learning of chunking and abstract structures. Conscious Cogn 62:42–56. 10.1016/j.concog.2018.04.010 [DOI] [PubMed] [Google Scholar]
- Giller F, Bensmann W, Mückschel M, Stock AK, Beste C (2020) Evidence for a causal role of superior frontal cortex theta oscillations during the processing of joint subliminal and conscious conflicts. Cortex 132:15–28. 10.1016/j.cortex.2020.08.003 [DOI] [PubMed] [Google Scholar]
- Gobel EW, Parrish TB, Reber PJ (2011) Neural correlates of skill acquisition: decreased cortical activity during a serial interception sequence learning task. Neuroimage 58:1150–1157. 10.1016/j.neuroimage.2011.06.090 [DOI] [PMC free article] [PubMed] [Google Scholar]
- Guo X, Li F, Yang Z, Dienes Z (2013) Bidirectional transfer between metaphorical related domains in implicit learning of form-meaning connections. PLoS One 8:e68100. 10.1371/journal.pone.0068100 [DOI] [PMC free article] [PubMed] [Google Scholar]
- Gramfort A, Papadopoulo T, Olivi E, Clerc M (2010) OpenMEEG: opensource software for quasistatic bioelectromagnetics. Biomed Eng Online 9:45. 10.1186/1475-925X-9-45 [DOI] [PMC free article] [PubMed] [Google Scholar]
- Green DM, Swets JA (1974) Signal detection theory and psychophysics. Malabar: Robert E. Krieger. [Google Scholar]
- Gross J, Baillet S, Barnes GR, Henson RN, Hillebrand A, Jensen O, Jerbi K, Litvak V, Maess B, Oostenveld R, Parkkonen L, Taylor JR, van Wassenhove V, Wibral M, Schoffelen JM (2013) Good practice for conducting and reporting MEG research. Neuroimage 65:349–363. 10.1016/j.neuroimage.2012.10.001 [DOI] [PMC free article] [PubMed] [Google Scholar]
- Haider H, Frensch PA (2005) The generation of conscious awareness in an incidental learning situation. Psychol Res 69:399–411. 10.1007/s00426-004-0209-2 [DOI] [PubMed] [Google Scholar]
- Hillebrand A, Tewarie P, van Dellen E, Yu M, Carbo EWS, Douw L, Gouw AA, van Straaten ECW, Stam CJ (2016) Direction of information flow in large-scale resting-state networks is frequency-dependent. Proceedings of the National Academy of Sciences 113:3867–3872. [DOI] [PMC free article] [PubMed] [Google Scholar]
- Hobot J, Skóra Z, Wierzchoń M, Sandberg K (2023) Continuous theta burst stimulation to the left anterior medial prefrontal cortex influences metacognitive efficiency. Neuroimage 272:119991. 10.1016/j.neuroimage.2023.119991 [DOI] [PubMed] [Google Scholar]
- Ivanchei II, Moroshkina NV (2018) The effect of subjective awareness measures on performance in artificial grammar learning task. Conscious Cogn 57:116–133. 10.1016/j.concog.2017.11.010 [DOI] [PubMed] [Google Scholar]
- Janacsek K, Shattuck KF, Tagarelli KM, Lum JAG, Turkeltaub PE, Ullman MT (2020) Sequence learning in the human brain: a functional neuroanatomical meta-analysis of serial reaction time studies. Neuroimage 207:116387. 10.1016/j.neuroimage.2019.116387 [DOI] [PubMed] [Google Scholar]
- Jurchiş R, Opre A (2016) Unconscious learning of cognitive structures with emotional components: implications for cognitive behavior psychotherapies. Cogn Ther Res 40:230–244. 10.1007/s10608-015-9743-z [DOI] [Google Scholar]
- Kaufman SB, DeYoung CG, Gray JR, Jiménez L, Brown J, Mackintosh N (2010) Implicit learning as an ability. Cognition 116:321–340. 10.1016/j.cognition.2010.05.011 [DOI] [PubMed] [Google Scholar]
- Klimesch W, Doppelmayr M, Yonelinas A, Kroll NEA, Lazzara M, Röhm D, Gruber W (2001) Theta synchronization during episodic retrieval: neural correlates of conscious awareness. Brain Res Cogn Brain Res 12:33–38. 10.1016/s0926-6410(01)00024-6 [DOI] [PubMed] [Google Scholar]
- Konovalov A, Krajbich I (2018) Neurocomputational dynamics of sequence learning. Neuron 98:1282–1293.e4. 10.1016/j.neuron.2018.05.013 [DOI] [PubMed] [Google Scholar]
- Köster M, Langeloh M, Hoehl S (2019) Visually entrained theta oscillations increase for unexpected events in the infant brain. Psychol Sci 30:1656–1663. 10.1177/0956797619876260 [DOI] [PMC free article] [PubMed] [Google Scholar]
- Laakso I, Murakami T, Hirata A, Ugawa Y (2018) Where and what TMS activates: experiments and modeling. Brain Stimul 11:166–174. 10.1016/j.brs.2017.09.011 [DOI] [PubMed] [Google Scholar]
- Liu X, Yanagawa T, Leopold DA, Chang C, Ishida H, Fujii N, Duyn JH (2015) Arousal transitions in sleep, wakefulness, and anesthesia are characterized by an orderly sequence of cortical events. Neuroimage 116:222–231. 10.1016/j.neuroimage.2015.04.003 [DOI] [PMC free article] [PubMed] [Google Scholar]
- Lobier M, Siebenhühner F, Palva S, Palva JM (2014) Phase transfer entropy: a novel phase-based measure for directed connectivity in networks coupled by oscillatory interactions. Neuroimage 85 Pt 2]:853–872. 10.1016/j.neuroimage.2013.08.056 [DOI] [PubMed] [Google Scholar]
- Loonis RF, Brincat SL, Antzoulatos EG, Miller EK (2017) A meta-analysis suggests different neural correlates for implicit and explicit learning. Neuron 96:521–534.e7. 10.1016/j.neuron.2017.09.032 [DOI] [PMC free article] [PubMed] [Google Scholar]
- Lustig C, Esser S, Haider H (2022) The interplay between unexpected events and behavior in the development of explicit knowledge in implicit sequence learning. Psychol Res 86:2225–2238. 10.1007/s00426-021-01630-2 [DOI] [PMC free article] [PubMed] [Google Scholar]
- Margulies DS, Vincent JL, Kelly C, Lohmann G, Uddin LQ, Biswal BB, Villringer A, Castellanos FX, Milham MP, Petrides M (2009) Precuneus shares intrinsic functional architecture in humans and monkeys. Proc Natl Acad Sci U S A 106:20069–20074. 10.1073/pnas.0905314106 [DOI] [PMC free article] [PubMed] [Google Scholar]
- Meissner SN, Krause V, Südmeyer M, Hartmann CJ, Pollok B (2018) The significance of brain oscillations in motor sequence learning: insights from Parkinson’s disease. Neuroimage Clin 20:448–457. 10.1016/j.nicl.2018.08.009 [DOI] [PMC free article] [PubMed] [Google Scholar]
- Monroy CD, Gerson SA, Domínguez-Martínez E, Kaduk K, Hunnius S, Reid V (2019) Sensitivity to structure in action sequences: an infant event-related potential study. Neuropsychologia 126:92–101. 10.1016/j.neuropsychologia.2017.05.007 [DOI] [PubMed] [Google Scholar]
- Muller L, Chavane F, Reynolds J, Sejnowski TJ (2018) Cortical travelling waves: mechanisms and computational principles. Nat Rev Neurosci 19:255–268. 10.1038/nrn.2018.20 [DOI] [PMC free article] [PubMed] [Google Scholar]
- Neil GJ, Higham PA (2020) Repeated exposure to exemplars does not enhance implicit learning: a puzzle for models of learning and memory. Q J Exp Psychol (Hove) 73:309–329. 10.1177/1747021819873838 [DOI] [PubMed] [Google Scholar]
- Nobre AC, Van Ede F (2018) Anticipated moments: temporal structure in attention. Nat Rev Neurosci 19:34–48. 10.1038/nrn.2017.141 [DOI] [PubMed] [Google Scholar]
- Norman E, Scott RB, Price MC, Jones E, Dienes Z (2019) Can unconscious structural knowledge be strategically controlled? In: Implicit learning: 50 years on (Cleeremans A, Allakhverdov V, and Kuvaldina M, eds), pp 159–173. New York: Routledge/Taylor & Francis Group. 10.1038/nrn.2017.141 [DOI] [Google Scholar]
- Oishi K, Toma K, Bagarinao ET, Matsuo K, Nakai T, Chihara K, Fukuyama H (2005) Activation of the precuneus is related to reduced reaction time in serial reaction time tasks. Neurosci Res 52:37–45. 10.1016/j.neures.2005.01.008 [DOI] [PubMed] [Google Scholar]
- Ou W, Hämäläinen MS, Golland P (2009) A distributed spatio-temporal EEG/MEG inverse solver. Neuroimage 44:932–946. 10.1016/j.neuroimage.2008.05.063 [DOI] [PMC free article] [PubMed] [Google Scholar]
- Pfurtscheller G, Lopes da Silva FH (1999) Event-related EEG/MEG synchronization and desynchronization: basic principles. Clin Neurophysiol 110:1842–1857. 10.1016/s1388-2457(99)00141-8 [DOI] [PubMed] [Google Scholar]
- Qiao F, Sun F, Li F, Ling X, Zheng L, Li L, Guo X, Dienes Z (2018) Tonal symmetry induces fluency and sense of well-formedness. Front Psychol 9:165. 10.3389/fpsyg.2018.00165 [DOI] [PMC free article] [PubMed] [Google Scholar]
- Quentin R, Chanes L, Vernet M, Valero-Cabré A (2015) Fronto-parietal anatomical connections influence the modulation of conscious visual perception by high-beta frontal oscillatory activity. Cereb Cortex 25:2095–2101. 10.1093/cercor/bhu014 [DOI] [PMC free article] [PubMed] [Google Scholar]
- Paciorek A, Williams JN (2015) Semantic generalization in implicit language learning. J Exp Psychol Learn Mem Cogn 41:989–1002. 10.1037/xlm0000100 [DOI] [PubMed] [Google Scholar]
- Prutean N, Martín-Arévalo E, Leiva A, Jiménez L, Vallesi A, Lupiáñez J (2021) The causal role of DLPFC top-down control on the acquisition and the automatic expression of implicit learning: state of the art. Cortex 141:293–310. 10.1016/j.cortex.2021.04.012 [DOI] [PubMed] [Google Scholar]
- Rachid F (2017) Safety and efficacy of theta-burst stimulation in the treatment of psychiatric disorders: a review of the literature. J Nerv Ment Dis 205:823–839. 10.1097/NMD.0000000000000742 [DOI] [PubMed] [Google Scholar]
- Reddy L, Self MW, Zoefel B, Poncet M, Possel JK, Peters JC, Baayen JC, Idema S, VanRullen R, Roelfsema PR (2021) Theta-phase dependent neuronal coding during sequence learning in human single neurons. Nat Commun 12:4839–4839. 10.1038/s41467-021-25150-0 [DOI] [PMC free article] [PubMed] [Google Scholar]
- Robertson EM, Pascual-Leone A (2003) Prefrontal cortex: procedural sequence learning and awareness. Curr Biol 13:R65–R67. 10.1016/S0960-9822(02)01431-8 [DOI] [PubMed] [Google Scholar]
- Rose M, Haider H, Büchel C (2010) The emergence of explicit memory during learning. Cereb Cortex 20:2787–2797. 10.1093/cercor/bhq025 [DOI] [PubMed] [Google Scholar]
- Rozengurt R, Barnea A, Uchida S, Levy DA (2016) Theta EEG neurofeedback benefits early consolidation of motor sequence learning. Psychophysiology 53:965–973. 10.1111/psyp.12656 [DOI] [PubMed] [Google Scholar]
- Sakai K, Hikosaka O, Miyauchi S, Takino R, Sasaki Y, Pütz B (1998) Transition of brain activation from frontal to parietal areas in visuomotor sequence learning. J Neurosci 18:1827–1840. 10.1523/JNEUROSCI.18-05-01827.1998 [DOI] [PMC free article] [PubMed] [Google Scholar]
- Salvatier J, Wiecki TV, Fonnesbeck C (2016) Probabilistic programming in Python using PyMC3. PeerJ Compu Sci 2016. Available at 10.7717/peerj-cs.55. [DOI] [Google Scholar]
- Schuck NW, Gaschler R, Wenke D, Heinzle J, Frensch PA, Haynes JD, Reverberi C (2015) Medial prefrontal cortex predicts internally driven strategy shifts. Neuron 86:331–340. 10.1016/j.neuron.2015.03.015 [DOI] [PMC free article] [PubMed] [Google Scholar]
- Seidler RD, Purushotham A, Kim S-G, Ugurbil K, Willingham D, Ashe J (2005) Neural correlates of encoding and expression in implicit sequence learning. Exp Brain Res 165:114–124. 10.1007/s00221-005-2284-z [DOI] [PubMed] [Google Scholar]
- Seth AK, Bayne T (2022) Theories of consciousness. Nat Rev Neurosci 23:439–452. 10.1038/s41583-022-00587-4 [DOI] [PubMed] [Google Scholar]
- Spaak E, de Lange FP (2020) Hippocampal and prefrontal theta-band mechanisms underpin implicit spatial context learning. J Neurosci 40:191–202. 10.1523/JNEUROSCI.1660-19.2019 [DOI] [PMC free article] [PubMed] [Google Scholar]
- Stubbeman WF, Zarrabi B, Bastea S, Ragland V, Khairkhah R (2018) Bilateral neuronavigated 20Hz theta burst TMS for treatment refractory depression: an open label study. Brain Stimul 11:953–955. 10.1016/j.brs.2018.04.012 [DOI] [PubMed] [Google Scholar]
- Tadel F, Baillet S, Mosher JC, Pantazis D, Leahy RM (2011) Brainstorm: a user-friendly application for MEG/EEG analysis. Comput Intell Neurosci 2011:879716. 10.1155/2011/879716 [DOI] [PMC free article] [PubMed] [Google Scholar]
- Thönes S, Arnau S, Wascher E, Schneider D (2021) Boosting working memory with accelerated clocks. Neuroimage 226:117601. 10.1016/j.neuroimage.2020.117601 [DOI] [PubMed] [Google Scholar]
- Tsuchimoto S, Shibusawa S, Iwama S, Hayashi M, Okuyama K, Mizuguchi N, Kato K, Ushiba J (2021) Use of common average reference and large-Laplacian spatial-filters enhances EEG signal-to-noise ratios in intrinsic sensorimotor activity. J Neurosci Methods 353:109089. 10.1016/j.jneumeth.2021.109089 [DOI] [PubMed] [Google Scholar]
- van der Graaf FHCE, Maguire RP, Leenders KL, de Jong BM (2006) Cerebral activation related to implicit sequence learning in a double serial reaction time task. Brain Res 1081:179–190. 10.1016/j.brainres.2006.01.103 [DOI] [PubMed] [Google Scholar]
- Van Vugt B, Dagnino B, Vartak D, Safaai H, Panzeri S, Dehaene S, Roelfsema PR (2018) The threshold for conscious report: signal loss and response bias in visual and frontal cortex. Science 360:537–542. 10.1126/science.aar7186 [DOI] [PubMed] [Google Scholar]
- Wang R, Ge S, Zommara NM, Ravienna K, Espinoza T, Iramina K (2019) Consistency and dynamical changes of directional information flow in different brain states: a comparison of working memory and resting-state using EEG. Neuroimage 203:116188. 10.1016/j.neuroimage.2019.116188 [DOI] [PubMed] [Google Scholar]
- Waroquier L, Abadie M, Dienes Z (2020) Distinguishing the role of conscious and unconscious knowledge in evaluative conditioning. Cognition 205:104460. 10.1016/j.cognition.2020.104460 [DOI] [PubMed] [Google Scholar]
- Watanabe S (2010) Asymptotic equivalence of Bayes cross validation and widely applicable information criterion in singular learning theory. J Mach Learn Res 11:3571–3594. [Google Scholar]
- Wessel JR, Haider H, Rose M (2012) The transition from implicit to explicit representations in incidental learning situations: more evidence from high-frequency EEG coupling. Exp Brain Res 217:153–162. 10.1007/s00221-011-2982-7 [DOI] [PubMed] [Google Scholar]
- Whybird M, Coats R, Vuister T, Harrison S, Booth S, Burke M (2021) The role of the posterior parietal cortex on cognition: an exploratory study. Brain Res 1764:147452. 10.1016/j.brainres.2021.147452 [DOI] [PubMed] [Google Scholar]
- Zhang J, Liu D (2021) The gradual subjective consciousness fluctuation in implicit sequence learning and its relevant brain activity. Neuropsychologia 160:107948. 10.1016/j.neuropsychologia.2021.107948 [DOI] [PubMed] [Google Scholar]
Associated Data
This section collects any data citations, data availability statements, or supplementary materials included in this article.
Data Availability Statement
Data supporting the findings in this paper are deposited at https://osf.io/ch4xf/. The custom Python code for modeling is available at https://github.com/HeidiYan/Transition.