Abstract
Colorectal cancer (CRC) is a common malignant tumor that severely endangers human health. Exosomes show great potential in tumor immunotherapy. Increasingly studies have shown that exosome-related genes are effective prognostic biomarkers. Clinical information and gene expression data of CRC patients were obtained from gene expression omnibus and the cancer genome atlas. The data were then classified into training and independent validation sets. In the training set, exosome-related genes with a prognostic value were selected by univariate Cox analysis, least absolute shrinkage and selection operator Cox regression model, and stepwise Cox regression analysis. Risk scores were calculated based on the selected genes to stratify patients. The selected exosome-related genes were applied to establish a risk model. Based on 11 exosome-related genes, a prognostic risk model, which could stratify the risk both in the training and validation sets, was established. According to the survival curves, the prognoses of the high- and low-risk groups were significantly different. The AUCs of the risk model for prognostic prediction were 0.735 and 0.784 in the training and validation sets, respectively. A nomogram was constructed to predict the survival of CRC patients. Single-sample gene set enrichment analysis and ESTIMATE algorithms revealed that the risk model was related to immune cell infiltration. The value of the risk model in predicting immunotherapeutic outcomes was also confirmed. An exosome-related gene risk model was constructed to predict prognosis, evaluate microenvironment immune cell infiltration levels and bring a new perspective to CRC patient treatment.
Keywords: bioinformatics, exosome, prognosis, nomogram, immune cell infiltration, immunotherapy, colorectal cancer
1. Introduction
Colorectal cancer (CRC) is one of the most common malignant tumors worldwide, which ranks third in terms of incidence and second in terms of mortality.[1] CRC is a heterogeneous disease associated with many genetic or somatic mutations. Diagnostic and prognostic markers are applied for the early detection and risk stratification of CRC, which might prolong overall survival (OS) in patients.[2]
At present, treatments used for CRC include surgery, radiotherapy, chemotherapy, targeted therapy, and immunotherapy. Immunotherapy is the latest revolution in cancer therapy that continuously exhibits potential in treating various malignancy types. However, a great number of CRC patients are primary or have acquired resistance to immune checkpoint blockades.[3,4] Therefore, candidates who will benefit from immunotherapy treatment.
Exosomes are extracellular vesicles found in liquid biopsies and have excellent prospects for measuring various biological components related to tumorigenesis, tumor growth and metastasis, and resistance to treatment.[5] Thanks to the immunogenicity and molecular transfer function, exosomes are considered promising in cancer immunotherapy.[6] Furthermore, exosomes can be used for the early diagnosis and prognosis assessment in several cancers.[7,8] However, the predictive prognostic value of the exosome-related gene model in CRC remains unclear.
We developed an exosome-related gene risk model that could effectively predict the prognosis of CRC patients. At the same time, we explored the possible value of the model in evaluating immune cell-infiltrating characteristics and predicting immunotherapeutic responses.
2. Materials and methods
2.1. Data acquisition
Clinical information and gene expression data from the GSE39582 dataset, based on the GPL570 platform, were downloaded from the gene expression omnibus database and used as a training set. The corresponding information of COAD and ROAD projects was downloaded from the cancer genome atlas (TCGA) and used as a validation set. Exosome-related genes were downloaded from the ExoCarta database.[9]
The exclusion criteria for clinical data were as follows: absence of relevant clinical information, and survival time of <30 days.
2.2. Generation of a prognostic risk model
The GSE39582 and TCGA datasets served as training and validation sets, respectively. The exosome-related genes in the training set were ascertained. Based on the selected genes, gene ontology and the Kyoto encyclopedia of genes and genomes enrichment analyses were performed using the “clusterProfiler” package.[10] The univariate Cox analysis of OS was performed using the training set to select exosome-related genes with remarkable prognostic significance (P < .01). We then used the least absolute shrinkage and selection operator Cox regression model for further screening of the genes. The selected genes were incorporated into a stepwise Cox regression analysis and visualized by drawing forest plots.
2.3. Assessment and validation of the risk model
The exosome-related risk score for each patient was calculated on the basis of the selected gene expression levels and stepwise Cox regression coefficients:
The patients were then divided into high- and low-risk groups based on the median risk score of the GSE39582 set. The concordance index (C-index) was calculated for assessing the performance of the risk model.
Kaplan–Meier (K–M) curves were plotted to compare the differences in OS between the high- and low-risk groups. The statistical difference between the 2 groups was evaluated using the log-rank test. P < .05 was considered statistically significant. The relationships between the selected exosome-related genes and CRC patient prognosis were also analyzed by the K–M survival curves. The prognostic capability of the risk model was assessed by comparing the receiver operating characteristic curves and area under the ROC curves (AUCs) of our risk model, and other clinicopathological factors in the training and validation sets. Moreover, the predictive value of the exosome-related risk model for different clinical characteristics was explored.
2.4. Construction and assessment of a nomogram
Univariate and multivariate Cox analyses were performed to identify prognosis-related clinical factors in the training set (P < .05). A nomogram combining the exosome-related risk model and the selected clinical factors was constructed to predict OS probabilities at 1, 3, and 5 years. Then, the “rms” package was used to produce calibration curves for evaluating whether the nomogram was accurate. The decision curve analysis was performed to measure the clinical value of the nomogram.
2.5. Inference of immune cell infiltration
The single-sample gene set enrichment analysis (ssGSEA)[11] estimated the fraction of specific immune cell types at a single sample level and evaluated the relative abundance of 28 immune cell types by using the “GSVA” package.[12] To explore the relationships between the exosome-related genes and immune-infiltrating cells, we correlated the genes with the cells. Additionally, the stromal and immune scores of each CRC patient were calculated on the basis of the ESTIMATE algorithm by using the “ESTIMATE” package.[13]
2.6. Immune checkpoint molecules
The correlations between the expression of the selected exosome-related genes with immune checkpoint molecules and that of the exosome-related risk model with the expression of immune checkpoint molecules were explored.
2.7. Evaluation of the immunotherapy effect
The efficacy of the anti-PD-L1 antibody in patients with advanced urothelial cancer was investigated in the IMvigor210 immunotherapeutic cohort.[14] The complete transcriptome data and clinical information were obtained from the “IMvigor210CoreBiologies” package. After calculating the risk score of each patient, the patients were divided into high- and low-risk groups. We then compared the immunotherapy effect of high- and low-risk groups.
2.8. Drug sensitivity analysis
CELLMINER is a query tool for NCI-60 and includes a large amount of pharmacological data.[15] We calculated the exosome-related risk scores of NCI-60 cell lines and explored the relationship between these scores and the half maximal inhibitory concentration (IC50) of FDA-approved drugs. Several chemotherapeutic drugs commonly used for CRC including fluorouracil, oxaliplatin, and irinotecan were explored. Differences in the IC50 Z-score between the different risk groups were also analyzed. Moreover, the relationship between the selected exosome-related genes and chemotherapy drug sensitivity was explored.
3. Results
3.1. Clinical characteristics of CRC patients
In total, 530 and 405 clinical samples were included in GSE39582 and TCGA, respectively. Table 1 presents the basic clinical information of CRC patients in the training (GSE39582) and validation (TCGA) sets.
Table 1.
Clinicopathological characteristics of colorectal cancer (CRC) patients in this study.
| Characteristics | No. (%) | |
|---|---|---|
| Training cohort (n = 530) | Validation cohort (n = 405) | |
| Age | ||
| <65 | 207 (39.06) | 176 (43.45) |
| ≥65 | 323 (60.94) | 229 (56.55) |
| Gender | ||
| Female | 240 (45.28) | 188 (46.42) |
| Male | 290 (54.72) | 217 (53.58) |
| AJCC stage | ||
| I–II | 278(52.45) | 212(52.35) |
| III–IV | 252(47.55) | 193(47.65) |
| T stage | ||
| T0–T2 | 55 (10.38) | 83 (20.49) |
| T3–T4 | 475 (89.62) | 322 (79.51) |
| N stage | ||
| N0 | 290 (54.72) | 222 (54.81) |
| N+ | 240 (45.28) | 183 (45.19) |
| M stage | ||
| M0 | 470 (88.68) | 338 (83.46) |
| M1 | 60 (11.32) | 67 (16.54) |
| Event | ||
| Alive | 357 (67.36) | 350 (84.42) |
| Dead | 173 (32.64) | 55 (13.58) |
AJCC = American Joint Committee on Cancer.
3.2. Construction of the prognostic risk model
In total, 1617 exosome-related genes in the ExoCarta database were selected to establish prognostic gene signatures. Of them, 1428 genes were detected in the training set.
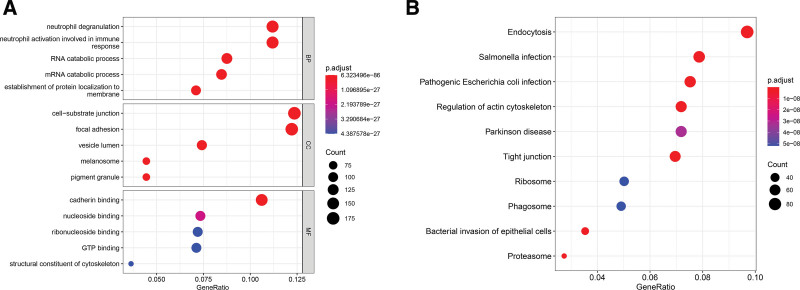
Functional gene ontology enrichment analyses revealed that these genes were significantly correlated to the exosome-related function and immune response processes such as the cell-substrate junction, vesicle lumen, and neutrophil degranulation involved in immune responses (Fig. 1A). According to the Kyoto encyclopedia of genes and genomes enrichment analysis, these genes were associated with exosome-related signal pathways (Fig. 1B).
Figure 1.
Results of functional enrichment analyses. (A) Gene ontology (GO) enrichment analysis. (B) Kyoto encyclopedia of genes and genomes (KEGG) enrichment analysis.
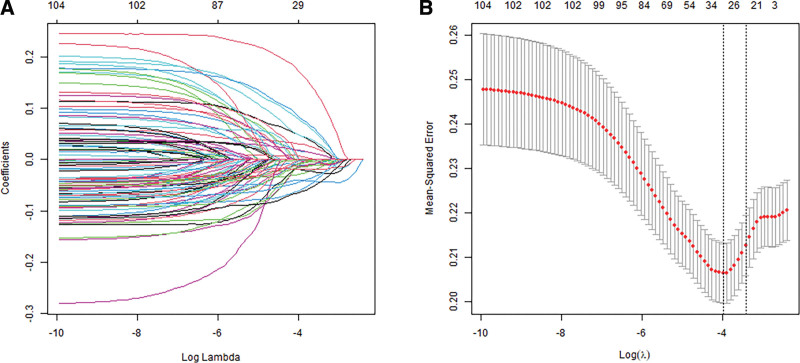
To construct an exosome-related risk model for predicting CRC patient prognosis, we performed the univariate Cox regression analysis (Supplement Table 1, http://links.lww.com/MD/K72). A total of 105 genes were significantly associated with OS in the training set (P < .01). In total, 26 candidate exosome-related genes were obtained through the least absolute shrinkage and selection operator Cox analysis (Fig. 2A and B).
Figure 2.
Least absolute shrinkage and selection operator (LASSO) analysis of exosome-related genes. (A) LASSO coefficient of the 105 exosome-related genes. (B) Tenfold cross-validation of the LASSO Cox model.
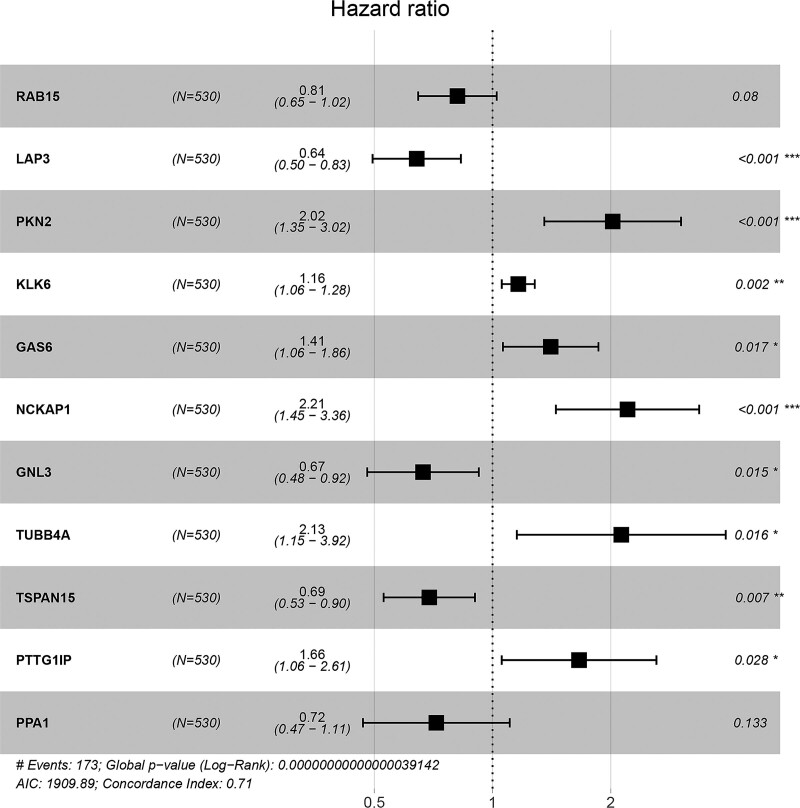
Stepwise Cox regression analysis was performed on these genes. Ultimately, LAP3, GAS6, PTTG1IP, PPA1, RAB15, GNL3, PKN2, NCKAP1, TUBB4A, KLK6, and TSPAN15 were selected for constructing a prognostic risk model (Fig. 3). The relationships between the selected genes and the survival probability of the CRC patients were analyzed by plotting K–M survival curves. The selected genes were significantly correlated with CRC patient prognosis (Supplement Fig. 1, http://links.lww.com/MD/K73).
Figure 3.
Forest plot of the 11 exosome-related genes selected by stepwise Cox regression analysis.
3.3. Assessment and validation of the exosome-related risk model
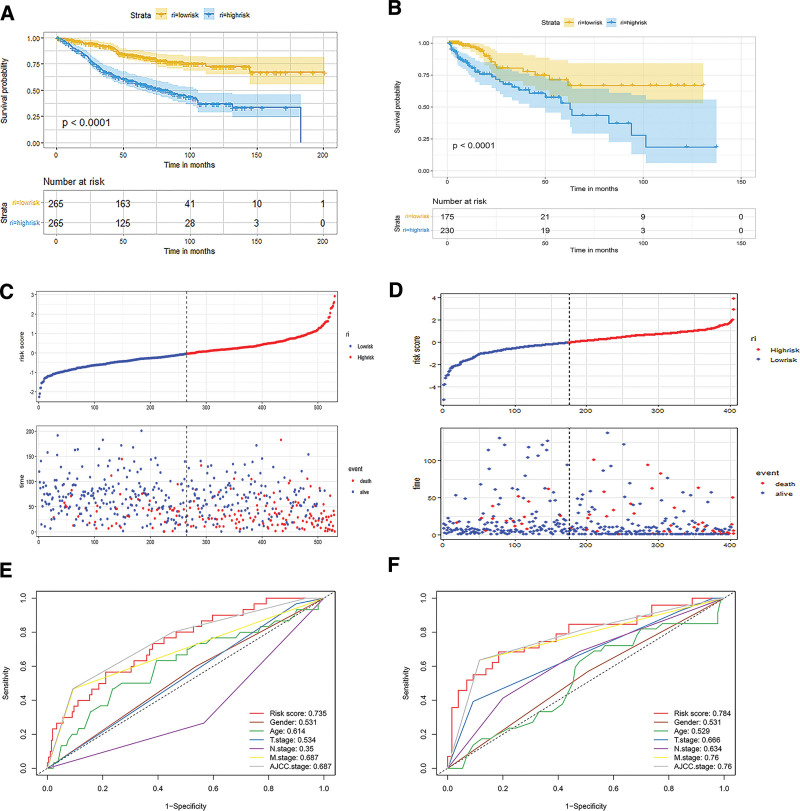
The risk score was calculated as follows: risk score = −0.21*RAB15 − 0.44*LAP3 + 0.70*PKN2 + 0.15*KLK6 + 0.34*GAS6 + 0.79*NCKAP1 − 0.41*GNL3 + 0.75*TUBB4A − 0.37*TSPAN15 + 0.51*PTTG1IP − 0.33*PPA1. The patients were divided into high- and low-risk groups on the basis of the median score. The C-index of the exosome-related risk score model was 0.71. The K–M survival curves revealed that patients with low-risk scores performed better OS than those with high-risk scores in both training and validation sets (Fig. 4A and B). Figure 4C presents the risk score distribution and the survival status of CRC patients in the training set. The validation set presented similar results (Fig. 4D).
Figure 4.
Evaluation of the risk model in the training and validation sets. (A) Kaplan–Meier (K–M) survival analysis of low- and high-risk groups in the training set. (B) K–M survival analysis of low- and high-risk groups in the validation set. (C) Correlation diagram of the risk model in the training set. (D) Correlation diagram of the risk model in the validation set. (E) Receiver operating characteristic (ROC) curves of the risk model and other clinical factors in the training set. (F) ROC curves of risk model and other clinical factors in the validation set.
The AUCs of the exosome-related risk model were 0.735 and 0.784, respectively, which were better than those of other clinical characteristics (Fig. 4E and F).
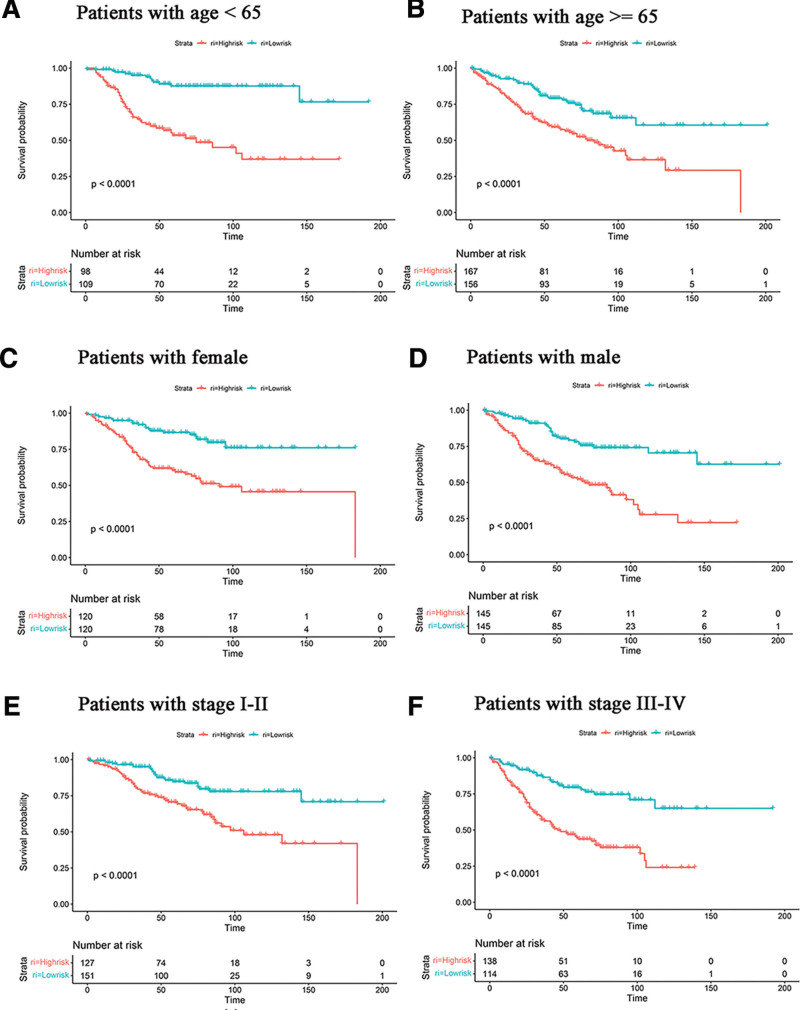
The predictive value of the exosome-related risk model for different clinical characteristics was further analyzed. In different age groups, the prognoses were better in the low-risk groups (Fig. 5A and B). In both female and male patient groups, the low-risk groups exhibited better prognoses than the high-risk groups (Fig. 5C and D). Regarding different clinical stages, survival probabilities were higher in stage I to II and stage III to IV groups of low-risk groups (Fig. 5E and F). Thus, the exosome-related risk model exhibited an excellent prognostic value in different subgroups of CRC patients.
Figure 5.
The risk model can predict the survival of patients of different ages, genders, and AJCC stages. (A and B) Kaplan–Meier (K–M) survival analysis of different ages. (C and D) K–M survival analysis of different genders. (E and F) K–M survival analysis of different AJCC stages. AJCC = American Joint Committee on Cancer.
3.4. Nomogram construction and assessment
Univariate and multivariate Cox regression analyses of age, gender, T stage, N stage, M stage, American Joint Committee on Cancer stage, and risk model were performed using the training set data. According to the univariate Cox regression analysis, age, N stage, M stage, American Joint Committee on Cancer stage, and exosome-related risk model were independent factors in predicting prognosis (P < .05). In the multivariate Cox regression analysis, age, M stage, and exosome-related risk model were independent prognostic variables (Table 2).
Table 2.
The univariate and multivariate Cox analyses results of overall survival (OS) related factors.
| Characteristics | Hazard ratio | CI95 | P value | Hazard ratio | CI95 | P value |
|---|---|---|---|---|---|---|
| Age | 1.02 | 1.01–1.03 | .001 | 1.02 | 1.01–1.04 | <.001 |
| Gender | 1.29 | 0.95–1.75 | .098 | NA | NA | NA |
| T stage | 1.9 | 0.97–3.72 | .061 | NA | NA | NA |
| N stage | 0.59 | 0.44–0.8 | .001 | 1.04 | 0.55–1.98 | .904 |
| M stage | 5.23 | 3.63–7.53 | <.001 | 2.5 | 1.07–5.85 | .035 |
| AJCC stage | 2.1 | 1.71–2.6 | <.001 | 1.38 | 0.74–2.54 | .308 |
| Risk model | 2.72 | 2.26–3.27 | <.001 | 2.26 | 1.87–2.74 | <.001 |
AJCC = American Joint Committee on Cancer.
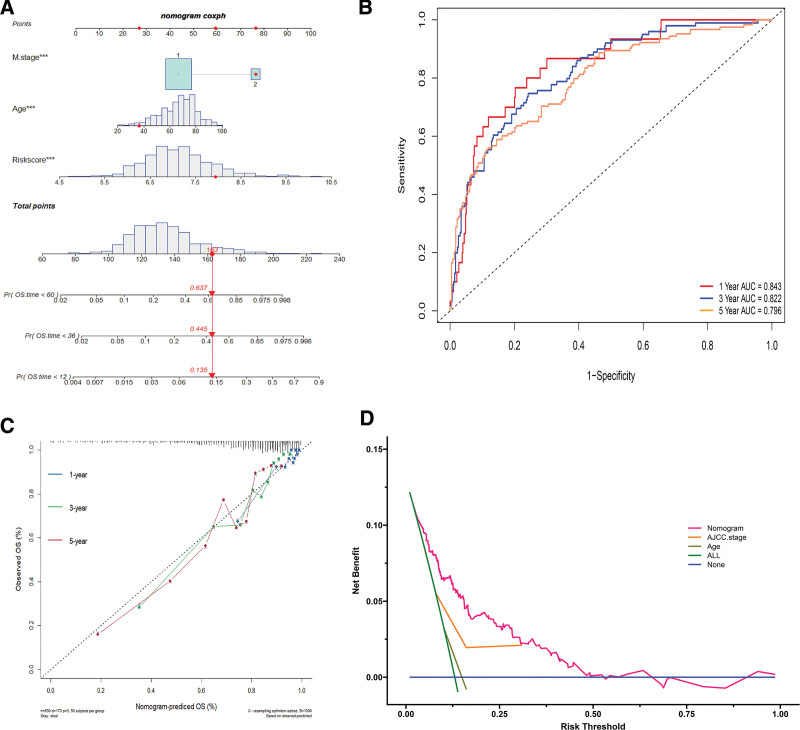
The nomogram was constructed by merging the selected factors to predict the 1-, 3-, and 5-year survival of CRC patients (Fig. 6A). AUCs of the 1-, 3-, and 5-year OS were 0.843, 0.822, and 0.796, respectively (Fig. 6B). The C-index of the nomogram was 0.766. According to the calibration curves, the survival rate predicted by the nomogram was closely related to the actual survival rate (Fig. 6C). Moreover, decision curve analysis was performed as shown in Figure 6D.
Figure 6.
The construction and assessment of the nomogram. (A) The nomogram to predict the 1-, 3-, and 5-yr survival of colorectal cancer (CRC) patients. (B) Time-dependent receiver operating characteristic (ROC) curves for 1-, 3-, and 5-yr overall survival (OS) predictions by the nomogram. (C) The calibration curves for predicting 1-, 3-, and 5-yr OS by the nomogram. The closer the distance from the colored solid lines to the dotted line, the better the consistency between the predicted results and the actual results. (D) Of the nomogram, age, and AJCC stage, which showed the nomogram performed better clinical benefit than AJCC stage and age. AJCC = American Joint Committee on Cancer.
3.5. Evaluation of immune cell-infiltrating characteristics
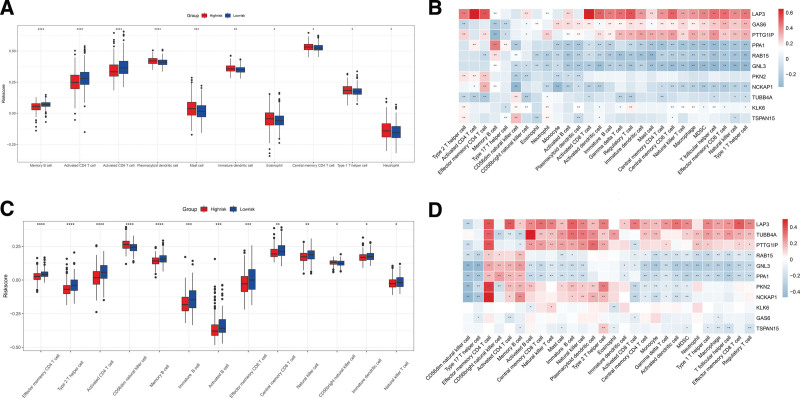
Tumor proliferation and metastasis are closely associated with the tumor microenvironment (TME), especially immune-infiltrating cells. Therefore, the ssGSEA algorithm was used to investigate differences in immune cell infiltration between the high- and low-risk groups. Memory B cells, activated CD4 T cells, and activated CD8 T cells exhibited markedly increased infiltration in the low-risk group, whereas plasmacytoid dendritic cells, mast cells, immature dendritic cells, and other 3 immune cell subtypes presented increased infiltration in the high-risk group (Fig. 7A). We then analyzed the correlation between these 11 genes and immune-infiltrating cells (Fig. 7B). LAP3, GAS6, PTTG1IP, PPA1, RAB15, GNL3, NCKAP1, and KLK6 genes were highly correlated with most immune-infiltrating cells. In the validation set, ssGSEA revealed that effector memory CD4 T cells, type 2 helper cells, activated CD4 T cells and memory B cells differed significantly in the high-risk and low-risk groups (Fig. 7C). LAP3, TUBB4A, PTTG1IP, GAS6, PPA1, RAB15, GNL3, NCKAP1, and KLK6 genes exhibited a high correlation with most immune-infiltrating cells (Fig. 7D).
Figure 7.
Correlation between exosome-related risk model and immune microenvironment. (A) Differences in 28 immune infiltration cells between high- and low-risk groups in the training set. (B) The correlation between each exosome-related gene and each immune infiltration cell type in the training set. (C) Differences in 28 immune infiltration cells between high- and low-risk groups in the validation set. (D) The correlation between each exosome-related gene and each immune infiltration cell type in the validation set. (*P < .05; **P < .01; ***P < .001; ****P < .0001).
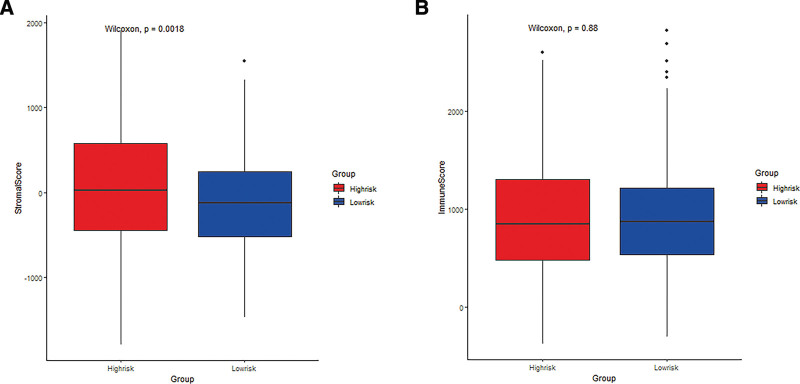
Additionally, the stromal and immune scores in the training set were calculated on the basis of the ESTIMATE algorithm, which displayed that the proportion of stroma cells was higher in the high-risk group than in the low-risk group (Fig. 8A and B).
Figure 8.
The difference of stromal purity and immune between high- and low-risk groups. (A) The difference in stromal purity. (B) The difference in immune score.
3.6. Correlation between the risk model and immune checkpoint molecules
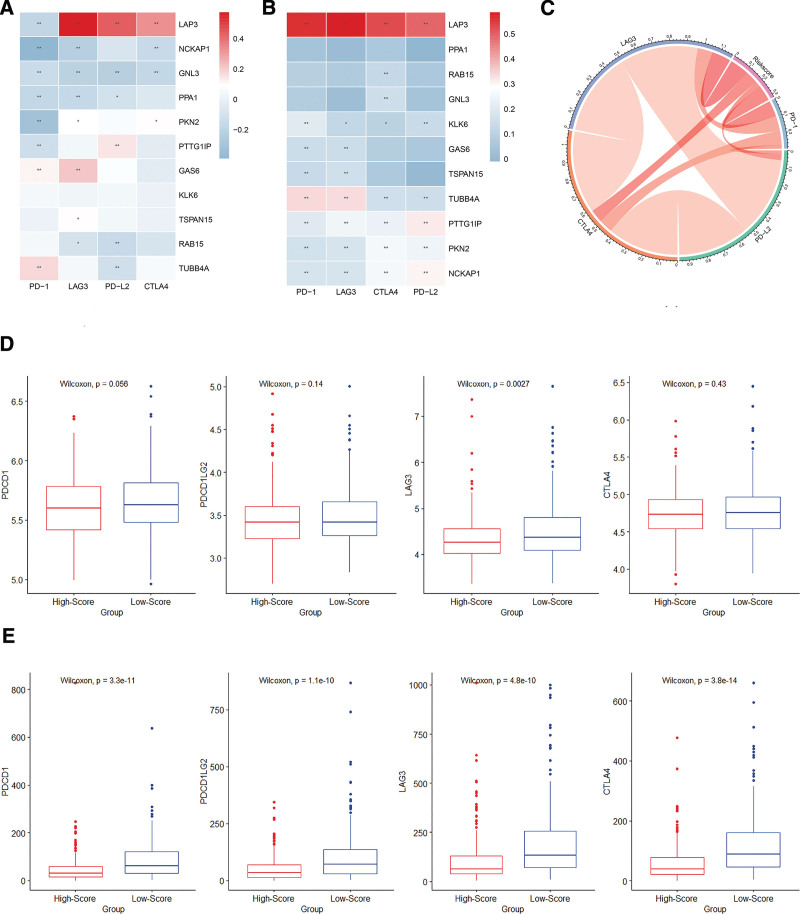
By conducting Spearman correlation analysis, we explored the correlation between the expression of the 11 exosome-related genes and immune checkpoint molecules including PD-1 (PDCD1), PD-L2 (PDCD1LG2), LAG3, and CTLA-4. LAP3 expression was positively correlated with most immune checkpoint molecules (Fig. 9A and B). Figure 9C reveals that the exosome-related gene risk model correlated with the expression of immune checkpoint molecules. As shown in the chord plot, the exosome-related risk model correlated with the expression of immune checkpoint molecules such as PD-1, CTLA-4, and LAG3. In both training and validation sets, the expression levels of the immune checkpoint molecules were lower in the high-risk group than in the low-risk group, although some differences exhibited no statistical significance (Fig. 9D–E). Because of the difference between the results of the training and validation sets, we used the GSE17536 dataset for verification (Supplement Fig. 2, http://links.lww.com/MD/K74). The results revealed a significant correlation between the risk model and the expression of immune checkpoint molecules.
Figure 9.
Correlation between the risk model and immune checkpoint molecules. (A and B) The correlation between the eleven exosome-related genes and immune checkpoint molecules in the training and validation sets (*P < .05; **P < .01). (C) Chord plot of the correlation between exosome-related risk model and immune checkpoint molecules. (D and E) The expression levels of immune checkpoint molecules in high-risk and low-risk groups of training and validation sets.
3.7. The value of the risk model in predicting the immunotherapeutic response
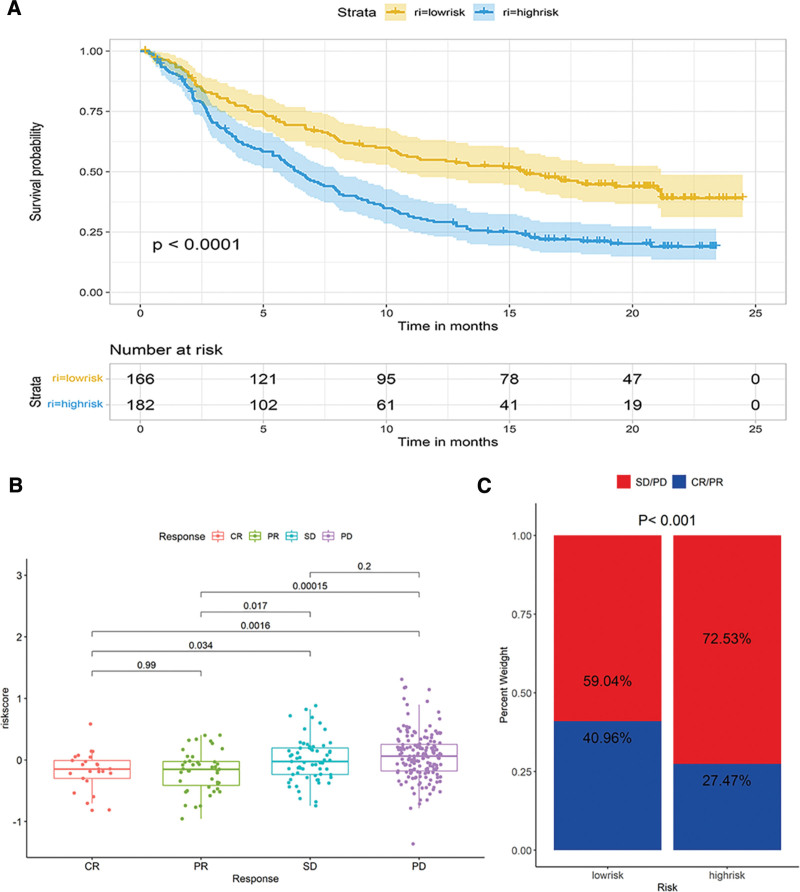
The IMVigor210 cohort consisted of the clinical data of patients with advanced urothelial carcinoma anti–PD-L1 immunotherapy. We investigated the ability of the exosome-related risk model in predicting patients’ responses to anti–PD-L1 immunotherapy in the IMvigor210 cohort. The exosome-related model exhibited a remarkable value in predicting OS. The low-risk group exhibited a significantly longer OS than the high-risk group (Fig. 10A). Figure 10B presented the differences in risk scores in different anti-PD-L1 clinical response groups. Patients with a complete or partial response exhibited lower risk scores, whereas those with a stable or progressive disease had higher risk scores. A significantly enhanced clinical response was noted in the low-risk group than in the high-risk group (40.96% vs 27.47%, Chi-square test, P < .001, Fig. 10C).
Figure 10.
The ability of the exosome-related risk model in predicting patients’ responses to anti–PD-L1 immunotherapy. (A) Kaplan–Meier (K–M) survival analysis for high- and low-risk groups in IMVigor210 cohort. (B) The differences of risk scores in different anti-PD-L1 clinical response groups. (C) The proportion of patients with different responses to PD-L1 immunotherapy in high- and low-risk groups.
3.8. Relationships between the exosome-related risk model and chemotherapy drug sensitivity
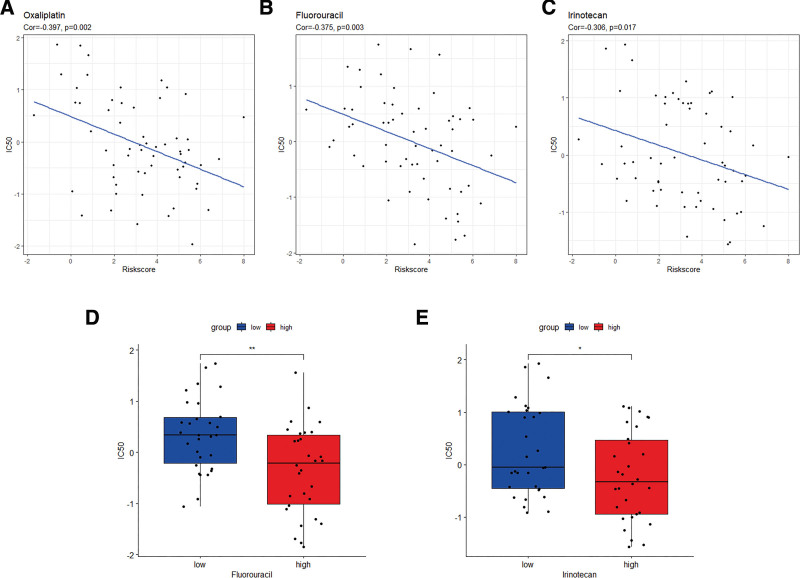
The CellMiner database was used to evaluate the difference in drug sensitivity between the high- and low-risk groups to ensure higher accuracy of treatment. The exosome-related risk scores of NCI60 cell lines were calculated, and the relationship between the scores and the IC50 of the 218 FDA-approved drugs across cell lines was analyzed (Supplement Table 2, http://links.lww.com/MD/K75). Consequently, several common chemotherapeutic drugs for CRC including oxaliplatin, fluorouracil, and irinotecan appeared to be significantly correlated with the exosome-related risk score (|Pearson correlation| > 0.3 and P < .05) (Fig. 11A–C). Notably, a high-risk score was linked to a lower IC50 of fluorouracil (Wilcoxon test, P < .01) and irinotecan (Wilcoxon test, P < .05) (Fig. 11D–E). These findings suggested that the exosome-related risk model was likely to be used as a predictor of chemotherapeutic drug sensitivity. Furthermore, we analyzed the relationship between the 11 exosome-related genes and drug sensitivity (Supplement Fig. 3, http://links.lww.com/MD/K76). Among them, significant negative correlations were noted among PTTG1IP and NCKAP1 and IC50 of key chemotherapeutic drugs in CRC.
Figure 11.
The exosome-related risk model as a predictor of chemotherapeutic drug sensitivity. (A–C) The half maximal inhibitory concentration (IC50) value of the chemotherapeutic drugs for colorectal cancer (CRC) (oxaliplatin, fluorouracil, and irinotecan) appeared to associate significantly with the exosome-related risk score. (D and E) The high-risk group showed a lower IC50 for fluorouracil and irinotecan (*P < .05; **P < .01).
4. Discussion
CRC is a common malignant tumor that causes cancer-related deaths worldwide.[16,17] Developing new biomarkers is a crucial strategy for effectively reducing mortality and improving the survival rate of CRC.
With the further understanding of exosomes, several studies have indicated that exosomes can be used as biomarkers in the diagnosis, prognosis, and treatment of tumor patients.[18,19] For example, a diagnostic gene model based on 6 exosome-related genes was established to diagnose CRC through bioinformatics analysis.[20] However, the prognostic value of the exosome-related gene risk model in CRC remained unclear.
In our study, LAP3, RAB15, GNL3, TSPAN15, PPA1 were selected as protective factors, while GAS6, PTTG1IP, PKN2, NCKAP1, TUBB4A, and KLK6 were risk factors.
LAP3 is an exopeptidase that could catalyze peptide substrates or the amino termini of protein hydrolysis https://www.sciencedirect.com/science/article/pii/S0141813014006977?via%3Dihub-bib0040. High LAP3 expression might increase the chance of survival of patients with diffuse large B cell lymphoma.[21] LAP3 mediated IFN-γ-induced arginine depletion to malignant transformation of bovine mammary epithelial cells.[22] LAP3 knockdown reduced the efficacy of melphalan flufenamide, a drug efficient against breast cancer cells in vitro and in vivo.[23] RAB15 exhibited a significant association with the metabolic CMS3 subtype and cell cycle regulation. Moreover, the correlation between RAB15 and tumor mutation burden was not significant.[24] GNL3 was selected as a predictor of the potential prognostic model in prostate cancer.[25] TSPAN15 expression was lower in COAD than in normal tissue. TSPAN15 was highly expressed in B cells, CD8 T cells, CD4 T cells, alpha-beta T cells, and gamma-delta T cells.[26] PPA1 could serve as an activator of PI3K/AKT/GSK3β/Slug-mediated breast cancer progression and was a potential therapeutic target for inhibiting tumor progression.[27] GAS6 plays a crucial role in promoting epithelial–mesenchymal transition and metastasis.[28] GAS6 binds to TAM receptors in tumor and immune cells, promoting tumor progression.[29] PTTG1IP was overexpressed in colorectal tumors, particularly in invasive WT p53 and mutant p53 tumors, thus implying that PTTG1IP was particularly significant as a marker for patient survival.[30] The high PKN2 level predicted poor prognosis of gastric cancer patients.[31] NCKAP1 served as a novel biomarker for diagnosing CRC or predicting the prognosis of CRC metastasis. Inhibition of NCKAP1 expression in CRC cell lines could inhibit cancer cell migration and invasion.[32] The high TUBB4A expression level was associated with aggressive prostate cancers and poor patient survival.[33] KLK6 exhibited a clinical utility and a prognostic value as a biomarker for CRC because its expression in CRC correlated significantly with the tumor stage, tumor grade, advanced Dukes’ stage, liver metastasis, and poor prognosis.[34]
In our research, we used the ssGSEA algorithm to investigate the differences in immune cell infiltration. The low-risk group with a better prognosis exhibited more abundance of memory B cells, activated CD8 T cells, activated B cells, and effector memory CD4 T cells than the high-risk group, and thus possessed higher anti-tumor immunity. By contrast, the high-risk group with poor prognosis exhibited a higher infiltration abundance of immature dendritic cells and mast cells in the training set. Dendritic cells are professional antigen-presenting cells that orchestrate innate and adaptive immunity during infections, autoimmune diseases, and malignancies.[35]
Stromal and immune cells from the TME are vital for tumorigenesis and tumor progression, associated with CRC patient prognosis. We here used the ESTIMATE algorithm to calculate immune and stromal scores. The low-risk group had a lower stromal score than the high-risk group, whereas the immune scores exhibited no difference.
Immune checkpoint molecules play a crucial role in carcinogenesis by promoting tumor immunosuppression. PD-1 and CTLA-4 are the most commonly studied immune checkpoint molecules because of their overexpression and abundance in various solid tumors and hematological malignancies.[36] CRC patients with higher PD-1, PD-L2, and CTLA-4 expression will benefit more from immune checkpoint inhibition therapies.[37] In this study, the expression of immune checkpoints such as PD-1, PD-L2, LAG3, and CTLA-4 was significantly correlated with LAP3 expression. Additionally, the low-risk group exhibited higher expression levels of immune checkpoint molecules, and thus, patients with lower-risk scores might benefit more from immunotherapy.
Based on the CellMiner database, oxaliplatin, fluorouracil, and irinotecan were found to have significant correlations with the exosome-related risk score. Among the selected exosome-related genes, significant negative correlations were observed between PTTG1IP and NCKAP1 and the IC50 of key chemotherapeutic drugs in CRC. The PTTG1IP gene expression level could serve as a predictor of the non-response of tyrosine kinase inhibitors in chronic myeloid leukemia.[38] In skin basal cell carcinoma, circ_NCKAP1 knockdown markedly inhibited cell proliferation, whereas promoted cell apoptosis.[39]
In the IMvigor210 cohort, the exosome-related risk model generated a consistent result. Low-risk patients had a better therapeutic benefit than high-risk patients, which indicated that the exosome-related risk model was of great value in predicting patients’ responses to anti–PD-L1 immunotherapy.
Additionally, the high-risk group had a lower IC50 value for fluorouracil and irinotecan than the low-risk group, which meant their sensitivity to these drugs was higher. Therefore, the exosome-related risk model could potentially predict the response to immunotherapy and drug sensitivity.
Our study has some limitations. First, our study was based on data from public databases. Data from further experiments on these genes in cellular and animal models, as well as clinical studies, might have been more valuable. In addition, our risk model was established only using exosome-related genes, whereas some other hot and effective biomarker genes were absent.
5. Conclusions
In conclusion, our study established and validated an exosome risk model consisting of 11 exosome-related genes associated with immune infiltration. The constructed model could serve as an independent biomarker for predicting the prognosis of CRC patients and evaluating the immune cell infiltration level in the TME.
Acknowledgments
We appreciate the platforms that the gene expression omnibus and TCGA databases provide and the contributors for their valuable datasets. Besides, we thank Dr Jianming Zeng (University of Macau), and all members of his bioinformatics team and biotrainee for generously sharing their experience and codes.
Author contributions
Conceptualization: Li Yao.
Data curation: Huan Shao.
Funding acquisition: Xuan Huang.
Validation: Huan Shao, Ye Tao.
Visualization: Huan Shao, Li Yao.
Writing – original draft: Huan Shao, Li Yao.
Writing – review & editing: Xuan Huang.
Supplementary Material
Abbreviations:
- AJCC
- American Joint Committee on Cancer
- AUCs
- area under the ROC curves
- C-index
- concordance index
- CRC
- colorectal cancer
- IC50
- half maximal inhibitory concentration
- K–M
- Kaplan–Meier
- OS
- overall survival
- ssGSEA
- single-sample gene set enrichment analysis
- TCGA
- the cancer genome atlas
The datasets generated during and/or analyzed during the current study are publicly available.
Data in this study were derived from the publicly available database hence it was not applicable for additional ethical approval.
This work was supported by the Traditional Chinese Medicine Science and Technology Key Program of Zhejiang Province of China (No. 2021ZZ013).
Supplemental Digital Content is available for this article.
The authors have no conflicts of interest to disclose.
How to cite this article: Shao H, Yao L, Tao Y, Huang X. Identification and verification of an exosome-related gene risk model to predict prognosis and evaluate immune infiltration for colorectal cancer. Medicine 2023;102:40(e35365).
Contributor Information
Huan Shao, Email: shaoxiaohuan02@163.com.
Li Yao, Email: yaolifac@163.com.
Ye Tao, Email: ty2100519792@163.com.
References
- [1].Sung H, Ferlay J, Siegel RL, et al. Global cancer statistics 2020: GLOBOCAN estimates of incidence and mortality worldwide for 36 cancers in 185 countries. CA Cancer J Clin. 2021;71:209–49. [DOI] [PubMed] [Google Scholar]
- [2].Zygulska AL, Pierzchalski P. Novel diagnostic biomarkers in colorectal cancer. Int J Mol Sci. 2022;23:852. [DOI] [PMC free article] [PubMed] [Google Scholar]
- [3].Weng J, Li S, Zhu Z, et al. Exploring immunotherapy in colorectal cancer. J Hematol Oncol. 2022;15:95. [DOI] [PMC free article] [PubMed] [Google Scholar]
- [4].Jin Z, Sinicrope FA. Mismatch repair-deficient colorectal cancer: building on checkpoint blockade. J Clin Oncol. 2022;40:2735–50. [DOI] [PMC free article] [PubMed] [Google Scholar]
- [5].Paskeh MDA, Entezari M, Mirzaei S, et al. Emerging role of exosomes in cancer progression and tumor microenvironment remodeling. J Hematol Oncol. 2022;15:83. [DOI] [PMC free article] [PubMed] [Google Scholar]
- [6].Xu Z, Zeng S, Gong Z, et al. Exosome-based immunotherapy: a promising approach for cancer treatment. Mol Cancer. 2020;19:160. [DOI] [PMC free article] [PubMed] [Google Scholar]
- [7].Zhou H, Zhu L, Song J, et al. Liquid biopsy at the frontier of detection, prognosis and progression monitoring in colorectal cancer. Mol Cancer. 2022;21:86. [DOI] [PMC free article] [PubMed] [Google Scholar]
- [8].Li MY, Liu LZ, Dong M. Progress on pivotal role and application of exosome in lung cancer carcinogenesis, diagnosis, therapy and prognosis. Mol Cancer. 2021;20:22. [DOI] [PMC free article] [PubMed] [Google Scholar]
- [9].Keerthikumar S, Chisanga D, Ariyaratne D, et al. ExoCarta: a web-based compendium of exosomal cargo. J Mol Biol. 2016;428:688–92. [DOI] [PMC free article] [PubMed] [Google Scholar]
- [10].Yu G, Wang LG, Han Y, et al. clusterProfiler: an R package for comparing biological themes among gene clusters. OMICS J Integr Biol. 2012;16:284–7. [DOI] [PMC free article] [PubMed] [Google Scholar]
- [11].Charoentong P, Finotello F, Angelova M, et al. Pan-cancer immunogenomic analyses reveal genotype-immunophenotype relationships and predictors of response to checkpoint blockade. Cell Rep. 2017;18:248–62. [DOI] [PubMed] [Google Scholar]
- [12].Hänzelmann S, Castelo R, Guinney J. GSVA: gene set variation analysis for microarray and RNA-seq data. BMC Bioinf. 2013;14:7. [DOI] [PMC free article] [PubMed] [Google Scholar]
- [13].Yoshihara K, Shahmoradgoli M, Martínez E, et al. Inferring tumour purity and stromal and immune cell admixture from expression data. Nat Commun. 2013;4:2612. [DOI] [PMC free article] [PubMed] [Google Scholar]
- [14].Mariathasan S, Turley SJ, Nickles D, et al. TGFβ attenuates tumour response to PD-L1 blockade by contributing to exclusion of T cells. Nature. 2018;554:544–8. [DOI] [PMC free article] [PubMed] [Google Scholar]
- [15].Shankavaram UT, Varma S, Kane D, et al. CellMiner: a relational database and query tool for the NCI-60 cancer cell lines. BMC Genomics. 2009;10:277. [DOI] [PMC free article] [PubMed] [Google Scholar]
- [16].Kumar R, Harilal S, Carradori S, et al. A comprehensive overview of colon cancer- a grim reaper of the 21st century. Curr Med Chem. 2021;28:2657–96. [DOI] [PubMed] [Google Scholar]
- [17].Zhang S, Ji WW, Wei W, et al. Long noncoding RNA Meg3 sponges miR-708 to inhibit intestinal tumorigenesis via SOCS3-repressed cancer stem cells growth. Cell Death Dis. 2021;13:25. [DOI] [PMC free article] [PubMed] [Google Scholar]
- [18].Yu D, Li Y, Wang M, et al. Exosomes as a new frontier of cancer liquid biopsy. Mol Cancer. 2022;21:56. [DOI] [PMC free article] [PubMed] [Google Scholar]
- [19].Zhao L, Wang H, Fu J, et al. Microfluidic-based exosome isolation and highly sensitive aptamer exosome membrane protein detection for lung cancer diagnosis. Biosens Bioelectron. 2022;214:114487. [DOI] [PubMed] [Google Scholar]
- [20].Lei T, Zhang Y, Wang X, et al. A diagnostic model using exosomal genes for colorectal cancer. Front Genet. 2022;13:863747. [DOI] [PMC free article] [PubMed] [Google Scholar]
- [21].Feng P, Li H, Pei J, et al. Identification of a 14-gene prognostic signature for Diffuse Large B Cell Lymphoma (DLBCL). Front Genet. 2021;12:625414. [DOI] [PMC free article] [PubMed] [Google Scholar]
- [22].Li L, Li F, Hu X, et al. LAP3 contributes to IFN-γ-induced arginine depletion and malignant transformation of bovine mammary epithelial cells. BMC Cancer. 2022;22:864. [DOI] [PMC free article] [PubMed] [Google Scholar]
- [23].Schepsky A, Traustadottir GA, Joelsson JP, et al. Melflufen, a peptide-conjugated alkylator, is an efficient anti-neo-plastic drug in breast cancer cell lines. Cancer Med. 2020;9:6726–38. [DOI] [PMC free article] [PubMed] [Google Scholar]
- [24].Jiang X, Yang L, Gao Q, et al. The role of RAB GTPases and its potential in predicting immunotherapy response and prognosis in colorectal cancer. Front Genet. 2022;13:828373. [DOI] [PMC free article] [PubMed] [Google Scholar]
- [25].Kobelyatskaya AA, Pudova EA, Snezhkina AV, et al. Impact TMPRSS2-ERG molecular subtype on prostate cancer recurrence. Life (Basel). 2021;11:588. [DOI] [PMC free article] [PubMed] [Google Scholar]
- [26].Huang R, Sun H, Lin R, et al. The role of tetraspanins pan-cancer. iScience. 2022;25:104777. [DOI] [PMC free article] [PubMed] [Google Scholar]
- [27].Guo C, Li S, Liang A, et al. PPA1 promotes breast cancer proliferation and metastasis through PI3K/AKT/GSK3β signaling pathway. Front Cell Dev Biol. 2021;9:730558. [DOI] [PMC free article] [PubMed] [Google Scholar]
- [28].Ghafouri-Fard S, Khoshbakht T, Taheri M, et al. A review on the role of GAS6 and GAS6-AS1 in the carcinogenesis. Pathol Res Pract. 2021;226:153596. [DOI] [PubMed] [Google Scholar]
- [29].Wu G, Ma Z, Cheng Y, et al. Targeting Gas6/TAM in cancer cells and tumor microenvironment. Mol Cancer. 2018;17:20. [DOI] [PMC free article] [PubMed] [Google Scholar]
- [30].Read ML, Seed RI, Modasia B, et al. The proto-oncogene PBF binds p53 and is associated with prognostic features in colorectal cancer. Mol Carcinog. 2016;55:15–26. [DOI] [PubMed] [Google Scholar]
- [31].Li J, Dong W, Jiang Q, et al. LINC00668 cooperated with HuR dependent upregulation of PKN2 to facilitate gastric cancer metastasis. Cancer Biol Ther. 2021;22:311–23. [DOI] [PMC free article] [PubMed] [Google Scholar]
- [32].Kwon MR, Lee JH, Park J, et al. NCK-associated protein 1 regulates metastasis and is a novel prognostic marker for colorectal cancer. Cell Death Discovery. 2023;9:7. [DOI] [PMC free article] [PubMed] [Google Scholar]
- [33].Gao S, Wang S, Zhao Z, et al. TUBB4A interacts with MYH9 to protect the nucleus during cell migration and promotes prostate cancer via GSK3β/β-catenin signalling. Nat Commun. 2022;13:2792. [DOI] [PMC free article] [PubMed] [Google Scholar]
- [34].Bouzid H, Soualmia F, Oikonomopoulou K, et al. Kallikrein-related peptidase 6 (KLK6) as a contributor toward an aggressive cancer cell phenotype: a potential role in colon cancer peritoneal metastasis. Biomolecules. 2022;12:1003. [DOI] [PMC free article] [PubMed] [Google Scholar]
- [35].Kvedaraite E, Ginhoux F. Human dendritic cells in cancer. Sci Immunol. 2022;7:eabm9409. [DOI] [PubMed] [Google Scholar]
- [36].Zhang H, Dai Z, Wu W, et al. Regulatory mechanisms of immune checkpoints PD-L1 and CTLA-4 in cancer. J Exp Clin Cancer Res. 2021;40:184. [DOI] [PMC free article] [PubMed] [Google Scholar]
- [37].Kitsou M, Ayiomamitis GD, Zaravinos A. High expression of immune checkpoints is associated with the TIL load, mutation rate and patient survival in colorectal cancer. Int J Oncol. 2020;57:237–48. [DOI] [PMC free article] [PubMed] [Google Scholar]
- [38].Christiani E, Naumann N, Weiss C, et al. Gene expression pattern of ESPL1, PTTG1 and PTTG1IP can potentially predict response to TKI first-line treatment of patients with newly diagnosed CML. Cancers (Basel). 2023;15:2652. [DOI] [PMC free article] [PubMed] [Google Scholar]
- [39].Fan ZX, Xi W, Miao XY, et al. Circ_NCKAP1 promotes skin basal cell carcinoma progression by sponging the miR-148b-5p/HSP90 axis. Eur Rev Med Pharmacol Sci. 2021;25:5355–64. [DOI] [PubMed] [Google Scholar]


