

Abstract
Although current long-read sequencing technologies have a long-read length that facilitates assembly for genome reconstruction, they have high sequence errors. While various assemblers with different perspectives have been developed, no systematic evaluation of assemblers with long reads for diploid genomes with varying heterozygosity has been performed. Here, we evaluated a series of processes, including the estimation of genome characteristics such as genome size and heterozygosity, de novo assembly, polishing, and removal of allelic contigs, using six genomes with various heterozygosity levels. We evaluated five long-read-only assemblers (Canu, Flye, miniasm, NextDenovo and Redbean) and five hybrid assemblers that combine short and long reads (HASLR, MaSuRCA, Platanus-allee, SPAdes and WENGAN) and proposed a concrete guideline for the construction of haplotype representation according to the degree of heterozygosity, followed by polishing and purging haplotigs, using stable and high-performance assemblers: Redbean, Flye and MaSuRCA.
Keywords: de novo assembly, genome sequencing, long-read sequencing, heterozygosity, purging allelic sequences, assembly evaluation
INTRODUCTION
The advent of third-generation sequencing technologies, represented by Pacific Biosciences (PacBio) and Oxford Nanopore Technologies (Nanopore), has allowed for very long de novo assemblies of complex genomes, including that of eukaryotic diploids [1]. These technologies produce long nucleotide sequence reads by reading long single-molecule nucleic acids [2]. According to the manufacturers’ websites, the average read length and total amount of the read length for PacBio (Sequel, SMRT Cell 1 M) are 30 kb and 20 Gb, respectively, while those for Nanopore (MinION) are up to 4 Mb and 50 Gb, respectively. Therefore, they have been used for de novo assembly of challenging genomes with high heterozygosity [3], repetitive regions [4], large size [5] or high ploidy [6]. However, they produce higher sequencing error rates (5–15%) [7] than Illumina short reads (0.3%) [8]. Hence, most recent assemblers have applied the hierarchical approach to correct long-read errors by detecting sequence errors from alignments between long-reads of the same sample before assembly [9]. Even after long-read-based assembly, the assembled sequences are further polished with Illumina short reads [3, 10–13]. Several polishing tools, including Pilon, POLCA and NextPolish, correct sequence errors in the assembled sequences with long reads and/or Illumina short reads [14–16]. Recently, PacBio offered a high-fidelity (HiFi) read technology, which produces an average 13.5 kb [17] of highly accurate (99.9%) reads (https://www.pacb.com/technology/hifi-sequencing/). Consequently, more de novo genome assemblers for the HiFi reads were developed [18, 19]. However, since HiFi sequencing is costlier than standard long-read sequencing, genome assembly using conventional long-read technology is preferred [20–22].
De novo assemblers for long reads are classified into long-read-only assemblers (e.g. Canu [23], Flye [24], miniasm [25], NextDenovo (https://github.com/Nextomics/NextDenovo) and Redbean [26]) and hybrid assemblers that use short and long reads (e.g. HASLR [27], MaSuRCA [28], Platanus-allee [29], SPAdes [30] and WENGAN [31]). Hybrid assemblers use two methods: (i) First correct long reads with short reads and then assemble with the corrected long reads (e.g. MaSuRCA) and (ii) Assemble short reads into contigs and then construct the scaffolds from the generated contigs with long reads (e.g. HASLR, Platanus-allee, SPAdes and WENGAN). However, obtaining the best-assembled sequences utilizing all the assemblers is challenging owing to the limited computational resources and time spent for analysing, despite the use of cluster servers.
Although de novo assemblers have been developed for diploids, including FALCON Unzip [32], Canu, Platanus-allee and Platanus [33], diploid genome assembly remains challenging. The contig set from de novo assembly, composed of one sequence pattern between homologous chromosomes and the sequence of the hemizygous region, is the desired haploid representation. However, highly heterozygous regions are not recognized as homologous regions of two chromosomes by any assemblers and are thus assembled separately. Therefore, the assembly size will be larger than the actual genome size [34]. Some tools that distinguish allelic sequences (haplotigs) from homologous regions have been developed to solve this problem, including Purge Haplotig [34], purge_dups [35] and HaploMerger2 [36].
We evaluated assemblers based on computer resource usage (execution time and memory usage), continuity, and completeness using six genomes with various heterozygosity levels and proposed a concrete guideline for the construction of haplotype representation according to the degree of heterozygosity. The optimal genome-assembler combination is influenced by heterozygosity, repeats, genome size, as well as research purposes. Therefore, our guidelines are intended to help users select and further modify the best method to suit their genome characteristics and research purposes.
MATERIALS AND METHODS
Collecting the datasets for evaluation
Since we focused on how heterozygosity affects genome assembly, we collected sets of genomes with varying levels of heterozygosity. The six available genomes of Arabidopsis thaliana accession C24 [10], Nitzschia putrida strain NIES-4239 [37], Lates calcarifer [38], Solanum sitiens [11], A. thaliana F1 cross of Col-0 and Cvi-0 [32] and Crassostrea gigas [3] were used. Their PacBio subreads and Illumina paired-end data of whole-genome sequencing were downloaded from the public archive Sequence Read Archive of European Nucleotide Archive (ENA) [39] (Table 1). The sequencing data of the six genomes have PacBio coverage ≥39x and Illumina coverage ≥60x. For the L. calcarifer PacBio subreads, 223x out of 247x were retrieved since they are sufficient to gain PacBio coverage >39x.
Table 1.
Summary of input datasets
| Organism | Heterozygosity (%) | Genome size (Mb) | Repeat (%) | BioSample | PacBio coverage (X) | Illumina coverage (X) | Illumina trimmed coverage (X) |
|---|---|---|---|---|---|---|---|
| A. thaliana C24 | 0.055 | 125 | 15.8 | SAMEA5751959 | 49 | 60 | 58 |
| N. putrida NIES-4239 | 0.336 | 32 | 8.7 | SAMD00232021 | 39 | 3082 | 2940 |
| Lates calcarifer | 0.479 | 552 | 2.8 | SAMN04026617 | 223a | 102 | 94 |
| S. sitiens | 0.847 | 906 | 43.9 | SAMN14932980 | 56 | 190 | 178 |
| A. thaliana F1 cross of Col-0 and Cvi-0 | 1.040 | 119 | 13.3 | SAMN04539663 | 332 | 68 (26)b | 66 |
| C. gigas | 3.000 | 487 | 28.6 | SAMEA6259236 | 112 | 82 | 77 |
aThe following no data were used for de novo assembly, as the amount of data was sufficient. (SRR3224582, SRR3224583, SRR3224584, SRR3224585, SRR3224586, SRR3224587, SRR3224588, SRR3224589, SRR3224590, SRR3224591, SRR3224593, SRR3224595, SRR3224596, SRR3224597, SRR3224598, SRR3224599, SRR3224602, SRR3224603, SRR3224604, SRR3224605, SRR3224606, SRR3224607, SRR3224608, SRR3224609, SRR3224610, SRR3224612, SRR3224615, SRR3224617, SRR3224618, SRR3224619, SRR3224620, SRR3224621, SRR3224622, SRR3224623, SRR3224624, SRR3224625, SRR3224626, SRR3224627, SRR3224628, SRR3224629, SRR3224630, SRR3224631, SRR3224632, SRR3224633, SRR3224634, SRR3224635, SRR3224636, SRR3224637, SRR3224638, SRR3224639, SRR3224640, SRR3224641, SRR3224642, SRR3224643, SRR3224644, SRR3224645, SRR3224646, SRR3224647, SRR3224648, SRR3224649, SRR3224650, SRR3224651, SRR3224652, SRR3224653, SRR3224654, SRR3224655, SRR3224656, SRR3224657, SRR3224658, SRR3224659, SRR3224660, SRR3224661, SRR3224662, SRR3224663, SRR3224664, SRR3224665, SRR3224666, SRR3224667, SRR3224668, SRR3224669, SRR3224670, SRR3224671, SRR3224672, SRR3224673, SRR3224674, SRR3224675, SRR3224676, SRR3224677, SRR3224678, SRR3224679, SRR3224680, SRR3224681, SRR3224682, SRR3224683, SRR3224684, SRR3224685, SRR3224686)
bIllumina data in SRA of A. thaliana F1 include reads with a variety of lengths. Therefore, only reads that were 250 bp length were extracted and used for the MaSuRCA assembler.
Analytical processes
The stepwise analytical processes for the construction of haploid representation comprised four processes: estimation of genome characteristics (such as genome size, heterozygosity, and repeat rate), de novo assembly, polishing, and purging of haplotigs (Figure 1). First, the genome characteristics were estimated by obtaining the k-mer counts through Jellyfish v2.2.10 [40] (-C -m 21 -s 1000000000) and using them to estimate the genome characteristics through GenomeScope [41] (k-mer_length = 21 and kmermax = 1000). The estimated genome characteristics were assessed by comparing the genome size with that in the original research.
Figure 1.

Evaluated analytical processes.
De novo assembly was then conducted. Illumina paired-end reads used for the hybrid assembler were trimmed using fastp v0.20.0 [42] (—cut_front —cut_tail option). Thereafter, the assembled sequences that were > 500 b in length were extracted using seqkit v0.15.0 [43]. To polish the extracted assembled sequences, Illumina paired-end reads trimmed in the previous step were mapped to the assembled sequences using bwa v2.2.1 [44], and the result was determined using Pilon v1.24 [14]. The manipulation of SAM/BAM files was performed using SAMtools v1.11 [45]. Then, the haplotigs were removed from the polished sequences through Purge Haplotigs v1.1.1 [34]. The read-depth cut-off parameters for the ‘purge’ command of Purge Haplotigs comprised three types, i.e. ‘low cut-off’ for removing assembly artefacts, ‘midpoint’ for specifying between the haploid and diploid peaks, and ‘high cut-off’ for removing repeats and organelles. These were set (Supplementary Table S1) by referring to the histograms of read-depth to contigs (Supplementary Figure S1) generated using the ‘hist’ command of Purge Haplotigs. Purge Haplotigs outputs three types of FASTA format files: haploid representation (primary sequences), haplotigs and artefacts (comprising assembly artefacts, organelle genome and repeat sequences). The details of the execution commands and configuration options of each tool during the de novo assembly and thereafter are described in the Supplementary Methods. The graph of cumulative length and Nx statistics for contigs were generated using R ver. 4.0.5. Assembly ploidy, a metric that estimates the proportion of allelic sequences present in the assembled genome sequences, was calculated by dividing the total length by the estimated genome size [8].
De novo assemblers
Long-read-only assemblers were Canu (v2.1.1) [23], Flye (v2.8.3) [24], miniasm (v0.3-r179) [25], NextDenovo (v2.4.0) (https://github.com/Nextomics/NextDenovo), and Redbean (v2.5) [26] with PacBio long reads. Hybrid assemblers were HASLR (v0.8a1) [27], MaSuRCA (v4.0.1) [28], Platanus-allee (v2.2.2) [29], SPAdes (v3.15) [30] and WENGAN (v0.2) [31] with both PacBio long reads and Illumina paired-end reads. MaSuRCA and WENGAN assemble using external de novo assemblers. We benchmarked using MaSuRCA_C (CABOG [46]), MaSuRCA_F (Flye) and WENGAN-M (MINIA3 [47]). These long-read-only and hybrid assemblers are summarized in the Supplementary Notes. The assemblers that finished successfully among all six genomes were selected for evaluation. If the execution time exceeded 500 h, it was evaluated as ‘time out’ and not subjected to subsequent analysis or comparison, regardless of the final result.
Platanus-allee generates phased sequences and consensus sequences that are not phased. The other assemblers generate consensus sequences. Herein, the consensus sequences were consistently used for comparison among assemblers. Additionally, Flye, MaSuRCA_F and Platanus-allee output scaffolds, whereas SPAdes and MaSuRCA_C output scaffolds and/or contigs. The other assemblers output contigs but not scaffolds. Therefore, for comparison, we utilized scaffolds from Flye, MaSuRCA_F, Platanus-allee, SPAdes and MaSuRCA_C, as well as contigs from the other tools. Hereafter, both scaffolds and contigs are referred to as ‘contigs’ without distinction.
Evaluation of de novo assemblers
The resultant contigs were evaluated based on continuity and completeness. Contig continuity was evaluated by N50, which is the contig length when 50% of the total contig size is reached, while the assembled contig lengths were added in the longest order. The statistics of assembled contigs were calculated using assembly-stats v1.0.1 (https://github.com/rjchallis/assembly-stats) and Merqury v1.3 [48]. The completeness was measured using Benchmarking Universal Single-Copy Orthologs (BUSCO) analysis ver. 5.0.0 [49]. BUSCO databases used ‘embryophyta_odb10’ for A. thaliana C24 and F1, ‘eukaryota_odb10’ for N. putrida NIES-4239, ‘actinopterygii_odb10’ for L. calcarifer, ‘solanales_odb10’ for S. sitiens, and ‘metazoa_odb10’ for C. gigas. The N50 and BUSCO completeness of polished contigs were ranked for each genome as the best to third best and the worst to third worst. The worst ranking for BUSCO completeness was only used for the percentage of BUSCO completeness, including ‘single-copy’ and ‘duplicated’ if there was a difference of 15 or more from the top value in each genome. The assembler that reached the timeout was ranked as the worst for both N50 and BUSCO completeness. The continuity and completeness scores for each tool were calculated separately for heterozygosity <1 and heterozygosity ≥1 by adding 3 to the best, 2 to second best, 1 to third best, −3 to worst, −2 to second worst, and − 1 to third worst. Based on these scores, the performance of BUSCO completeness and N50 for each assembler was classified as ‘high’, ‘medium’ or ‘low’. The thresholds for each classification were as follows. For heterozygosity <1: high ≥5, 4 ≥ medium ≥ −4 and low ≤ −5 for N50; high ≥5, 4 ≥ medium ≥1 and low ≤0 for BUSCO. For heterozygosity ≥1: high ≥3, 2 ≥ medium ≥ −2, and low ≤ −3 for N50; high ≥4, 3 ≥ medium ≥0 and low ≤ −1 for BUSCO. These classifications of the assemblers by computational resource usage, N50 and BUSCO completeness were used to select the assemblers in the guideline adapted to the degree of heterozygosity. Among the assemblers with similar evaluation, the assembler with the most stable performance for N50 and BUSCO completeness was adopted.
To measure computational usage under the same conditions, all de novo assemblers were utilized on the National Institute of Genetics supercomputer system medium nodes with 10 CPU cores (CPU: Intel Xeon Gold 6148 × 4, 80 core/node). To measure wall-clock time and memory usage, ‘ru_wallclock’ and ‘maxvmem’ reported by the qacct command of the Univa Grid Engine were used. The assemblers were classified as ‘Light’, ‘Medium’ or ‘Heavy’ according to their maximum values of the wall-clock time and memory usage. The classification thresholds for the maximum value of wall-clock time for each tool were Light <50 h, 50 h ≤ Medium <250 h and Heavy ≥250 h. The classification thresholds for the maximum value of memory usage for each tool were Light <50 GB, 50 GB ≤ Medium <400 GB and Heavy ≥400 GB. The assemblers were classified by computational resource usage, including the wall-clock time and memory usage, as a comprehensive evaluation. The thresholds for ‘Light’ and ‘Heavy’ were the maximum value of wall-clock time < 50 h with the maximum value of memory usage <300 GB, and the maximum value of wall-clock time ≥ 250 h or the maximum value of memory usage ≥400 GB, respectively. ‘Medium’ was defined as other than Light or Heavy in this case.
Furthermore, the contigs of Arabidopsis F1 hybrids were evaluated by comparing with the parental haploid sequences, Col-0 (TAIR10) and Cvi-0 [10], using QUAST v5.0.2 [50]. Genome fraction is the percentage of the total number of bases aligned with contigs divided by the reference genome size. NGA50 is similar to N50 but uses the alignment block length and reference genome length instead of the contig length and total contig size for N50. The alignment block lengths are calculated by splitting contigs at misassembly breakpoints. Thus, NGA50 is the alignment block length at 50% of the total reference genome size.
RESULTS
Estimating genome characteristics
GenomeScope was used for all six genomes, and the estimated genome sizes were compared to the original research (Supplementary Table S2). The differences of estimated genome sizes from those of original research ranged from 6 to 27% in GenomeScope. The genome statistics estimated by GenomeScope were 0.055–3.00% heterozygosity, 32–906 Mb genome size and 2.8–43.9% repeats (Table 1).
Assembly and polishing evaluation
Effect of polishing on assembly continuity
Contig statistics of assembly contigs and polished contigs are described in Supplementary Table S3 and Supplementary Table S4, respectively. Even after polishing, the total lengths obtained by almost all the assemblers did not change much from those before polishing (Supplementary Table S5). However, the largest contig length of miniasm for L. calcarifer decreased by 1.84% after polishing. Similarly, after polishing, the total contig length of miniasm for N. putrida NIES-4239 decreased by 1.59% after polishing and that of N50 of miniasm for L. calcarifer decreased by 2.58%. Therefore, polishing has a certain impact on contig length assembly, and we compared the assembly ploidy as well as continuity among the assemblers with polished contigs.
Assembly ploidy and continuity after polishing
As heterozygosity increased, the assembly ploidy of each assembler also increased (Figure 2). The graphs of the cumulative length for contigs are shown in Supplementary Figure S2 and the concrete values of assembly size in Supplementary Table S4. As for the genomes with heterozygosity <0.5, including those of A. thaliana C24, N. putrida NIES-4239, and L. calcarifer, most assemblers show that the assembly ploidies are approximately 1, implying that the total contig sizes almost equal the estimated genome sizes. However, in the S. sitiens genome (heterozygosity, 0.847), the assembly ploidy in miniasm, Platanus-allee and Canu exceeded 1.5. In the A. thaliana F1 genome (heterozygosity, 1.04), miniasm and Canu showed an assembly ploidy of approximately 2. Furthermore, in the C. gigas genome (heterozygosity, 3.00), the assembly ploidy in miniasm, Flye, Canu, MaSuRCA_F and MaSuRCA_C exceeded 2, whereas that in Redbean, NextDenovo, and Platanus-allee exceeded 1.5. In the N. putrida NIES-4239 genome (heterozygosity, <0.5), SPAdes showed a much larger assembly ploidy of 12.90, whereas that of HASLR and WENGAN-M tended to be smaller overall.
Figure 2.


Statistics and BUSCO completeness of polishing and purging haplotigs. (A) A. thaliana C24; (B) N. putrida NIES-4239; (C) Lates calcarifer; (D) S. sitiens; (E) A. thaliana F1; (F) C. gigas. Ploidy column represents ‘assembly ploidy’. BUSCO (C) column represents the entire complete score, including ‘single-copy’ and ‘duplicated’. BUSCO (D) column represents the ‘complete and duplicated’ score.
The values of N50 are indicated in Figure 2; the graphs of the Nx statistics for contigs, in Supplementary Figure S3; and the concrete statistical values, including number of contigs, largest contig length, total length, N50, number of Ns and number of gaps, are listed in Supplementary Table S4. The continuity score, which is obtained by ranking N50 of each genome and summing the values of each rank, calculated for genomes with a heterozygosity <1 and ≥ 1, are indicated in Tables 2A and B, respectively. Consequently, for genomes with a heterozygosity <1, Flye, NextDenovo and MaSuRCA_C were classified as ‘high’; MaSuRCA_F, Platanus-allee, Redbean, miniasm, WENGAN_M and HASLR as ‘medium’; and Canu and SPAdes as ‘low’. For genomes with a heterozygosity ≥1, MaSuRCA_C, NextDenovo and Redbean were classified as ‘high’; Canu, MaSuRCA_F, Flye, Platanus-allee and WENGAN_M as ‘medium’; and HASLR, miniasm and SPAdes as ‘low’. In general, MaSuRCA_C and NextDenovo provided better continuity regardless of heterozygosity in the given genomes, while Flye provided better continuity for genomes with a heterozygosity <1.
Table 2.
Comprehensive evaluation of de novo assemblers A. Continuity and BUSCO completeness (Heterozygosity <1) B. Continuity and BUSCO completeness (Heterozygosity ≥1) C. Computational resource usage
| A | |||
|---|---|---|---|
| Tool | Computer usage | Continuity | BUSCO completeness |
| HASLR | Light-weight tool | Medium (−4) | Low (−1) |
| WENGAN-M | Light-weight tool | Medium (−2) | Low (0) |
| Redbean | Light-weight tool | Medium (−1) | Medium (1) |
| miniasm | Light-weight tool | Medium (−1) | Low (−11) |
| Flye | Medium-weight tool | High (8) | High (5) |
| NextDenovo | Heavy-weight tool | High (8) | Medium (1) |
| SPAdes | Heavy-weight tool | Low (−8) | Medium (3) |
| Platanus-allee | Heavy-weight tool | Medium (−1) | Medium (3) |
| Canu | Heavy-weight tool | Low (−5) | Medium (2) |
| MaSuRCA_F | Heavy-weight tool | Medium (0) | High (10) |
| MaSuRCA_C | Heavy-weight tool | High (6) | High (9) |
| B | |||
| Tool | Computer usage | Continuity | BUSCO completeness |
| HASLR | Light-weight tool | Low (−3) | Low (−4) |
| WENGAN-M | Light-weight tool | Medium (−2) | Low (−3) |
| Redbean | Light-weight tool | High (3) | Medium (0) |
| miniasm | Light-weight tool | Low (−3) | Low (−3) |
| Flye | Medium-weight tool | Medium (0) | Medium (0) |
| NextDenovo | Heavy-weight tool | High (3) | Medium (1) |
| SPAdes | Heavy-weight tool | Low (−4) | Low (−1) |
| Platanus-allee | Heavy-weight tool | Medium (0) | Medium (0) |
| Canu | Heavy-weight tool | Medium (1) | High (5) |
| MaSuRCA_F | Heavy-weight tool | Medium (1) | Medium (1) |
| MaSuRCA_C | Heavy-weight tool | High (4) | High (5) |
| C | |||
| Tool | Computer usage | Wall-clock time | Memory intensity |
| HASLR | Light-weight tool | Light | Light |
| WENGAN-M | Light-weight tool | Light | Light |
| Redbean | Light-weight tool | Light | Medium |
| miniasm | Light-weight tool | Light | Medium |
| Flye | Medium-weight tool | Medium | Medium |
| NextDenovo | Heavy-weight tool | Heavy | Medium |
| SPAdes | Heavy-weight tool | Heavy | Heavy |
| Platanus-allee | Heavy-weight tool | Heavy | Heavy |
| Canu | Heavy-weight tool | Heavy | Heavy |
| MaSuRCA_F | Heavy-weight tool | Heavy | Heavy |
| MaSuRCA_C | Heavy-weight tool | Heavy | Heavy |
Effect of polishing on annotation completeness (BUSCO)
BUSCO completeness of assembly contigs and polished contigs are shown in Figures 3 and 4, respectively. The concrete BUSCO scores are indicated in Supplementary Table S6 and Supplementary Table S7. In particular for miniasm and Redbean, BUSCO completeness tended to improve significantly after polishing (Supplementary Table S8). For SPAdes, MaSuRCA_F and MaSuRCA_C, there was little change. Platanus-allee remained unchanged in all genomes. For HASLR, WENGAN-M, Flye, NextDenovo and Canu, the BUSCO completeness moderately improved after polishing. Since these results indicated that BUSCO completeness improved significantly before and after polishing the assembled contigs, especially with miniasm and Redbean, BUSCO completeness among the assemblers was compared based on the results after polishing in the following section.
Figure 3.

BUSCO completeness for assembly contigs (A) A. thaliana C24; (B) N. putrida NIES-4239; (C) Lates calcarifer; (D) S. sitiens; (E) A. thaliana F1; (F) C. gigas. Each breakdown and colour bar represent the various BUSCO categories: the entire complete score, including ‘single-copy’ and ‘duplicated’, is represented by ‘C’. ‘*’ shows ‘single-completeness’, represented by ‘S’. ‘†’ shows ‘duplicated-completeness’, represented by ‘D’. ‘§’ shows ‘Fragmented’, represented by ‘F’. ‘¶’ shows ‘Missing’, represented by ‘M’. Canu was timeout in (C).
Figure 4.

BUSCO completeness for the polished contigs (A) A. thaliana C24; (B) N. putrida NIES-4239; (C) Lates calcarifer; (D) S. sitiens; (E) A. thaliana F1; (F) C. gigas. Each breakdown and colour bar represent the categories of BUSCO: the entire complete score, including ‘single-copy’ and ‘duplicated’, is represented by ‘C’. ‘*’ shows ‘single-completeness’, represented by ‘S’. ‘†’ shows ‘duplicated-completeness’, represented by ‘D’. ‘§’ shows ‘Fragmented’, represented by ‘F’. ‘¶’ shows ‘Missing’, represented by ‘M’. Canu was timeout in (C).
Effect of heterozygosity on annotation completeness (BUSCO)
The ‘complete score’ (C) column and ‘complete and duplicate score’ (D) column of BUSCO for after polishing are indicated in Figure 2. BUSCO completeness after polishing is shown in Figure 4 and Supplementary Table S7. The genomes of A. thaliana C24 (heterozygosity, 0.055) and N. putrida NIES-4239 (heterozygosity, 0.336), which have lower heterozygosity, showed that their BUSCO completeness was not noticeably different among the assemblers, except for miniasm. For the other genomes, such as L. calcarifer (heterozygosity, 0.479), the BUSCO completeness was explicitly different among the assemblers, from 7.9 in miniasm to 98.8 in MaSuRCA_F. The completeness score, which is obtained by ranking the scores for complete BUSCO genes of each genome and summing the values of each rank, for each tool was separately calculated for genomes with heterozygosity <1 and ≥ 1 (Tables 2A and B). Consequently, for genomes with a heterozygosity <1, Flye, MaSuRCA_F and MaSuRCA_C were classified as ‘high’; SPAdes, Platanus-allee, Canu, Redbean and NextDenovo as ‘medium’; and WENGAN-M, HASLR and miniasm as ‘low’. For genomes with a heterozygosity ≥1, Canu and MaSuRCA_C were classified as ‘high’; NextDenovo, MaSuRCA_F, Redbean, Flye and Platanus-allee as ‘medium’; and SPAdes, WENGAN-M, miniasm and HASLR as ‘low’. Across the various levels of heterozygosity, MaSuRCA_F, MaSuRCA_C, Flye and Canu provided stable and high BUSCO completeness. The complete and duplicated BUSCO scores were higher in most assemblers for genomes with a heterozygosity >0.5 (e.g. S. sitiens, A. thaliana F1, and C. gigas) than for the other genomes; that of Canu was particularly large.
Computational resource usages
Computational resource usages in the de novo assembly process are represented in Figure 5 and the concrete numeric values, in Supplementary Table S9. The maximum wall-clock time values exceeded 250 h for NextDenovo, SPAdes, Platanus-allee, Canu, MaSuRCA_F and MaSuRCA_C, whereas that of HASLR, WENGAN-M, Redbean and miniasm did not exceed 50 h. Flye had a maximum wall-clock time of 90 h. The wall-clock time of Canu of L. calcarifer exceeded 500 h and became a ‘timeout’. Subsequently, to evaluate the wall-clock times, HASLR, WENGAN-M, Redbean and miniasm were classified as ‘Light’; Flye, as ‘Medium’; and NextDenovo, SPAdes, Platanus-allee, Canu, MaSuRCA_F and MaSuRCA_C, as ‘Heavy’ (Table 2C).
Figure 5.

Computational resource usage of de novo assemblers. Canu for Lates calcarifer timed-out. See Supplementary Table S9 for actual wall-clock time and memory. (A) Wall-clock time in hours. Two horizontal dashed lines indicate 50 and 250 h. (B) Memory usage. Three horizontal dashed lines indicate 50, 300 and 400 GB.
The maximum value of memory usage exceeded 400 GB for SPAdes, Platanus-allee, Canu, MaSuRCA_F and MaSuRCA_C. Neither HASLR nor WENGAN-M used >50 GB of memory in any condition. The maximum memory usages of Redbean and miniasm were both <300 GB but >50 GB. The maximum memory usages for Flye and NextDenovo were 343 and 364 GB, respectively. Consequently, to evaluate memory usage, HASLR and WENGAN-M were classified as ‘Light’; Redbean, miniasm, Flye and NextDenovo, as ‘Medium’; and SPAdes, Platanus-allee, Canu, MaSuRCA_F and MaSuRCA_C, as ‘Heavy’ (Table 2C).
We then classified the de novo assemblers based on the computational resource usage comprising the wall-clock time and the maximum memory usage. HASLR, WENGAN-M, Redbean and miniasm were classified as ‘Light’; Flye, as ‘Medium’; and NextDenovo, SPAdes, Platanus-allee, Canu, MaSuRCA_F and MaSuRCA_C, as ‘Heavy’. Hereinafter, assemblers are referred to as ‘light-weight tool’, ‘medium-weight tool’ or ‘heavy-weight tool’ according to the categories above based on their computational resource usage.
Evaluation of haplotig removal
Assembly ploidy
After the execution of Purge Haplotigs, assembly ploidies in most of the assemblers were closer to 1 across the genomes (Figure 2 and Supplementary Figure S2). Although there was no assembly with ploidy over 2, only miniasm, Flye, Canu and MaSuRCA_C provided an assembly ploidy >1.5 for genomes with higher heterozygosities, such as for C. gigas (heterozygosity, 3.00), suggesting difficulty in haplotype removal for these genomes. The concrete statistical values for primary contigs, haplotigs, and artefacts are indicated in Supplementary Table S10.
Annotation completeness (BUSCO)
The output files from Purge Haplotigs, primary contigs, haplotigs, and artefacts were examined for BUSCO completeness (Supplementary Figures S4–S6) to evaluate the validity of the purging process. The contig sets with higher complete and duplicated BUSCO scores were purged well (Figure 2). The highest BUSCO duplicated score before purging was 79.2% in Canu of C. gigas; after purging, this score drastically decreased to 12.1%. The BUSCO duplicated scores of C. gigas, which were higher in any of the assemblers than the other genomes, decreased to 14.9% after purging for MaSuRCA_C at the highest. In contrast, the BUSCO completeness of primary contigs was similar to that before the removal of haplotigs from across the genomes (Supplementary Table S11). The completeness scores that decreased by >1% were those of miniasm for N. putrida NIES-4239 (heterozygosity, 0.336); miniasm for S. sitiens (heterozygosity, 0.847), miniasm and Platanus-allee for A. thaliana F1 (heterozygosity, 1.04); and Redbean, miniasm, SPAdes and Canu for C. gigas (heterozygosity, 3.00). The maximum decreased score was 10.6% of miniasm for C. gigas. That is, decrease in BUSCO completeness >1% was not observed even after Purge Haplotigs for any genomes in HASLR, WENGEN-M, Flye, NextDenovo, MaSuRCA_F or MaSuRCA_C.
These results suggest that some might have been over-purged. To survey the over-purge, we examined (i) the number of BUSCO genes that were detected on haplotigs but not on primary contigs and (ii) the number of BUSCO genes that were detected on artefacts but not on primary contigs (Supplementary Table S12). Consequently, an over-purge >1% of the total BUSCO genes was not observed in any of the assembled genomes with HASLR, WENGEN-M, Flye, NextDenovo, MaSuRCA_F or MaSuRCA_C. Conversely, for genomes with a heterozygosity >0.847 (such as that for S. sitiens), an over-purge was observed in some assemblers. The maximum number of (A) was 160 in miniasm for A. thaliana F1 (9.9% of the overall BUSCO genes), and that of (B) was 10 in Platanus-allee for A. thaliana F1 (0.6% of the overall BUSCO genes).
Comparison with Arabidopsis reference genome
To evaluate how effectively the above processes (assembly, polishing and purging) reconstructed the haploid sequences, the assembled A. thaliana F1 primary contigs were compared with the haploid sequences of Col-0 and Cvi-0, which are parent accessions (Supplementary Table S13). The genome fractions, NGA50 values, or the number of misassemblies between F1 and Col-0 and between F1 and Cvi-0 were comparable. For Redbean, Flye, SPAdes, Platanus-allee, Canu and MaSuRCA_C, the genome fractions were > 90%, while they were 88% for MaSuRCA_F and approximately 80% for NextDenovo and WENGAN-M. However, in miniasm and HASLR, the genome fractions were 52% and < 50%, respectively. The NGA50 values in Redbean, Flye, Canu, MaSuRCA_F and MaSuRCA_C were > 130 Kb; miniasm had the lowest NGA50 value (approximately 3000 b). The NGA50 values of the remaining assemblers were almost 8000–12 000 b. HASLR has no NGA50 value because the total aligned length is <50% of the length of the parent reference genome. While the number of misassemblies was the smallest in HASLR (approximately 450), that in the others was 1750–4722, with that in Platanus-allee being the highest.
Analytical guideline
We devised a guideline to construct a haploid representation with PacBio long reads and Illumina short reads for diploid genomes with various levels of heterozygosity (Figure 6). This was based on the evaluation of the continuities and BUSCO scores for each process of assembling, polishing and purging haplotigs using various assemblers. First, to understand the sample properties such as genome size, the heterozygosity and repeat rate are estimated using tools such as GenomeScope. For evaluating de novo assemblers, it is recommended to use only polished contigs after assembly. For genomes with any heterozygosities, the first recommended assembler is Redbean, a light-weight tool (Table 2C) with a stable performance regarding continuity and BUSCO completeness, regardless of heterozygosity (Table 2A and B). Redbean can provide a rough indication of computational resource usage, continuity and BUSCO completeness when using other additional assemblers. For genomes with a heterozygosity <1, Flye can be used as the second trial assembler because it is a medium-weight tool (Table 2C) classified as ‘High’ for both continuity and BUSCO completeness when heterozygosity is <1 (Table 2A). If memory and execution time are more available than usage for Flye, MaSuRCA_C should be used because it is a heavy-weight tool (Table 2C) classified as ‘High’ for both continuity and BUSCO completeness when heterozygosity is <1 (Table 2A). For genomes with a heterozygosity ≥1, MaSuRCA_C should be used as the alternative second trial assembler because it is a heavy-weight tool (Table 2C) classified as ‘High’ both for continuity and BUSCO completeness and has a stable performance across the genomes with any heterozygosity (Table 2A and B). If MaSuRCA_C does not terminate successfully or the execution time is too long, it is better to use Flye as a medium-weight tool even for genomes with a heterozygosity ≥1. Flye is inferior to MaSuRCA_C in both continuity and BUSCO completeness (Table 2B), but it provides stable results with lower computational resources than MaSuRCA_C does (Table 2C). If two or more assemblers are used, their continuity and BUSCO completeness must be compared. Finally, removal of haploid duplication is performed using tools such as Purge Haplotigs. This process is more important for genomes with a higher heterozygosity. After purging, the results need to be verified, and manual curation is required.
Figure 6.
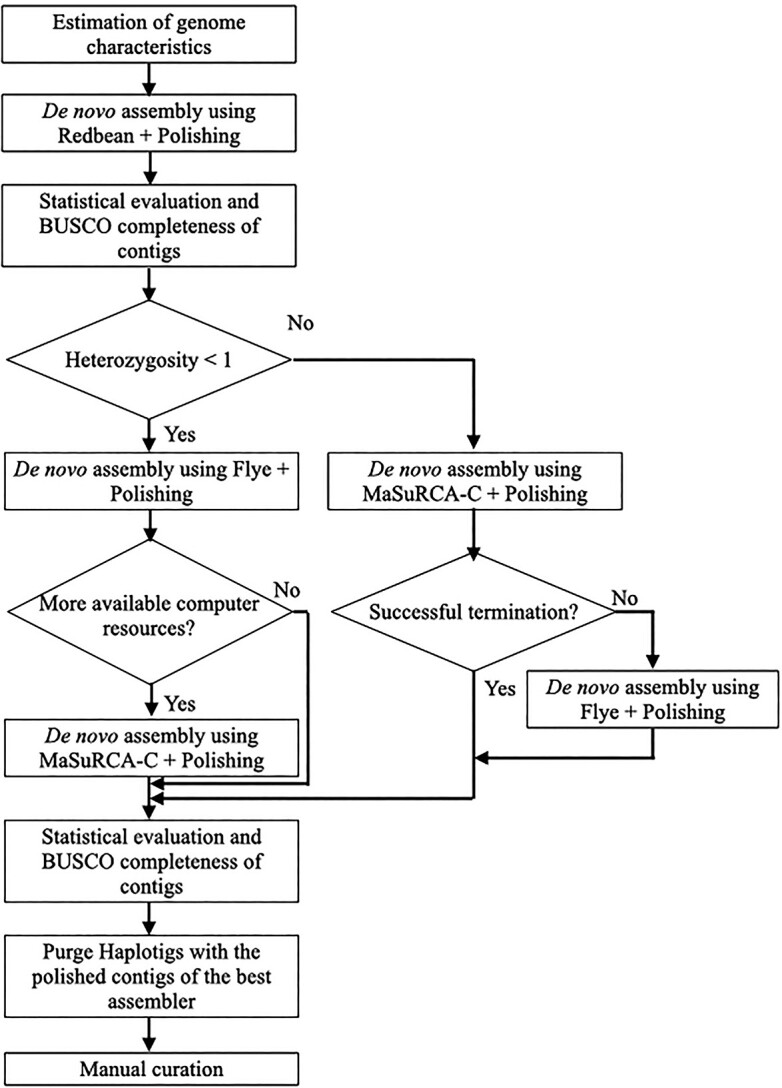
Recommended analytical guideline. This guideline consists of four processes: sample properties estimation, de novo assembly, polishing and purging haplotigs. De novo assemblers are recommended separately for heterozygosities <1 and ≥ 1.
DISCUSSION
Herein, we evaluated the procedures for constructing a haploid representation from PacBio long reads and Illumina short reads by focusing on heterozygosity and suggested an analytical guideline adapted to the degree of heterozygosity. The guideline includes: (i) estimation of genome information, including genome size and heterozygosity, (ii) de novo assembly, (iii) polishing and (iv) removal of duplicated haploid sequences. The five long-read-only and hybrid assemblers, respectively, were assessed for computer resource usage, contig continuity and BUSCO completeness (Table 2). Contig continuity and BUSCO completeness were separately evaluated for genomes with heterozygosities <1 and for those with heterozygosities ≥1. Subsequently, we selected three high-performance assemblers: Redbean from light-weight tools, Flye from medium-weight tools and MaSuRCA_C from heavy-weight tools. These assemblers were incorporated into the analytical guideline (Figure 6).
We focused on heterozygosity and proposed recommended assemblers. Nevertheless, the best genome–assembler combination would be affected by heterozygosity, repeats, genome size and other factors that cannot be determined without practically testing them. Thus, it is essential to understand the features of assemblers and perform a selective trial. We recommend checking the following items to choose the best assembly contigs: (i) BUSCO completeness, (ii) continuity and (iii) comparison between contig size after purging haplotigs and estimated genome size. For (i), this study conducted polishing once. However, polishing iteration may be effective if time permits, particularly for Redbean and miniasm, which showed significant polishing effects. A comparison of assemblers sometimes shows a similar BUSCO completeness value, indicating the limitation of the evaluations using BUSCO completeness. Thus, not only BUSCO but also the mapping rate of RNA-seq and/or Iso-seq might help select the best assembler. For (ii), we evaluated the continuity with N50 metrics. Depending on the purpose of the individual analysis, other metrics such as the number of contigs and largest contig length would be useful. For (iii), if BUSCO completeness, continuity and genome size are less than the expected values even after using multiple tools, a review of the methods, such as DNA quality, may be required prior to assembly.
While purging haplotigs was assessed by focusing on over-purging with the N50 metrics, BUSCO completeness, and assembly polyploidy, under-purging is still a possibility. Therefore, another study [51] evaluated haplotig purging with other metrics along with N50 and BUSCO completeness and a combination of some purging tools. However, evaluation using metrics has limitations. Therefore, to construct an ideal haploid representation, manual curation is needed. Manual curation would be better for genes predicted on the primary contigs, haplotigs and artefacts and to examine whether the predicted genes on the primary contigs cover the predicted genes on the haplotigs or artefacts. Moreover, the removal of organelle genome sequences from the primary and haplotig contigs is required. It is also necessary to remove organelle genomic sequences from the primary and haplotig contigs by homology searches against organelle sequences available at NCBI RefSeq [52].
In summary, this strategy provides a more efficient and improved quality analysis of the diploid genome. Furthermore, this guideline will be useful for beginners in bioinformatics and bioinformaticians involved with challenging genomes.
Key Points
Prior to de novo assembly, genomic characteristics (including genome size, heterozygosity, and repeat rate) should be estimated using tools such as GenomeScope to obtain better contigs owing to a better understanding of the genomic characteristics.
De novo assemblers were classified into three groups based on computational resources: Light-weight (HASLR, WENGAN-M, Redbean and miniasm), medium-weight (Flye), and heavy-weight tools (NextDenovo, SPAdes, Platanus-allee, Canu and MaSuRCA).
De novo assemblers were evaluated using N50 and BUSCO completeness for heterozygosity of <1 and ≥ 1. Redbean, Flye and MaSuRCA_C provided high-performance results and were incorporated into the guideline.
Assembler evaluation using BUSCO completeness requires the use of contigs after polishing because the degree of improvement of BUSCO completeness after polishing varies among assemblers.
The removal of allelic contigs, which are assembled separately, is necessary to improve the quality of subsequent analyses, such as gene prediction and expression analysis.
Supplementary Material
ACKNOWLEDGEMENTS
Computations were partially performed on the National Institute of Genetics supercomputer at the ROIS National Institute of Genetics. The authors would like to thank Editage (www.editage.com) for English language editing.
Author Biographies
Takako Mochizuki is a research scientist at the Genome Informatics Laboratory, National Institute of Genetics, Japan. Her research interest in bioinformatics includes genome assembly, gene annotation, and structural variation.
Mika Sakamoto is a research scientist at the Genome Informatics Laboratory, National Institute of Genetics, Japan. Her research interests in bioinformatics include gene annotation, genetic variation, and protein folding prediction.
Yasuhiro Tanizawa is an assistant professor at the Genome Informatics Laboratory, National Institute of Genetics, Japan. His research interests include genome bioinformatics and web services and database development.
Takuro Nakayama is an assistant professor at the Division of Life Sciences, Center for Computational Sciences, University of Tsukuba, Japan. His research interests include genome evolutions of single-celled organisms.
Goro Tanifuji is a senior curator at the Department of Zoology, National Museum of Nature and Science, Japan. His research interests include genome evolution related to symbiogenesis.
Ryoma Kamikawa is an associate professor at Graduate School of Agriculture, Kyoto University, Japan. His research interests include the diversity of microbial eukaryotes.
Yasukazu Nakamura is a professor at the Genome Informatics laboratory, National Institute of Genetics, Japan. His research interests include genome informatics.
Contributor Information
Takako Mochizuki, Genome Informatics Laboratory, National Institute of Genetics.
Mika Sakamoto, Genome Informatics Laboratory, National Institute of Genetics.
Yasuhiro Tanizawa, Genome Informatics Laboratory, National Institute of Genetics.
Takuro Nakayama, Division of Life Sciences Center for Computational Sciences, University of Tsukuba, Japan.
Goro Tanifuji, Department of Zoology, National Museum of Nature and Science.
Ryoma Kamikawa, Graduate School of Agriculture, Kyoto University.
Yasukazu Nakamura, Genome Informatics Laboratory, National Institute of Genetics.
FUNDING
This work was supported by JSPS grant-in-aid for Scientific Research on Innovative Areas, Platform for Advanced Genome Science [16H06279] and KAKENHI [15H05606 and 19H03274] to R.K., [20H03305] to T.N. and [17H03723] to G.T.
References
- 1. Sedlazeck FJ, Lee H, Darby CA, Schatz MC. Piercing the dark matter: bioinformatics of long-range sequencing and mapping. Nat Rev Genet 2018;19:329–46. [DOI] [PubMed] [Google Scholar]
- 2. Amarasinghe SL, Su S, Dong X, et al. Opportunities and challenges in long-read sequencing data analysis. Genome Biol 2020;21:30. [DOI] [PMC free article] [PubMed] [Google Scholar]
- 3. Peñaloza C, Gutierrez AP, Eöry L, et al. A chromosome-level genome assembly for the Pacific oyster Crassostrea gigas. GigaScience 2021;10:giab020. [DOI] [PMC free article] [PubMed] [Google Scholar]
- 4. Wang X, Gao L, Jiao C, et al. Genome of Solanum pimpinellifolium provides insights into structural variants during tomato breeding. Nat Commun 2020;11:5817. [DOI] [PMC free article] [PubMed] [Google Scholar]
- 5. Jiao Y, Peluso P, Shi J, et al. Improved maize reference genome with single-molecule technologies. Nature 2017;546:524–7. [DOI] [PMC free article] [PubMed] [Google Scholar]
- 6. Jarvis DE, Ho YS, Lightfoot DJ, et al. The genome of Chenopodium quinoa. Nature 2017;542:307–12. [DOI] [PubMed] [Google Scholar]
- 7. Watson M, Warr A. Errors in long-read assemblies can critically affect protein prediction. Nat Biotechnol 2019;37:124–6. [DOI] [PubMed] [Google Scholar]
- 8. Wang W, Das A, Kainer D, et al. The draft nuclear genome assembly of Eucalyptus pauciflora: a pipeline for comparing de novo assemblies. GigaScience 2020;9:giz160. [DOI] [PMC free article] [PubMed] [Google Scholar]
- 9. Jayakumar V, Sakakibara Y. Comprehensive evaluation of non-hybrid genome assembly tools for third-generation PacBio long-read sequence data. Brief Bioinform 2019;20:866–76. [DOI] [PMC free article] [PubMed] [Google Scholar]
- 10. Jiao WB, Schneeberger K. Chromosome-level assemblies of multiple Arabidopsis genomes reveal hotspots of rearrangements with altered evolutionary dynamics. Nat Commun 2020;11:989. [DOI] [PMC free article] [PubMed] [Google Scholar]
- 11. Molitor C, Kurowski TJ, Fidalgo de Almeida PM, et al. De novo genome assembly of Solanum sitiens reveals structural variation associated with drought and salinity tolerance. Bioinformatics 2021;37:1941–5. [DOI] [PMC free article] [PubMed] [Google Scholar]
- 12. Wan T, Liu Z, Leitch IJ, et al. The Welwitschia genome reveals a unique biology underpinning extreme longevity in deserts. Nat Commun 2021;12:4247. [DOI] [PMC free article] [PubMed] [Google Scholar]
- 13. Bendixsen DP, Gettle N, Gilchrist C, et al. Genomic evidence of an ancient east Asian divergence event in wild Saccharomyces cerevisiae. Genome Biol Evol 2021;13:evab001. [DOI] [PMC free article] [PubMed] [Google Scholar]
- 14. Walker BJ, Abeel T, Shea T, et al. Pilon: an integrated tool for comprehensive microbial variant detection and genome assembly improvement. PloS One 2014;9:e112963. [DOI] [PMC free article] [PubMed] [Google Scholar]
- 15. Zimin AV, Salzberg SL. The genome polishing tool POLCA makes fast and accurate corrections in genome assemblies. PLoS Comput Biol 2020;16:e1007981. [DOI] [PMC free article] [PubMed] [Google Scholar]
- 16. Hu J, Fan J, Sun Z, Liu S. NextPolish: a fast and efficient genome polishing tool for long-read assembly. Bioinformatics 2020;36:2253–5. [DOI] [PubMed] [Google Scholar]
- 17. Wenger AM, Peluso P, Rowell WJ, et al. Accurate circular consensus long-read sequencing improves variant detection and assembly of a human genome. Nat Biotechnol 2019;37:1155–62. [DOI] [PMC free article] [PubMed] [Google Scholar]
- 18. Cheng H, Concepcion GT, Feng X, et al. Haplotype-resolved de novo assembly using phased assembly graphs with hifiasm. Nat Methods 2021;18:170–5. [DOI] [PMC free article] [PubMed] [Google Scholar]
- 19. Nurk S, Walenz BP, Rhie A, et al. HiCanu: accurate assembly of segmental duplications, satellites, and allelic variants from high-fidelity long reads. Genome Res 2020;30:1291–305. [DOI] [PMC free article] [PubMed] [Google Scholar]
- 20. Banerjee RP, Tiwari GJ, Joshi B, et al. De novo hybrid assembled draft genome of Commiphora wightii (Arnott) Bhandari reveals key enzymes involved in phytosterol biosynthesis. Life (Basel) 2023;13:662. [DOI] [PMC free article] [PubMed] [Google Scholar]
- 21. Liu J, Liu J, Li M, et al. Division of developmental phases of freshwater leech Whitmania pigra and key genes related to neurogenesis revealed by whole genome and transcriptome analysis. BMC Genomics 2023;24:203. [DOI] [PMC free article] [PubMed] [Google Scholar]
- 22. Becerra S, Baroncelli R, Boufleur TR, et al. Chromosome-level analysis of the Colletotrichum graminicola genome reveals the unique characteristics of core and minichromosomes. Front Microbiol 2023;14:1129319. [DOI] [PMC free article] [PubMed] [Google Scholar]
- 23. Koren S, Walenz BP, Berlin K, et al. Canu: scalable and accurate long-read assembly via adaptive k-mer weighting and repeat separation. Genome Res 2017;27:722–36. [DOI] [PMC free article] [PubMed] [Google Scholar]
- 24. Kolmogorov M, Yuan J, Lin Y, et al. Assembly of long, error-prone reads using repeat graphs. Nat Biotechnol 2019;37:540–6. [DOI] [PubMed] [Google Scholar]
- 25. Li H. Minimap and miniasm: fast mapping and de novo assembly for noisy long sequences. Bioinformatics 2016;32:2103–10. [DOI] [PMC free article] [PubMed] [Google Scholar]
- 26. Ruan J, Li H. Fast and accurate long-read assembly with wtdbg2. Nat Methods 2020;17:155–8. [DOI] [PMC free article] [PubMed] [Google Scholar]
- 27. Haghshenas E, Asghari H, Stoye J, et al. HASLR: fast hybrid assembly of long reads. iScience 2020;23:101389. [DOI] [PMC free article] [PubMed] [Google Scholar]
- 28. Zimin AV, Puiu D, Luo M-C, et al. Hybrid assembly of the large and highly repetitive genome of Aegilops tauschii, a progenitor of bread wheat, with the MaSuRCA mega-reads algorithm. Genome Res 2017;27:787–92. [DOI] [PMC free article] [PubMed] [Google Scholar]
- 29. Kajitani R, Yoshimura D, Okuno M, et al. Platanus-allee is a de novo haplotype assembler enabling a comprehensive access to divergent heterozygous regions. Nat Commun 2019;10:1702. [DOI] [PMC free article] [PubMed] [Google Scholar]
- 30. Antipov D, Korobeynikov A, McLean JS, et al. hybridSPAdes: an algorithm for hybrid assembly of short and long reads. Bioinformatics 2016;32:1009–15. [DOI] [PMC free article] [PubMed] [Google Scholar]
- 31. Di Genova A, Buena-Atienza E, Ossowski S, et al. Efficient hybrid de novo assembly of human genomes with WENGAN. Nat Biotechnol 2021;39:422–30. [DOI] [PMC free article] [PubMed] [Google Scholar]
- 32. Chin CS, Peluso P, Sedlazeck FJ, et al. Phased diploid genome assembly with single-molecule real-time sequencing. Nat Methods 2016;13:1050–4. [DOI] [PMC free article] [PubMed] [Google Scholar]
- 33. Kajitani R, Toshimoto K, Noguchi H, et al. Efficient de novo assembly of highly heterozygous genomes from whole-genome shotgun short reads. Genome Res 2014;24:1384–95. [DOI] [PMC free article] [PubMed] [Google Scholar]
- 34. Roach MJ, Schmidt SA, Borneman AR. Purge Haplotigs: allelic contig reassignment for third-gen diploid genome assemblies. BMC Bioinformatics 2018;19:460. [DOI] [PMC free article] [PubMed] [Google Scholar]
- 35. Guan D, McCarthy SA, Wood J, et al. Identifying and removing haplotypic duplication in primary genome assemblies. Bioinformatics 2020;36:2896–8. [DOI] [PMC free article] [PubMed] [Google Scholar]
- 36. Huang S, Kang M, Xu A. HaploMerger2: rebuilding both haploid sub-assemblies from high-heterozygosity diploid genome assembly. Bioinformatics 2017;33:2577–9. [DOI] [PMC free article] [PubMed] [Google Scholar]
- 37. Kamikawa R, Mochizuki T, Sakamoto M, et al. Genome evolution of a nonparasitic secondary heterotroph, the diatom Nitzschia putrida. Sci Adv 2022;8:eabi5075. [DOI] [PMC free article] [PubMed] [Google Scholar]
- 38. Vij S, Kuhl H, Kuznetsova IS, et al. Chromosomal-level assembly of the Asian seabass genome using long sequence reads and multi-layered scaffolding. PLoS Genet 2016;12:e1005954. [DOI] [PMC free article] [PubMed] [Google Scholar]
- 39. Leinonen R, Akhtar R, Birney E, et al. The European nucleotide archive. Nucleic Acids Res 2011;39:D28–31. [DOI] [PMC free article] [PubMed] [Google Scholar]
- 40. Marçais G, Kingsford C. A fast, lock-free approach for efficient parallel counting of occurrences of k-mers. Bioinformatics 2011;27:764–70. [DOI] [PMC free article] [PubMed] [Google Scholar]
- 41. Vurture GW, Sedlazeck FJ, Nattestad M, et al. GenomeScope: fast reference-free genome profiling from short reads. Bioinformatics 2017;33:2202–4. [DOI] [PMC free article] [PubMed] [Google Scholar]
- 42. Chen S, Zhou Y, Chen Y, et al. Fastp: an ultra-fast all-in-one FASTQ preprocessor. Bioinformatics 2018;34:i884–90. [DOI] [PMC free article] [PubMed] [Google Scholar]
- 43. Shen W, Le S, Li Y, et al. SeqKit: a cross-platform and ultrafast toolkit for FASTA/Q file manipulation. PloS One 2016;11:e0163962. [DOI] [PMC free article] [PubMed] [Google Scholar]
- 44. Vasimuddin M, Misra S, Li H, et al. Efficient architecture-aware acceleration of BWA-MEM for multicore systems. 2019. IEEE International Parallel and Distributed Processing Symposium (IPDPS) 2019; 314–24 [Google Scholar]
- 45. Li H, Handsaker B, Wysoker A, et al. The sequence alignment/map format and SAMtools. Bioinformatics 2009;25:2078–9. [DOI] [PMC free article] [PubMed] [Google Scholar]
- 46. Miller JR, Delcher AL, Koren S, et al. Aggressive assembly of pyrosequencing reads with mates. Bioinformatics 2008;24:2818–24. [DOI] [PMC free article] [PubMed] [Google Scholar]
- 47. Chikhi R, Rizk G. Space-efficient and exact de Bruijn graph representation based on a bloom filter. Algorithms Mol Biol 2013;8:22. [DOI] [PMC free article] [PubMed] [Google Scholar]
- 48. Rhie A, Walenz BP, Koren S, et al. Merqury: reference-free quality, completeness, and phasing assessment for genome assemblies. Genome Biol 2020;21:245. [DOI] [PMC free article] [PubMed] [Google Scholar]
- 49. Manni M, Berkeley MR, Seppey M, et al. BUSCO update: novel and streamlined workflows along with broader and deeper phylogenetic coverage for scoring of eukaryotic, prokaryotic, and viral genomes. Mol Biol Evol 2021;38:4647–54. [DOI] [PMC free article] [PubMed] [Google Scholar]
- 50. Gurevich A, Saveliev V, Vyahhi N, et al. QUAST: quality assessment tool for genome assemblies. Bioinformatics 2013;29:1072–5. [DOI] [PMC free article] [PubMed] [Google Scholar]
- 51. Guiglielmoni N, Houtain A, Derzelle A, et al. Overcoming uncollapsed haplotypes in long-read assemblies of non-model organisms. BMC Bioinformatics 2021;22:303. [DOI] [PMC free article] [PubMed] [Google Scholar]
- 52. O’Leary NA, Wright MW, Brister JR, et al. Reference sequence (RefSeq) database at NCBI: current status, taxonomic expansion, and functional annotation. Nucleic Acids Res 2016;44:D733–45. [DOI] [PMC free article] [PubMed] [Google Scholar]
Associated Data
This section collects any data citations, data availability statements, or supplementary materials included in this article.