Abstract
Purpose
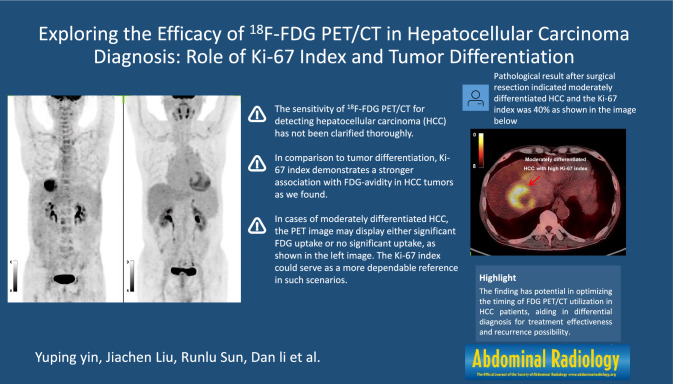
The sensitivity of [18F] fluorodeoxyglucose positron emission tomography-computed tomography (18F-FDG PET/CT) for detecting hepatocellular carcinoma (HCC) has not been clarified thoroughly. Our study seeks to explore the association between the Ki-67 index and FDG-avidity in HCC tumors using 18F-FDG PET/CT.
Methods
112 HCC lesions from 109 patients detected by 18F-FDG PET/CT were included retrospectively between August 2017 and May 2022, comprising 82 lesions in the training cohort and 30 in the validation cohort to simulate prospective studies. In the training cohort, lesions were stratified by a lesion-to-liver maximum standardized uptake value (SUVmax) ratio cut-off of 1.59. The relationships between lesion-to-liver SUVmax ratios and several clinical factors including tumor differentiation, alpha fetoprotein (AFP), carcinoembryonic antigen (CEA), hepatitis B virus (HBV) infection, Ki-67 index et al. were assessed. These findings were subsequently validated in the independent validation cohort.
Results
In the training cohort, group A1 lesions demonstrated a higher Ki-67 index (%, 40.00 [30.00, 57.50] vs. 10.00 [5.00, 28.75], p<0.001) than group A0, the positive correlation between FDG-avidity and Ki-67 index was revealed by multivariate analysis, OR=1.040, 95% CI of OR [1.004–1.077], p=0.030. The calculated cut-off value was 17.5% using the receiver operating characteristic (ROC) curve, with an area under curve (AUC) of 0.834 and 95% CI [0.742–0.926], p<0.001. These findings were further validated in the independent validation cohort, with similar results (AUC=0.875, 95% CI [0.750–1.000], p<0.001).
Conclusion
In comparison to tumor differentiation, Ki-67 index demonstrates a stronger association with FDG-avidity in HCC tumors, and when the Ki-67 index exceeds 17.5%, 18F-FDG PET/CT might serve as a useful indicator for HCC.
Graphical abstract
Keywords: 18F-FDG PET/CT, PET/CT, Hepatocellular carcinoma, FDG-avidity, Ki-67 index
Introduction
Recently, the International Agency for Research on Cancer (IARC) of the World Health Organization released the latest global cancer burden data for 2020, nearly 830,000 died of liver cancer, accounting for the third of all cancers, almost 90% of them were hepatocellular carcinoma, HCC [1]. Imaging techniques were a key tool in the diagnosis and monitoring of HCC. Non-invasive diagnostic criteria for HCC based on the imaging results of dynamic nuclear magnetic resonance imaging (MRI) and/or dynamic computed tomography (CT) had entered the guidelines and were widely used. [18F] fluorodeoxyglucose (18F-FDG) positron emission tomography-computed tomography (PET/CT) also plays an important role in the management of HCC due to its ability to show the metabolism of the lesion [2].
CT and MRI are capable of providing only observations on the morphological characteristics of HCC lesions [2], and the accuracy might be affected when the patient has a combination of liver cirrhosis [3, 4], at this point, the value of PET/CT to show the metabolism of the lesion begins to emerge. Although 18F-FDG PET/CT might have an important effect, the timing of its selection has not been well guided [5]. National Comprehensive Cancer Network (NCCN) guidelines (Version 1.2022) mentioned that “18F-FDG PET/CT has limited sensitivity but high specificity.” The main reason would be the low uptake of FDG by some HCC tumors [6]. A high expression of glucose-6-phosphatase [7] and low expression of GLUT1, GLUT3 [8] are some of the reasons associated with low FDG uptake in well-differentiated HCC. But to date, few studies have been done on the uptake ability of 18F-FDG in moderately differentiated HCC (accounting for a considerable proportion of HCC) [9]. Ki-67 is a well-known proliferation marker for the evaluation of cell proliferation, many previous studies had suggested that Ki-67 independently predicts cancer progression [10], and a study by Kitamura et al. mentioned that FDG uptake was also higher in Ki-67-positive lesions [11], but it is unclear whether the Ki-67 index (the percent positive frequency of Ki-67 protein labeling in HCC tumors) in HCC is useful in the interpretation of 18F-FDG PET/CT.
Therefore, this study aimed at the relation between the Ki-67 index and the 18F-FDG-avidity of HCC tumors.
Materials and methods
Study design
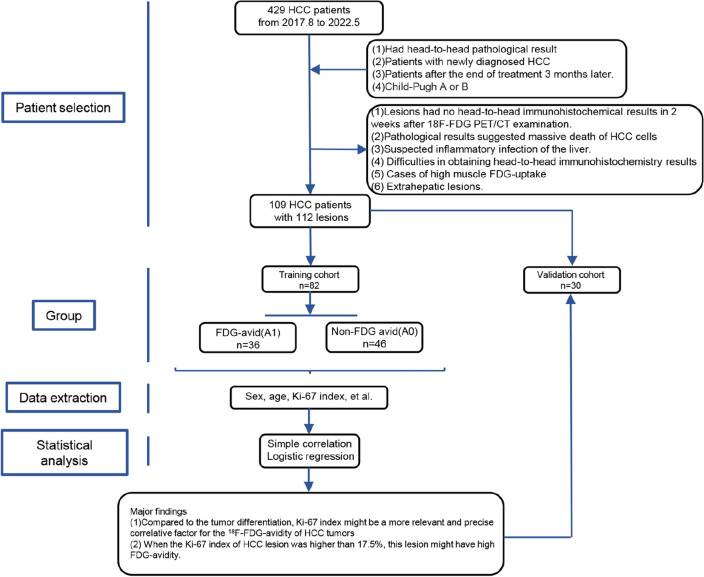
This was a single-center retrospective cohort study with prospective content. Overall research workflow was depicted in Fig. 1, a brief description is as follows. Twenty-nine patients with 30 lesions were selected for validation cohort by computer-generated random numbers, the other 80 patients with 82 lesions were then allocated to the training cohort. The selected lesions in training cohort were divided into two groups visually firstly, according to the 18F-FDG PET/CT images, the prominent lesions were assigned to P1 (n=35), while the none prominent lesions were assigned to P0 (n=47), collecting data on metabolic tumor volume (MTV), total lesion glycolysis (TLG), the lesion-to-liver ratio [maximum standardized uptake value (SUVmax), mean standardized uptake value (SUVmean)], and the lesion-to-blood pool ratio (SUVmax, SUVmean), subsequently the lesion-to-liver SUVmax ratio equal to 1.59 was determined as the optimal cut-off point by receiver operating characteristic (ROC) curve, lesions with the ratio greater than or equal to 1.59 were assigned to FDG-avid group (A1, n=36), while the other were assigned to A0 (n=46). Age, tumor differentiation, alpha fetoprotein (AFP), carcinoembryonic antigen (CEA), hepatitis B virus (HBV) infection, Ki-67 index, and hepatocyte paraffin 1 (HePpar-1) status were extracted, next the simple correlation and logistical regression analysis were used to detect the association between them. Finally, we draw a conclusion that Ki-67 index was positively correlated with FDG-avidity in training and validation cohort, expectantly, the sensitivity of 18F-FDG PET/CT examination increased significantly when the Ki-67 index was above 17.5%.
Fig. 1.
Workflow for this study design. HCC hepatocellular carcinoma, HePpar-1 hepatocyte paraffin 1, A1 HCC patients with FDG-avid lesions, A0 HCC patients with non-FDG-avid lesions
Patients
Between August 2017 and May 2022, 109 HCC patients with 112 tumor lesions (in 3 patients, two lesions each were selected for study) were selected from 429 patients with HCC who were detected by 18F-FDG PET/CT in our institution, and the patient demographics are shown in Tables 1 and 3. The inclusion criteria and exclusion criteria are as follows:
Table 1.
Descriptive characteristics of included HCC patients in training cohort
| Program | Training cohort | Validation cohort | p |
|---|---|---|---|
| Sex | |||
| Male | 72 (90%) | 21 (72.41%) | 0.022* |
| Female | 8 (10%) | 8 (27.59%) | |
| Age (years) | 54.44±10.96 | 53.14±14.02 | 0.621 |
| Differentiation | 0.127 | ||
| Poorly | 12 (14.63%) | 6 (20%) | |
| Moderately | 52 (63.41%) | 23 (76.67%) | |
| Well | 11 (13.41%) | 1 (3.33%) | |
| Null | 7 (8.54%) | 0 | |
| AFP (ng/ml) | 9.57 (4.10, 429.70) | 163.10 (10.16, 3587.50) | 0.043* |
| CEA (ng/ml) | 2.90 (1.90, 4.60) | 2.30 (1.70, 3.60) | 0.185 |
| HBV infection | 0.704 | ||
| Absent | 14 (17.5%) | 6 (20.69%) | |
| Present | 66 (82.5%) | 23 (79.31%) | |
| Ki-67 index (%) | 25 (10, 43.75) | 36.07±23.61 | 0.157 |
| HePpar-1 status | 0.237 | ||
| Negative | 9 (10.98%) | 1 (3.33%) | |
| Low expression | 5 (6.1%) | 3 (10%) | |
| Medium expression | 12 (14.63%) | 8 (26.67%) | |
| Positive | 51 (62.2%) | 18 (60%) | |
| Null | 5 (6.1%) | 0 |
Normally distributed continuous variables are presented as the mean ± standard deviation, while non-normally distributed data are presented as the median (IQR, interquartile range). Categorical variables are presented as the number (percentage)
HCC hepatocellular carcinoma, AFP alpha fetoprotein, HBV hepatitis B virus, CEA carcinoembryonic antigen, HePpar-1 hepatocyte paraffin 1, A1 HCC patients with FDG-avid lesions, A0 HCC patients with non-FDG-avid lesions
*p < 0.05 and the symbol [italics] were considered significant
Table 3.
Comparison between patients with FDG-avid and non-FDG-avid lesions in training cohort
| A1, n=36 | A0, n=46 | p | |
|---|---|---|---|
| Gender | |||
| Man | 33 | 41 | 1.000 |
| Woman | 3 | 5 | |
| Age (years) | 51.03±11.99 | 57.11±9.36 | 0.022* |
| Differentiation | < 0.001* | ||
| Poorly | 10 (30.30%) | 2 (4.35%) | |
| Moderately | 23 (63.89%) | 29 (63.04%) | |
| Well | 1 (2.78%) | 10 (21.74%) | |
| Null | 2 (5.56%) | 5 (10.87%) | |
| AFP (ng/ml) | 54.80 (5.41, 1662.50) | 6.42 (3.53, 25.90) | 0.003* |
| CEA (ng/ml) | 2.50 (1.83, 3.68) | 3.50 (1.80, 5.60) | 0.187 |
| HBV infection | 0.736 | ||
| Absent | 30 (83.33%) | 37 (80.43%) | |
| Present | 6 (16.67%) | 9 (19.57%) | |
| Ki-67 Index (%) | 40.00 (30.00, 57.50) | 10.00 (5.00, 28.75) | < 0.001* |
| HePpar-1 status | 0.168 | ||
| Negative | 7 (19.44%) | 2 (4.88%) | |
| Low expression | 3 (8.33%) | 2 (4.88%) | |
| Medium expression | 6 (16.67%) | 6 (14.63%) | |
| Positive | 20 (55.56%) | 31 (75.61%) |
Normally distributed continuous variables are presented as the mean ± standard deviation, while non-normally distributed data are presented as the median (IQR, interquartile range). Categorical variables are presented as the number (percentage)
SUVmax ratio lesion-to-liver SUVmax ratio, AFP alpha fetoprotein, HBV hepatitis B virus, CEA carcinoembryonic antigen, HePpar-1 hepatocyte paraffin 1, A1 HCC patients with FDG-avid lesions, A0 HCC patients with non-FDG-avid lesions
*p < 0.05 and the symbol [italics] were considered significant
Inclusion criteria: (1) head-to-head pathological result confirmed that all the lesions were active HCC; (2) Patients with newly diagnosed HCC; and (3) Child–Pugh A or B.
Exclusion criteria: (1) lesions had not been surgically removed within 2 weeks after 18F-FDG PET/CT examination; (2) Specimens were too fragmented to obtain head-to-head pathology; (3) HCC lesions influenced by treatment interventions; (4) Extrahepatic lesions; and (5) Cases of high muscle FDG uptake due to poor preparation before PET/CT inspection.
The selected 109 HCC patients were divided into two cohorts, 29 patients with 30 lesions were selected for validation cohort by computer-generated random numbers, the other 80 patients with 82 lesions were allocated to the training cohort.
Scan parameters
Instrument model: Germany Siemens Biograph m CT·S. CT scan parameters: CT tube pressure 120 kV, tube current: 300 MA, layer thickness 3–4 mm, matrix 512×512, radiopharmaceutical 18F-FDG, generated by GE800trace accelerator, imaging agent quality control radiochemical purity> 95%. 18F-FDG was injected intravenously at 5.55 MBq/kg body weight. After the drug was injected, the patient should close his(her) eyes and rest quietly for 40–60 min. PET/CT scan was performed after urination. Scan time 15 min. The obtained images were transferred to the Medix workstation for reading and analysis after attenuation correction processing [12].
Results of PET/CT evaluation
PET/CT reports were written by a senior nuclear medicine physician working for more than 5 years, and reviewed by a nuclear medicine department associate chief physician. If the result was uncertain, the department would discuss it to make a conclusion, and the immunohistochemical results would not be disclosed. Final data collection was done by a third person. The SUV of detectable lesions was measured by drawing a region of interest (ROI) over the area of tumor, MTV and TLG were measured by Medix workstation with threshold 40%. The SUV of the liver was measured at the right lobe of liver in PET images by using a 10-mm round-shaped ROI, the SUV of the blood pool was measured in the lumen of the descending aorta in the flat main bronchial bifurcation.
Results of pathology evaluation
The evaluation of immunohistochemical staining results was undertaken by a duo of experienced pathologists. Quantitative appraisals were consolidated and subsequently subjected to further scrutiny by a skilled pathologist. In situations where disparities emerged, an impartial third party was enlisted to undertake a comprehensive re-evaluation, including pathological reassessment. The preservation of research hypotheses' confidentiality was meticulously maintained throughout the assessment process, thereby upholding the principle of objectivity.
Data collection
Traditional factors including age, sex (male or female), metabolic tumor volume (MTV), total lesion glycolysis (TLG), the lesion-to-liver ratio (SUVmax, SUVmean) and the lesion-to-blood pool ratio (SUVmax, SUVmean), tumor differentiation (divided into three gradients: poorly, moderately, well), AFP and CEA values in laboratory tests (normal reference range: AFP≤7 ng/ml, CEA≤5 ng/ml), HBV infection, Ki-67 index (the percentage of Ki-67 expression in HCC cells), HePpar-1 status (divided into four gradients: negative, low expression, medium expression, positive).
Statistical analysis
Student's t test and Pearson test correlation test were used to test the differences in variables with normal distribution, and non-parametric tests (Kruskal–Wallis test, Mann–Whitney U test, and Spearman's rank correlation coefficient) were used for variables with non-normal distribution. The differences in categorical variables were tested by χ2 test and Fisher's test. All data of interest were then entered into the logistic regression equation for correction in training cohort. Finally, ROC curve was used to evaluate the predictive value. The two-side p <0.05 was considered significant. All statistical data were analyzed using SPSS 25 statistical software.
Results
Selection of the optimal cut-off point for whether a lesion is FDG-avid or not
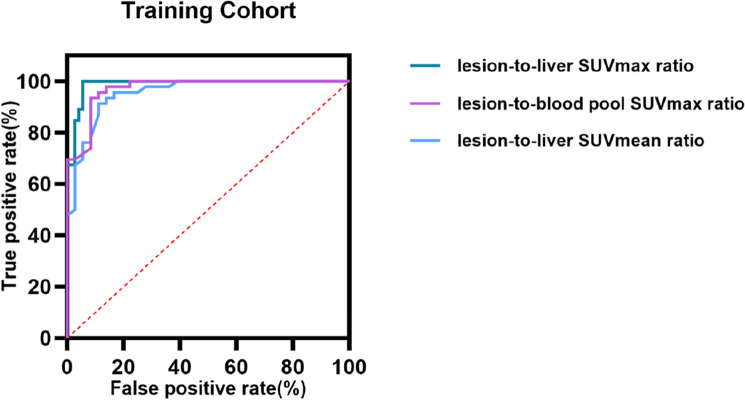
Patient characteristics of training and invalidation cohort are given in Table 1. Lesion characteristics regarding FDG uptake of training cohort are given in Table 2. The lesion-to-liver ratio (SUVmax, SUVmean) in P1 group was higher than P0 group, as was the lesion-to-blood pool ratio (SUVmax). No significant difference in the lesion-to-blood pool ratio (SUVmean), MTV and TLG between the two groups. The ROC curve suggested that the lesion-to-liver ratio (SUVmax) was the variable with the highest predictive grouping value as shown in Fig. 2, 1.59 was the optimal cut-off point calculated by Youden index, lesions with the ratio greater than or equal to 1.59 were regarded as FDG-avid lesions and grouped by A1, the other were regarded as none FDG-avid lesions and grouped by A0.
Table 2.
Lesion characteristics regarding FDG uptake of training cohort
| P1, n=35 | P0, n=47 | p | |
|---|---|---|---|
| Lesion-to-liver ratio | |||
| SUVmax | 2.22 (1.82, 3.21) | 1.16±0.22 | < 0.001* |
| SUVmean | 1.73 (1.39, 2.23) | 0.91 (0.84, 1.08) | < 0.001* |
| Lesion-to-blood pool ratio | |||
| SUVmax | 4.10 (3.47, 6.94) | 1.94±0.48 | < 0.001* |
| SUVmean | 1.73 (1.39, 2.23) | 1.53 (1.35, 1.81) | 0.108 |
| MTV (cm3) | 6.62 (2.84, 32.49) | 17.07 (8.01, 27.83) | 0.095 |
| TLG (cm3) | 43.98 (14.27, 173.22) | 47.13 (20.88, 83.09) | 0.591 |
Normally distributed continuous variables are presented as the mean ± standard deviation, while non-normally distributed data are presented as the median (IQR, interquartile range)
P1 patients with prominent HCC lesions visually, P0 patients with non-prominent HCC lesions visually, MTV metabolic tumor volume, TLG total lesion glycolysis
*p < 0.05 and the symbol [italics] were considered significant
Fig. 2.
Lesion characteristics regarding FDG uptake predicting grouping visually in training cohort. ROC curve for lesion-to-live SUVmax ratio (AUC=0.987, p < 0.01, 95% CI [0.967–1.000]), lesion-to-live SUVmean ratio predicting grouping (AUC=0.955, p < 0.01, 95% CI [0.914–0.996]), and lesion-to-blood pool SUVmax ratio (AUC=0.971, p < 0.01, 95% CI [0.941–1.000]) predicting grouping. ROC receiver operating characteristic, AUC area under curve, CI confidence interval. p < 0.05 was considered significant
Patient characteristics
A total of 82 lesions in 80 patients were included in training cohort, the HCC patients with FDG-avid lesions (A1) were younger than group A0 in Table 3, group A1 lesions had higher Ki-67 index than group A0, and so did AFP. The lesions in group A1 had worse differentiation compared to group A0. Sex, CEA, HBV infection, and HePpar-1 status were similar between A1 and A0 group, shown in Table 3.
Association between characteristics and FDG-avidity detected by 18F-FDG PET/CT inspection in training cohort
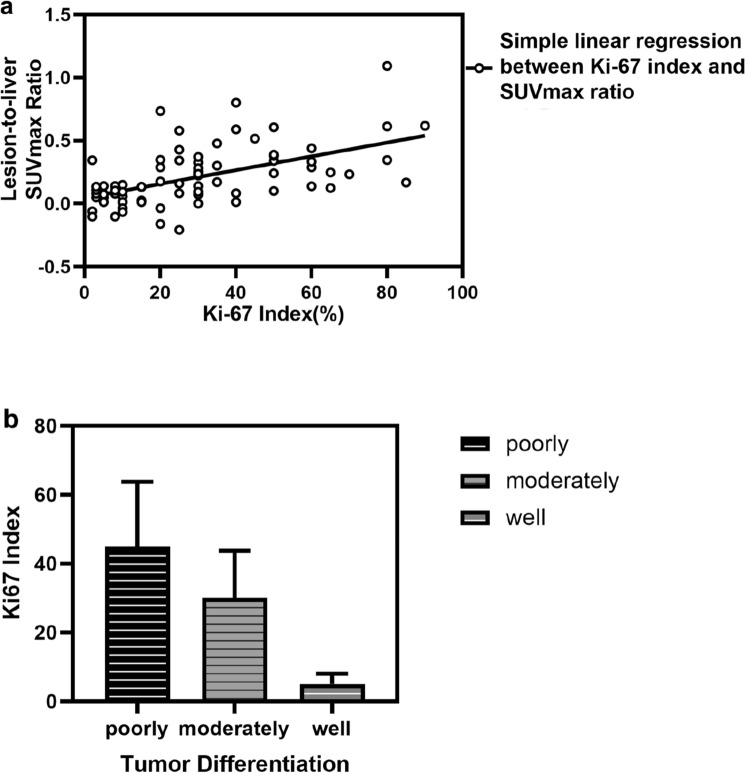
The associations between characteristics above and the FDG-avidity of lesions were analyzed by simple correlation. Data in Table 4 show that Ki-67 index was positively correlated with FDG-avidity, and so did AFP. While age, tumor differentiation, and HePpar-1 status were negatively correlated with it. The correlations above were tested by Spearman's rank correlation coefficient. The associations between Ki-67 index and lesion-to-liver SUVmax ratio are given in Fig. 3a by scatter plot, the associations between Ki-67 index and tumor differentiation are given in Fig. 3b.
Table 4.
Association between characteristics and FDG-avid lesions in training cohort
| A | ||
|---|---|---|
| r | p | |
| Age | − 0.236 | 0.033* |
| Tumor differentiation | − 0.520 | < 0.001* |
| AFP | 0.338 | 0.003* |
| CEA | − 0.162 | 0.189 |
| Ki-67 index | 0.538 | < 0.001* |
| HePpar-1 status | − 0.256 | 0.025* |
AFP alpha fetoprotein, CEA carcinoembryonic antigen, HePpar-1 hepatocyte paraffin 1
*p < 0.05 and the symbol [italics] were considered significant
Fig. 3.
Correlations between Ki-67 index and lesion-to-liver SUVmax ratio, tumor differentiation in training cohort. a Simple linear regression between Ki-67 index and lesion-to-liver SUVmax ratio in training cohort, and r=0.563, p < 0.01. SUVmax ratio lesion-to-liver SUVmax ratio; p < 0.05 was considered significant. b Distribution of Ki-67 index in HCC lesions with different degrees of differentiation. Ki-67 index was highest in poorly differentiated HCC lesions, followed by moderately differentiated and lowest in highly differentiated lesions, p < 0.05. HCC hepatocellular carcinoma
Next, characteristics that had a significant correlation (p<0.005) with FDG-avid lesions were entered as logistic regression, such as Ki-67 index, tumor differentiation, AFP and HePpar-1 status, conventional factors (age, sex), and MTV were used to correct. As shown in Table 5, only the Ki-67 index was positively correlated with FDG-avid lesion, and the tumor differentiation had no significant correlation with FDG-avidity after correction.
Table 5.
Association between characteristics and FDG-avid lesions by logistic regression in training cohort
| B | SE | p | OR | 95% CI of OR | ||
|---|---|---|---|---|---|---|
| Lower | Upper | |||||
| Age | − 0.023 | 0.030 | 0.432 | 0.977 | 0.922 | 1.035 |
| Sex | 0.077 | 1.095 | 0.944 | 1.081 | 0.126 | 9.241 |
| Differentiation | − 0.786 | 0.441 | 0.075 | 0.456 | 0.192 | 1.081 |
| AFP | 0.000 | 0.000 | 0.614 | 1.000 | 1.000 | 1.001 |
| Ki-67 | 0.039 | 0.018 | 0.030* | 1.040 | 1.004 | 1.077 |
| HePpar-1 | 0.047 | 0.998 | 0.962 | 1.048 | 0.148 | 7.414 |
AFP alpha fetoprotein, HePpar-1 hepatocyte paraffin 1
*p < 0.05 and the symbol [italics] were considered significant
Finally, ROC curve was used to evaluate predictive values of the Ki-67 index for grouping in training cohort as shown in Fig. 4a and Youden index indicated the cut-off value was 17.5%.
Fig. 4.
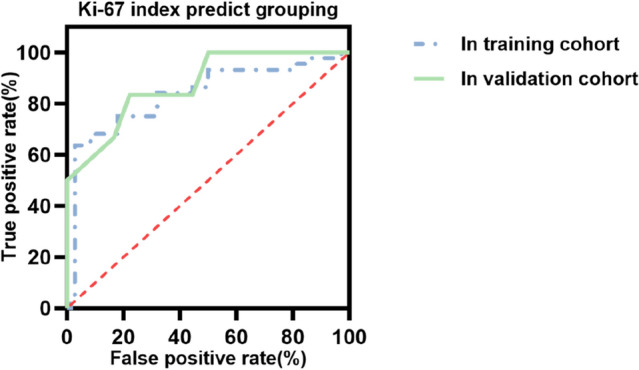
ROC curve for Ki-67 index predicting grouping in training and validation cohort. ROC curve for Ki-67 index predicting grouping in training cohort (AUC=0.834, p < 0.01, 95% CI [0.742–0.926]) and in validation cohort (AUC=0.875, p < 0.01, 95% CI [0.750–1.000]). ROC receiver operating characteristic, AUC area under curve, CI confidence interval. p < 0.05 was considered significant
The predictive value of Ki-67 index for FDG-avidity evaluated by ROC curve in validation cohort
There were 14 FDG-avid lesions and 16 non-FDG-avid lesions in validation cohort (n=30), the lesions were divided by lesion-to-liver SUVmax ratio, cut-off value was 1.59 (conclusion in Fig. 2a), FDG-avid lesions in validation cohort had higher Ki-67 index (%, 55.00 [40.00, 72.50] vs. 17.50 [11.50, 36.25], p<0.001) than non-FDG-avid lesions. ROC curve was used to evaluate predictive values as is shown in Fig. 4b, AUC=0.875, 95% CI [0.750–1.000], p<0.001. The validation cohort was divided into group 1 (HCC tumors with Ki-67 index above 17.5%, n=20, and the number of FDG-avid lesions was 14, the number of non-FDG-avid lesions was 6) and group 2 (HCC tumors with Ki-67 index below 17.5%, n=10, and the number of FDG-avid lesions was 0, the number of non-FDG-avid lesions was 10). Among the 82 lesions included in the training cohort, the sensitivities of 18F-FDG PET and 18F-FDG PET/CT were 41.25%, 68.75%. Among the 20 lesions in group 1 (HCC tumors with Ki-67 index above 17.5% in validation cohort), the sensitivities of 18F-FDG PET and 18F-FDG PET/CT were 70.00%, 80.00%, which were higher and χ2 test indicated p=0.036, while among the 10 lesions in group 2 (HCC tumors with Ki-67 index below 17.5% in validation cohort) the sensitivities were 0.00%, 20.00%, which were lower and Fisher's test indicated p=0.006.
Examples
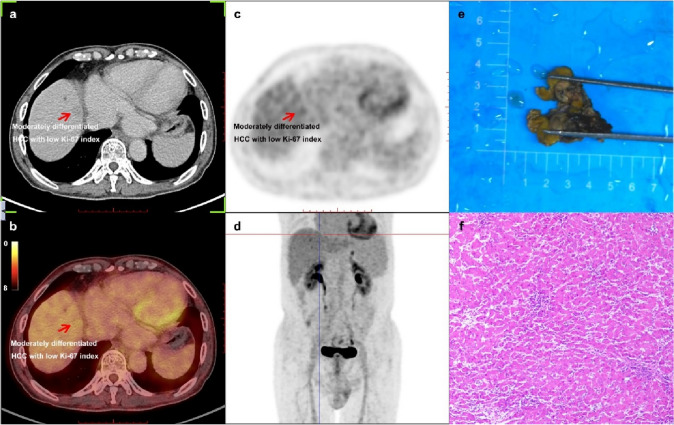
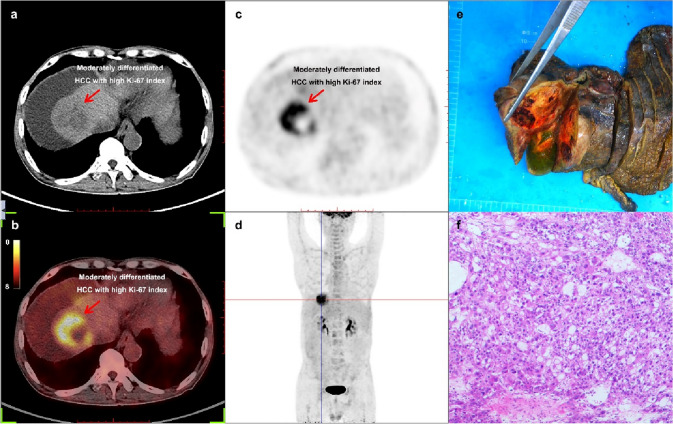
Figure 5 shows an example of a 70-year-old newly diagnosed HCC male patient detected by 18F-FDG PET/CT inspection. The SUVmax of this lesion located in liver S8 was 3.10, while the SUVmax of normal liver parenchyma in right lobe of liver was 3.00, thus the lesion-to-liver SUVmax ratio was 1.03, pathological results after surgical resection indicated moderately differentiated HCC, and the Ki-67 index was 10%. Figure 6 shows another example of a 66-year-old HCC male patient who was relapsed after interventional therapy. As the result of 18F-FDG PET/CT inspection, the SUVmax of this lesion located in liver S8 was 9.30, while the SUVmax of normal liver parenchyma in right lobe of liver was 2.40, thus the lesion-to-liver SUVmax ratio was 3.88, pathological results after surgical resection indicated moderately differentiated HCC and the Ki-67 index was 40%.
Fig. 5.
Example for a 70-year-old newly diagnosed HCC male man detected by 18F-FDG PET/CT inspection. a CT (computed tomography) image of the lesion located in liver S8 which was a hypodense nodule on delayed phase. b PET/CT fusion image of the lesion. c PET image of the lesion, and the SUVmax (maximum standardized uptake value) of this lesion was 3.10, the lesion-to-liver SUVmax ratio was 1.03. d The MIP (maximum intensity projection) picture of this patient. e Picture of the lesion after surgical resection. f A hematoxylin-stained pathological picture of this lesion indicated moderately differentiated HCC and the Ki-67 index was 10%. HCC hepatocellular carcinoma, 18F-FDG PET/CT [18F] fluorodeoxyglucose positron emission tomography-computed tomography
Fig. 6.
Example for a 66-year-old HCC male patient who was relapsed after interventional therapy and detected by 18F-FDG PET/CT inspection. a CT (computed tomography) image of the lesion located in liver S8 which was an inhomogeneous hypodense nodule. b PET/CT fusion image of the lesion. c PET image of the lesion, and the SUVmax (maximum standardized uptake value) of this lesion was 9.30, the lesion-to-liver SUVmax ratio was 3.88. d The MIP (maximum intensity projection) picture of this patient. e Picture of the lesion after surgical resection. f A hematoxylin-stained pathological picture of this lesion indicated moderately differentiated HCC and the Ki-67 index was 40%. HCC hepatocellular carcinoma, 18F-FDG PET/CT [18F] fluorodeoxyglucose positron emission tomography-computed tomography
These two examples indicated that the FDG-avidity could be high or low for moderately differentiated HCC, but it was still associated with Ki-67 index.
Discussion
Intriguingly, it would be a novel strategy to help better application of 18F-FDG PET in the diagnosis and treatment of HCC patients based on the Ki-67 index. In this research, we found that (1) visual grouping and semi-quantitative analysis by lesion-to-liver SUVmax ratio were highly consistent (AUC=0.987, 95% CI [0.967–1.000], p<0.001), and cut-off value was 1.59 [13], lesions with the ratio greater than or equal to 1.59 were considered as FDG-avid (easy to be detected by 18F-FDG PET). (2) Tumor differentiation and HePpar-1 status were negatively correlated with the FDG-avidity of tumor lesion, while the Ki-67 index was positively correlated with it, but after correction, only the relationship between Ki-67 index and the FDG-avidity was significant. Compared to the tumor differentiation, Ki-67 index might be a more relevant and precise correlative factor for the 18F-FDG uptake of HCC tumors. (3) When the Ki-67 index of HCC lesion was more than 17.5%, this lesion might have higher FDG-avidity, the sensitivity of 18F-FDG PET/CT examination also increased significantly.
Many previous studies suggested that 18F-FDG PET/CT has low sensitivity in the diagnosis of HCC, the sensitivity was based on tumor cells uptake more 18F-FDG than surrounding [6, 14]. There were many reasons found recent years why the sensitivity was low in the diagnosis of HCC by 18F-FDG PET/CT, the most popular theory was that the low hexokinase activity and high glucose-6-phosphatase activity in well-differentiated HCC tumors, and resulting in the uptake of 18F-FDG by HCC lesion similar to that of normal liver parenchyma [7], however, this theory could not take into account the moderately differentiated HCC (accounts for a considerable proportion of HCC).
Ki-67 is well known as a kind of proliferative nuclear marker, which was first identified by Gerdes, etc. [15]. Ki-67 is a nuclear DNA binding protein, it is widely expressed in proliferating cells, many previous studies about cell cycle had shown that Ki-67 was present in the G1, S, and G2 phases of the cell cycle, but not in the G0 phase [10, 16], therefore, its high expression often represents that the proliferation of the cells is relatively vigorous. Many studies have shown that Ki-67 plays an important role in tumor grading and prognosis [17, 18], including HCC, studies had shown that high expression of Ki-67 predicted poorer prognosis [19], but its application in the interpretation of 18F-FDG PET/CT has not been studied. In this research, we found that Ki-67 index is positively correlated with the FDG-avidity of HCC lesion, and when an FDG-avid HCC lesion was found, the Ki-67 index might be more than 17.5% by immunohistochemistry. The reason might be the expression of glucose transporters (GLUTs). GLUT1 and GLUT3 are highly expressed in many tumors and both are thought to be highly correlated with the FDG-avidity of tumor [20, 21]. The expression of GLUTs protein is regulated by different signaling pathways and transcription factors in different tumors, however, in HCC tumors, the relationship between Ki-67 expression and GLUT1, GLUT3 protein expression is not clear until now [22].
In this study, we found that the FDG-avidity of HCC tumors have a correlation with the tumor differentiation, thus, poorly differentiated tumor with higher FDG-avidity and well-differentiated tumor with lower, which was also consistent with the classical views [22-26]. However, when the differentiation and the Ki-67 index entered the logistic regression equation together, only the correlation between Ki-67 index and FDG-avidity was significant. The reason might be that there is a correlation between Ki-67 index and differentiation of HCC tumors [19, 27], we also reached similar conclusions in this study, but Ki-67 index might be a more independent, relevant, and precise correlative factor for the 18F-FDG uptake of HCC tumors [28]. Another major reason might be that the FDG-avidity can be high or low for moderately differentiated HCC [7, 14, 29], as shown in Figs. 5 and 6.
When the Ki-67 index of HCC lesion was above 17.5%, this lesion might have high FDG-avidity. This might not only guide clinicians in the selection of 18F-FDG PET/CT examinations (because PET/CT is a radiological and high-cost examination [30]), but also play a role in image-guided treatment. For example, some targeted therapies targeting Ki-67 protein mainly guided by pathological biopsy results [10], however, the results of pathological biopsy might be affected by many conditions, such as biopsy site, section, and staining [31, 32], analyzing the FDG-avidity of the lesions might also help to guide the biopsy. When the Ki-67 index of HCC lesion was below 17.5%, other tumor imaging agents such as choline might need to be given more consideration [33]. The postoperative follow-up of HCC was often complicated by inflammation and bile leakage [34], and active foci of FDG metabolism in the hepatic region might be challenging to identify [35]. This study's findings might facilitate their detection.
Our study has some limitations. In the validation cohort group 1 (Ki-67 index above 17.5%), there were still 30% of patients with non-FDG-avid tumors, which might need to be combined with additional indicators for a more precise determination. Additionally, the attainment of a more precise Ki-67 index cut-off value requires a substantial sample size. These requirements necessitate further research efforts, and we are in the process of establishing prospective multi-center clinical trials to acquire more accurate data. At last, the intrinsic relationship between Ki-67 expression and FDG-avidity in HCC tumor remains unclear, these may require more laboratory research work by more people.
In conclusion, this study found a positive relationship between Ki-67 index and FDG-avidity in HCC tumors by 18F-FDG PET/CT that Ki-67 index might be a more effective predictor of 18F-FDG PET/CT sensitivity than tumor differentiation in HCC diagnosis and treatment. 18F-FDG PET/CT might be a good hint for HCC when Ki-67 index is higher than 17.5%, the sensitivity of 18F-FDG PET/CT examination increased significantly at this time. This might not only guide clinicians in the selection of 18F-FDG PET/CT examination, but also might provide a new way in image-guided treatment, and this discovery has the potential to assist nuclear medicine physicians in effectively utilizing FDG PET/CT for differential diagnosis of HCC concerning treatment effectiveness and the possibility of recurrence.
Funding
This study was supported by Grants from the Natural Science Foundation of China (Grant Number 81700397).
Data availability
All data were transparent. The data used in the current study are available from the corresponding authors on reasonable request.
Declarations
Conflict of interest
The authors declare that they have no conflict of interest.
Ethical approval
This is an observational study. The Sun Yat-sen Memorial Hospital Research Ethics Committee has confirmed that no ethical approval is required. All procedures performed in studies involving human participants were in accordance with the ethical standards of the Institutional and National Research Committee and with the 1964 Helsinki Declaration and its later amendments or comparable ethical standards.
Footnotes
Publisher's Note
Springer Nature remains neutral with regard to jurisdictional claims in published maps and institutional affiliations.
Yuping Yin, Jiachen Liu and Runlu Sun have contributed equally to this work.
Contributor Information
Hong Zhang, Email: zhanghn@mail.sysu.edu.cn.
Dan Li, Email: lidan269@mail.sysu.edu.cn.
References
- 1.International Agency for Research on Cancer (IARC) of the World Health Organization (WHO). World Cancer Report 2020. WHO website. www.iarc.who.int/cards_page/world-cancer-report/. Accessed January 5, 2021.
- 2.Ayuso C, Rimola J, Vilana R, et al. Diagnosis and staging of hepatocellular carcinoma (HCC): current guidelines. Eur J Radiol. 2018;101:72–81. doi: 10.1016/j.ejrad.2018.01.025. [DOI] [PubMed] [Google Scholar]
- 3.Semaan S, Vietti Violi N, Lewis S, et al. Hepatocellular carcinoma detection in liver cirrhosis: diagnostic performance of contrast-enhanced CT vs. MRI with extracellular contrast vs. gadoxetic acid. Eur Radiol. 2020;30:1020–1030. doi: 10.1007/s00330-019-06458-4. [DOI] [PubMed] [Google Scholar]
- 4.Wang DC, Jang HJ, Kim TK. Characterization of Indeterminate Liver Lesions on CT and MRI With Contrast-Enhanced Ultrasound: What Is the Evidence? AJR Am J Roentgenol. 2020;214:1295–1304. doi: 10.2214/ajr.19.21498. [DOI] [PubMed] [Google Scholar]
- 5.(2021) Hepatocellular carcinoma. Nat Rev Dis Primers 7:7. 10.1038/s41572-021-00245-6 [DOI] [PubMed]
- 6.Benson AB, D'Angelica MI, Abbott DE, et al. Hepatobiliary Cancers, Version 2.2021, NCCN Clinical Practice Guidelines in Oncology. J Natl Compr Canc Netw. 2021;19:541–565. doi: 10.6004/jnccn.2021.0022. [DOI] [PubMed] [Google Scholar]
- 7.Lv J, Yin H, Mao W, Shi H. Investigating the value of pre-treatment (18)F-FDG PET/CT in predicting the pathological characteristic of hepatocellular carcinoma and recurrence after liver transplantation. Abdom Radiol (NY) 2021;46:2490–2497. doi: 10.1007/s00261-020-02872-1. [DOI] [PubMed] [Google Scholar]
- 8.Xia H, Chen J, Gao H, et al. Hypoxia-induced modulation of glucose transporter expression impacts (18)F-fluorodeoxyglucose PET-CT imaging in hepatocellular carcinoma. Eur J Nucl Med Mol Imaging. 2020;47:787–797. doi: 10.1007/s00259-019-04638-4. [DOI] [PubMed] [Google Scholar]
- 9.Torizuka T, Tamaki N, Inokuma T, et al. In vivo assessment of glucose metabolism in hepatocellular carcinoma with FDG-PET. J Nucl Med. 1995;36:1811–1817. [PubMed] [Google Scholar]
- 10.Yang C, Zhang J, Ding M, et al. Ki67 targeted strategies for cancer therapy. Clin Transl Oncol. 2018;20:570–575. doi: 10.1007/s12094-017-1774-3. [DOI] [PubMed] [Google Scholar]
- 11.Kitamura K, Hatano E, Higashi T, et al. Proliferative activity in hepatocellular carcinoma is closely correlated with glucose metabolism but not angiogenesis. J Hepatol. 2011;55:846–857. doi: 10.1016/j.jhep.2011.01.038. [DOI] [PubMed] [Google Scholar]
- 12.Liu J, Sun R, Yin Y, et al. Is (18)F-FDG PET/CT Beneficial for Newly Diagnosed Breast Cancer Patients With Low Proportion of ER Expression? Front Oncol. 2021;11:755899. doi: 10.3389/fonc.2021.755899. [DOI] [PMC free article] [PubMed] [Google Scholar]
- 13.Albano D, Bosio G, Giubbini R, Bertagna F. 18F-FDG PET/CT and extragastric MALT lymphoma: role of Ki-67 score and plasmacytic differentiation. Leuk Lymphoma. 2017;58:2328–2334. doi: 10.1080/10428194.2017.1298754. [DOI] [PubMed] [Google Scholar]
- 14.Chen H, Pang Y, Wu J, et al. Comparison of [(68)Ga]Ga-DOTA-FAPI-04 and [(18)F] FDG PET/CT for the diagnosis of primary and metastatic lesions in patients with various types of cancer. Eur J Nucl Med Mol Imaging. 2020;47:1820–1832. doi: 10.1007/s00259-020-04769-z. [DOI] [PubMed] [Google Scholar]
- 15.Gerdes J, Li L, Schlueter C, et al. Immunobiochemical and molecular biologic characterization of the cell proliferation-associated nuclear antigen that is defined by monoclonal antibody Ki-67. Am J Pathol. 1991;138:867–873. [PMC free article] [PubMed] [Google Scholar]
- 16.Menon SS, Guruvayoorappan C, Sakthivel KM, Rasmi RR. Ki-67 protein as a tumour proliferation marker. Clin Chim Acta. 2019;491:39–45. doi: 10.1016/j.cca.2019.01.011. [DOI] [PubMed] [Google Scholar]
- 17.Dong Y, Jiang Z, Li C, et al. Development and validation of novel radiomics-based nomograms for the prediction of EGFR mutations and Ki-67 proliferation index in non-small cell lung cancer. Quant Imaging Med Surg. 2022;12:2658–2671. doi: 10.21037/qims-21-980. [DOI] [PMC free article] [PubMed] [Google Scholar]
- 18.Yan J, Xue X, Gao C, et al. Predicting the Ki-67 proliferation index in pulmonary adenocarcinoma patients presenting with subsolid nodules: construction of a nomogram based on CT images. Quant Imaging Med Surg. 2022;12:642–652. doi: 10.21037/qims-20-1385. [DOI] [PMC free article] [PubMed] [Google Scholar]
- 19.Zhang X, Wu Z, Peng Y, et al. Correlationship between Ki67, VEGF, and p53 and Hepatocellular Carcinoma Recurrence in Liver Transplant Patients. Biomed Res Int. 2021;2021:6651397. doi: 10.1155/2021/6651397. [DOI] [PMC free article] [PubMed] [Google Scholar]
- 20.Na KJ, Choi H, Oh HR, et al. Reciprocal change in Glucose metabolism of Cancer and Immune Cells mediated by different Glucose Transporters predicts Immunotherapy response. Theranostics. 2020;10:9579–9590. doi: 10.7150/thno.48954. [DOI] [PMC free article] [PubMed] [Google Scholar]
- 21.Adekola K, Rosen ST, Shanmugam M. Glucose transporters in cancer metabolism. Curr Opin Oncol. 2012;24:650–654. doi: 10.1097/CCO.0b013e328356da72. [DOI] [PMC free article] [PubMed] [Google Scholar]
- 22.Salas JR, Clark PM. Signaling Pathways That Drive (18)F-FDG Accumulation in Cancer. J Nucl Med. 2022;63:659–663. doi: 10.2967/jnumed.121.262609. [DOI] [PubMed] [Google Scholar]
- 23.Abdou AG, Maraee AH, Eltahmoudy M, El-Aziz RA. Immunohistochemical expression of GLUT-1 and Ki-67 in chronic plaque psoriasis. Am J Dermatopathol. 2013;35:731–737. doi: 10.1097/DAD.0b013e3182819da6. [DOI] [PubMed] [Google Scholar]
- 24.Zhang Y, Xu H, Wang H, Yu W, Zhao X, Xue Y. Fluorine-18-deoxyglucose positron emission tomography/computed tomography with Ki67 and GLUT-1 immunohistochemistry for evaluation of the radiosensitization effect of oleanolic acid on C6 rat gliomas. Nucl Med Commun. 2015;36:21–27. doi: 10.1097/mnm.0000000000000211. [DOI] [PubMed] [Google Scholar]
- 25.Li Q, Pan X, Zhu D, Deng Z, Jiang R, Wang X. Circular RNA MAT2B Promotes Glycolysis and Malignancy of Hepatocellular Carcinoma Through the miR-338-3p/PKM2 Axis Under Hypoxic Stress. Hepatology. 2019;70:1298–1316. doi: 10.1002/hep.30671. [DOI] [PubMed] [Google Scholar]
- 26.Lee M, Ko H, Yun M. Cancer Metabolism as a Mechanism of Treatment Resistance and Potential Therapeutic Target in Hepatocellular Carcinoma. Yonsei Med J. 2018;59:1143–1149. doi: 10.3349/ymj.2018.59.10.1143. [DOI] [PMC free article] [PubMed] [Google Scholar]
- 27.Han S, Meng F, Zhang HK, Li HL, Qu JR. Correlation analysis of Ki67, Ck19 with clinicopathological features and apparent diffusion coefficient value of hepatocellular carcinoma. Zhonghua Yi Xue Za Zhi. 2021;101:798–802. doi: 10.3760/cma.j.cn112137-20210108-00058. [DOI] [PubMed] [Google Scholar]
- 28.Albano D, Bertoli M, Ferro P, et al. 18F-FDG PET/CT in gastric MALT lymphoma: a bicentric experience. Eur J Nucl Med Mol Imaging. 2017;44:589–597. doi: 10.1007/s00259-016-3518-y. [DOI] [PubMed] [Google Scholar]
- 29.Winkens T, Rudakoff W, Rauchfuss F, Malessa C, Settmacher U, Freesmeyer M. FDG PET/CT to Detect Incidental Findings in Patients With Hepatocellular Carcinoma-Additional Benefit for Patients Considered for Liver Transplantation? Clin Nucl Med. 2021;46:532–539. doi: 10.1097/rlu.0000000000003576. [DOI] [PubMed] [Google Scholar]
- 30.Karantanis D, Kalkanis D, Allen-Auerbach M, et al. Oncologic 18F-FDG PET/CT: referring physicians' point of view. J Nucl Med. 2012;53:1499–1505. doi: 10.2967/jnumed.111.102228. [DOI] [PubMed] [Google Scholar]
- 31.Apostolova I, Ego K, Steffen IG, et al. The asphericity of the metabolic tumour volume in NSCLC: correlation with histopathology and molecular markers. Eur J Nucl Med Mol Imaging. 2016;43:2360–2373. doi: 10.1007/s00259-016-3452-z. [DOI] [PubMed] [Google Scholar]
- 32.Meermeier NP, Foster BR, Liu JJ, Amling CL, Coakley FV. Impact of Direct MRI-Guided Biopsy of the Prostate on Clinical Management. AJR Am J Roentgenol. 2019;213:371–376. doi: 10.2214/ajr.18.21009. [DOI] [PubMed] [Google Scholar]
- 33.Castilla-Lièvre MA, Franco D, Gervais P, et al. Diagnostic value of combining 11C-choline and 18F-FDG PET/CT in hepatocellular carcinoma. Eur J Nucl Med Mol Imaging. 2016;43:852–859. doi: 10.1007/s00259-015-3241-0. [DOI] [PubMed] [Google Scholar]
- 34.Okumura K, Sugimachi K, Kinjo N, et al. Risk factors of bile leakage after hepatectomy for hepatocellular carcinoma. Hepatogastroenterology. 2013;60:1717–1719. [PubMed] [Google Scholar]
- 35.Hayakawa N, Nakamoto Y, Nakatani K, et al. Clinical utility and limitations of FDG PET in detecting recurrent hepatocellular carcinoma in postoperative patients. Int J Clin Oncol. 2014;19:1020–1028. doi: 10.1007/s10147-013-0653-3. [DOI] [PubMed] [Google Scholar]
Associated Data
This section collects any data citations, data availability statements, or supplementary materials included in this article.
Data Availability Statement
All data were transparent. The data used in the current study are available from the corresponding authors on reasonable request.


