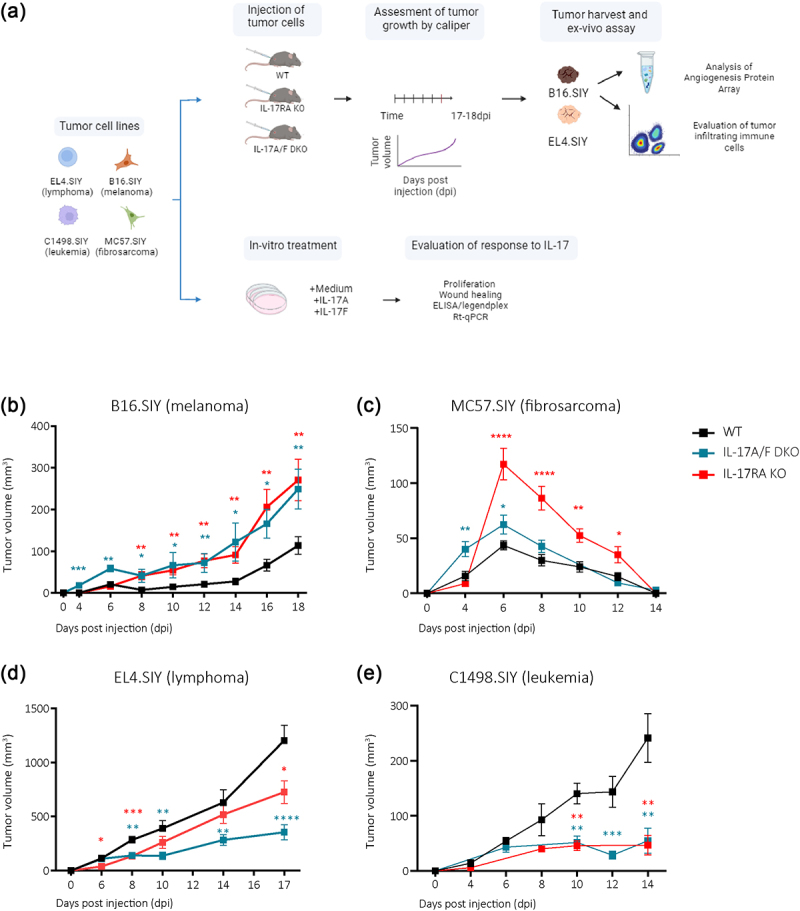
Figure 1.

IL-17 signaling defects in hosts result in distinct tumor progression patterns.
(a) Schematic illustration of studies conducted using B16.SIY (melanoma), MC57.SIY (fibrosarcoma), EL4.SIY (lymphoma), or C1498.SIY (leukemia) cells. For in vivo and ex vivo analysis, cells were injected into the right flank of IL-17RA KO, IL-17A/F DKO, and WT mice. (b – e) Curves of the average tumor volume measured on different days post-injection. The red line represents IL-17RA KO mice, blue line represents IL-17 A/F DKO mice, and black line represents WT controls. P-values relative to WT were calculated by multiple t-test. *p < 0.05; **p < 0.01; ***p < 0.001; ****p < 0.0001.
