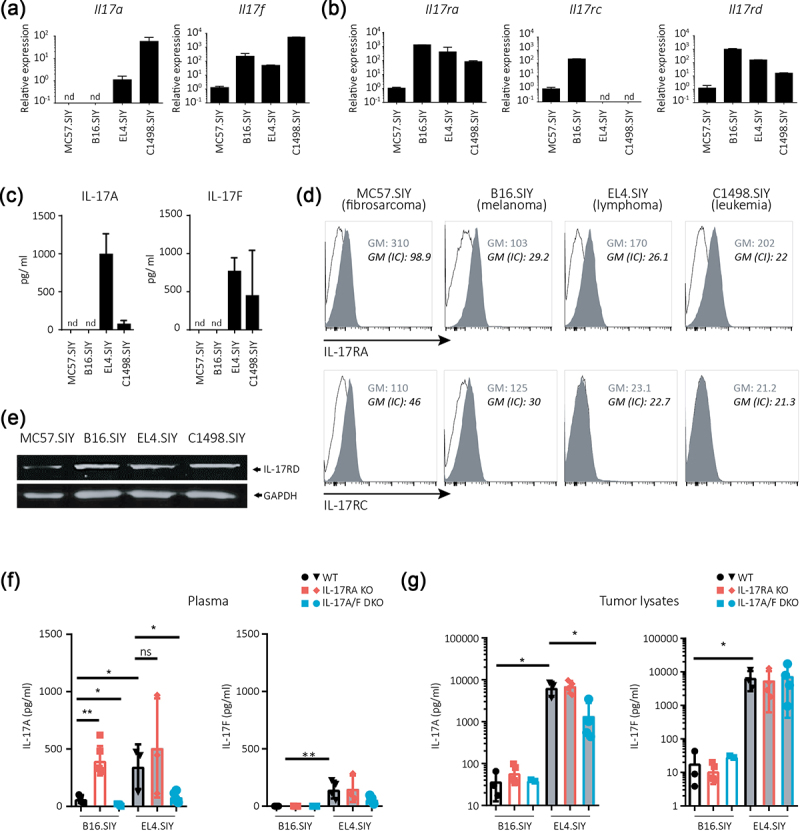
Figure 4.

Expression profiles of IL-17A/F:RA pathway cytokines and receptors differ among cell lines and tumors of varying tissue origins.
(a,b) Relative amounts of Il17a and Il17f (a) and Il17ra, Il17rc, and Il17rd (b) transcripts in the indicated tumor cell lines. Transcript amounts determined by RT-qPCR were normalized to 18S and MC57.SIY transcript levels. (c) IL-17A and IL-17F concentrations in the culture supernatants of different tumor cells. (d) Representative histograms of IL-17RA and IL-17RC expressions in different tumor cells. Isotype control (IC) staining is shown in black. Geometric mean (GM) of fluorescence intensity for IL-17Rs and IC stainings are displayed. (e) IL-17RD expression determined by western blot in different tumor cells. (f,g) Concentrations of IL-17A and IL-17F in plasma (f) and tumor lysates (g) of B16.SIY (melanoma) and EL4.SIY (lymphoma) bearing WT, IL-17RA KO, and IL-17A/F DKO mice. In A-C, n = 3 replicates per group. nd: non-detectable. In f and g, p value calculated with one-way ANOVA. *p < .05; **p < .01; ***p < .001; ****p < .0001.
