Figure 6.

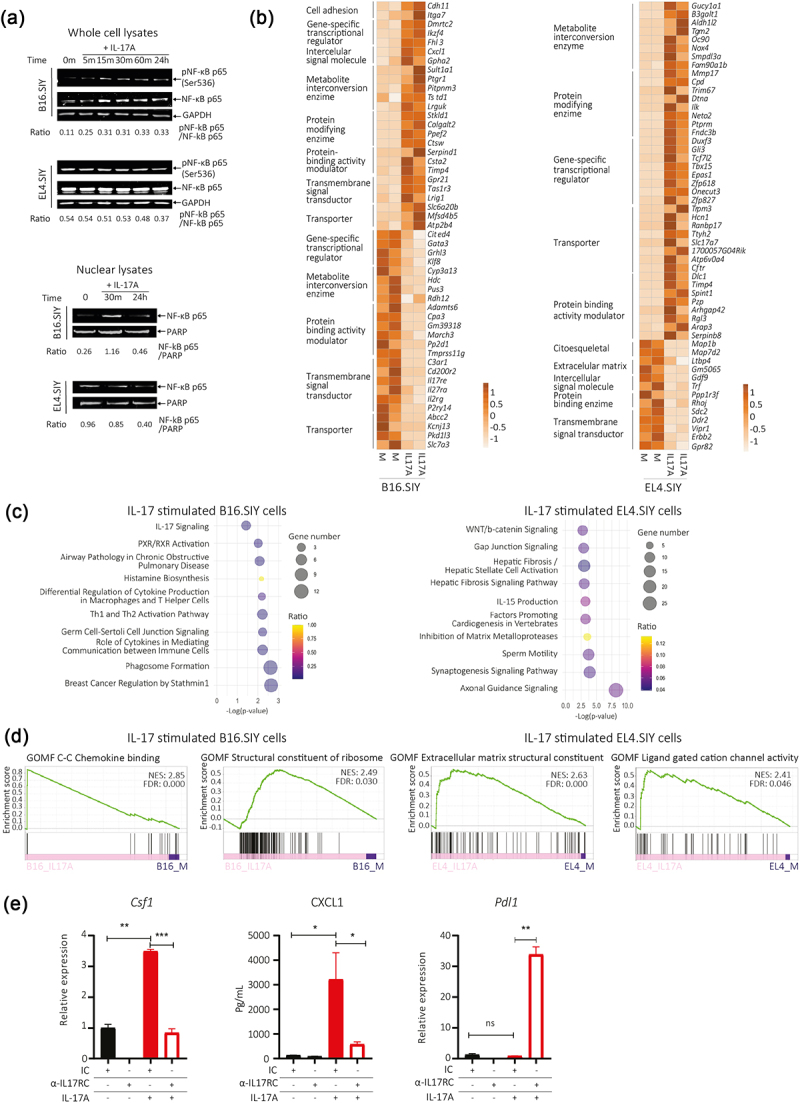
IL-17A induces cell-type specific signaling pathways and transcriptional responses influenced by IL-17RC expression.
(a) Expression of NF-κB p65 subunit in whole cell and nuclear lysates evaluated by western blot in B16.SIY (melanoma) and EL4.SIY (lymphoma) cells stimulated with IL-17A. (b – d) Analysis of RNA-seq performed in B16.SIY (melanoma) and EL4.SIY (lymphoma) cells stimulated or not with IL-17A (100 ng/mL) for 24 h. (b) Heat maps show top 50 genes modulated by IL-17 in B16.SIY (melanoma) or EL4.SIY (lymphoma) cells, grouped by biological function. (c) Bubble chart displays top enriched canonical pathways after IPA of DEGs induced in B16.SIY (melanoma) and EL4.SIY (lymphoma) cells by IL-17A stimulation. (d) GSEA plots show two top enriched pathways identified in the whole transcriptome of B16.SIY (melanoma) and EL4.SIY (lymphoma) stimulated cells, using the M5 (gene ontology sets) mouse collection from MSigDB. NES: normalized enrichment scores. FDR: false discovery rate. (e) Bar graph shows relative Csf1 and/or Pdl1 mRNA levels in cell lysates and CXCL1 concentration in culture supernatants of B16.SIY (melanoma) cultured with or without IL-17A and a blocking IL-17RC antibody or isotype control for 24 h under serum-reduced conditions. The results are shown as mean ± SD of three replicates for each condition, and the p-values were calculated by two-tailed unpaired t-test. ns indicates non-significant.
