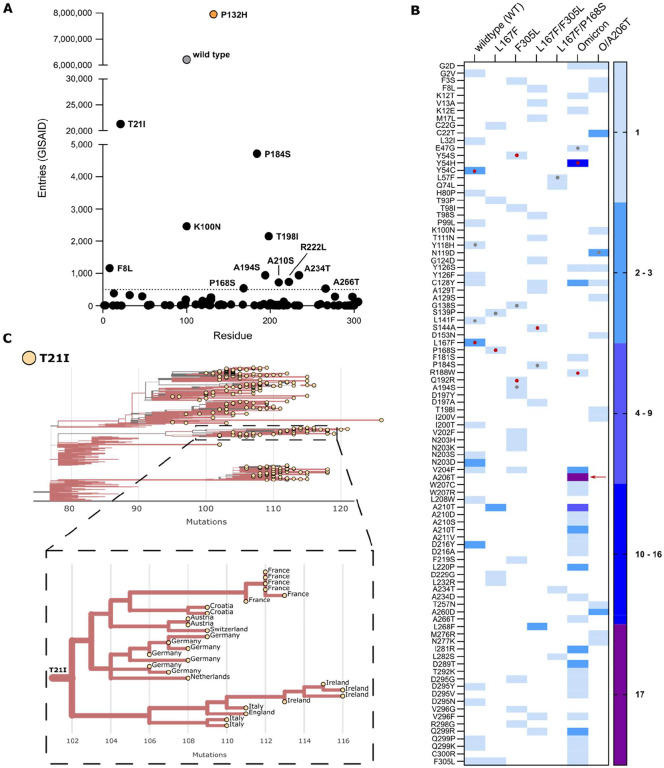
Fig. 2. Frequency of Mpro mutations in the GISAID database.
(A) The total number of nsp5/Mpro substitution entries for each mutation found during the selection experiments. WT and Omicron-Mpro sequences are displayed in grey and orange, respectively. The dotted line at 500 represent the cut-off value. (B) Heat map representing the number of a specific substitution’s independent occurrences from different samples of VSV-Mpro selection experiments. The red arrow indicates the substitution A206T. Red dots indicate residues within the catalytic site and grey dots indicate residues near the catalytic site. (C) Phylogenetic subtree of nsp5/Mpro-T21I mutant generated with the Ultrafast Sample placement on Existing tRee (UShER) tool and magnified view of a subtree area, showing transmission of this variant possibly from a single founder event (9th of April 2023). Only sequences deposited after the Omicron emergence were used.

