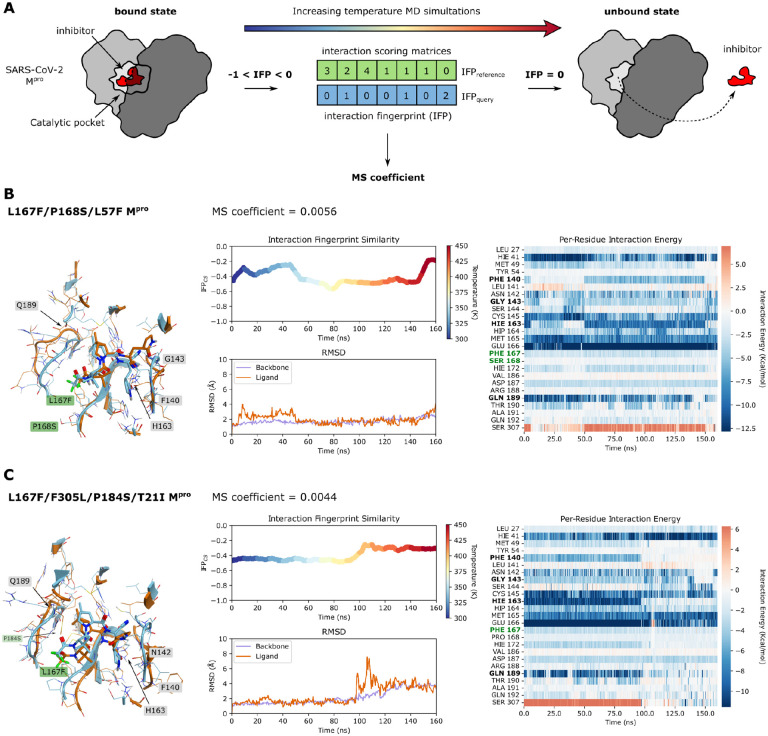
Fig. 6. Thermal Titration Molecular Dynamics (TTMD) experiments of L167F/P168S/L57F and L167F/F305L/P184S/T21I.
(A) Schematic representation of the TTMD simulation workflow. Interaction FingerPrints (IFP) of reference (bound state) and query (protease-inhibitor complex at each temperature condition over time) are continuously sampled and compared during the simulation. The closer from negative to zero the IFPquery is, the more the protease-inhibitor complex differs from the bound state. (B) TTMD simulation data of the nirmatrelvir-L167F/P168S/L57F-Mpro complex. Left: overlay of Mpro structure at the beginning (turquoise) and at the end of the simulation (orange); middle top: a rainbow plot including the IFPCS (left y-axis) is plotted against time in nanoseconds (x-axis). Additionally, the temperature in Kelvin is indicated by colours from blue to red on the right y-axis; middle bottom: the root-mean-square-deviation (left y-axis) is plotted against time in nanoseconds (x-axis); right: a heat map of interaction energies between ligand and surrounding residues. (C) TTMD simulation data of the nirmatrelvir-L167F/F305L/P184S/T21I-Mpro complex. Left: overlay of Mpro structure at the beginning (turquoise) and at the end of the simulation (orange); middle top: a rainbow plot including the IFPCS (left y-axis) is plotted against time in nanoseconds (x-axis). Additionally, the temperature in Kelvin is indicated by colours from blue to red on the right y-axis; middle bottom: the root-mean-square-deviation (left y-axis) is plotted against time in nanoseconds (x-axis); right: a heat map of interaction energies between ligand and surrounding residues. Residues that are mentioned in the results/discussion are highlighted in black, and mutated residues are highlighted in dark green.

