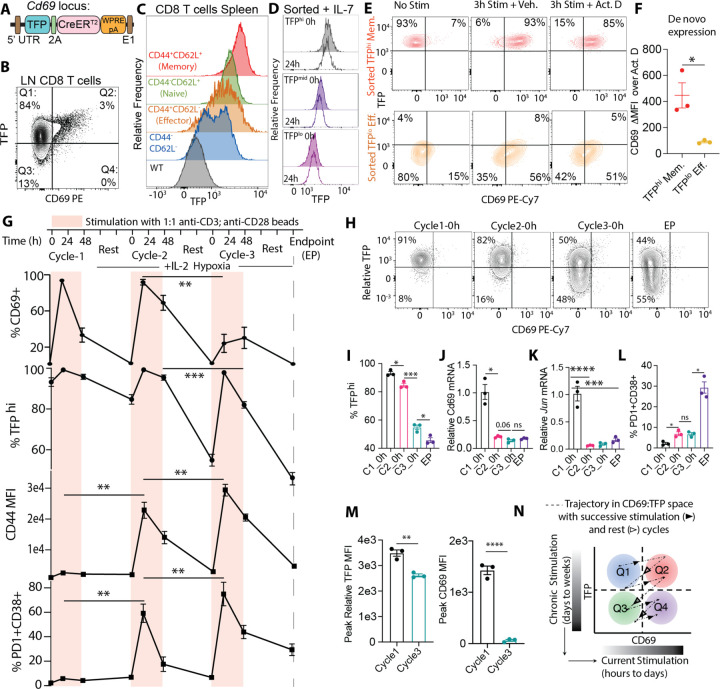
Fig.1: Cd69-TFP reporter reads out history of T cell stimulation.
(A) Design of the TFP-2A-CreERT2-WPRE-pA reporter knocked into the 5’ UTR of the Cd69 locus; (B) TFP vs. CD69 in homeostatic lymph node (LN) CD8 T cells with percentage of cells in each quadrant; (C) representative histograms of TFP expression in splenic CD8 T cells of different phenotypes (as indicated in the figure panel) from an unchallenged Cd69-TFP reporter mouse; (D) characteristic histograms of TFP expression from flow cytometry data from sorted TFPhi (top 20%), TFPmid (middle 30%) and TFPlo (bottom 20%) of splenic and lymph node-derived CD8 T cells at 0h and 24h post sort, resting in IL-7; (E) flow cytometry plots of TFP vs. CD69 in sorted TFPlo Effector and TFPhi Memory homeostatic CD8 T cells without stimulation (No Stim), 3h αCD3+αCD28 stimulation + DMSO (3h Stim + Vehicle) or 5μg/mL Actinomycin D (3h Stim + Act.D) and (F) relative change in CD69 MFI between the Vehicle and Act D treated conditions (de novo expression) in the two sorted groups, from data in S4B; (G) %CD69+, %TFPhi, CD44 MFI, %PD1+CD38+ of freshly isolated CD8 T cells through successive cycles of 48h stimulation and 72h resting in hypoxia + IL-2; (H) representative flow cytometry plots showing TFP vs. CD69, (I) %TFPhi, (J) Cd69 mRNA and (K) Jun mRNA by qPCR, (L) %PD1+CD38+ at the beginning of cycles 1, 2, 3 and endpoint (EP); (M) Peak Relative TFP and CD69 MFI between Cycle 1 and Cycle 3; (N) schematic showing the trajectory of CD8 T cells within the TFP:CD69 states (quadrants) with successive stimulation and rest, providing a reading of historic of stimulation. (Plots show mean +/− SEM; TFP negative gates derived from corresponding WT controls; statistical testing by ANOVA and post-hoc Holm-Šídák test; n=3 biological replicates representative of at least 2 independent experiments).

