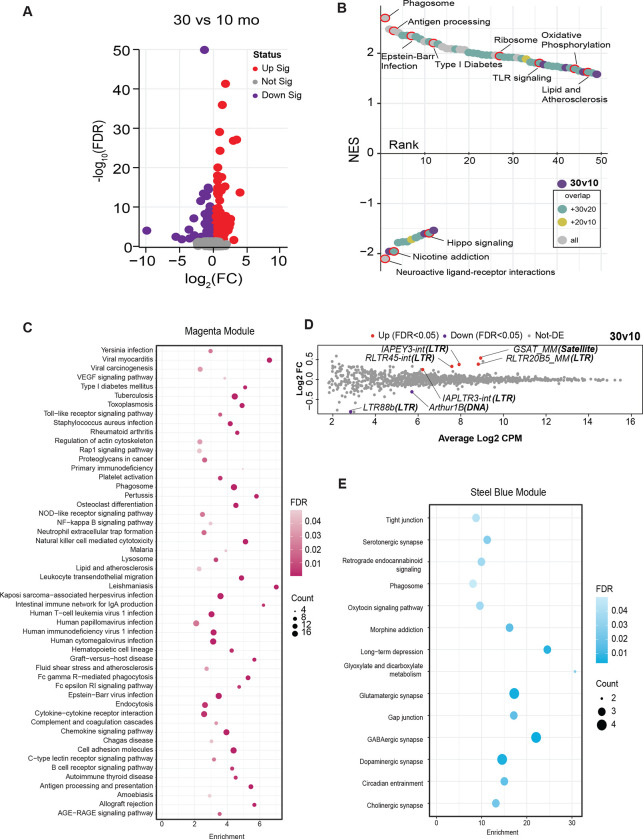
Figure 1: Aging impacts brain immune, inflammatory, and neuronal functional networks.
A) Volcano plot displaying transcripts quantified. Statistically significant transcripts are highlighted in red (upregulated) or purple (downregulated) in 30-month-old compared to 10-month-old male cortical tissue. B) Rank order plot of enriched pathways detected by GSEA. Plot is ranked by normalized enrichment score. Each point represents pathways enriched in the 30v10 comparison. Points are color-coded by overlap with other comparisons (20v10 – yellow, 30v20 – cyan, 30v10 only – purple, present in all – grey). C) KEGG pathways enriched in the Magenta module of weighted gene correlation network analysis (WGCNA). D) Mean-difference (MD) plots of transposable elements (TE) expression Log2 FC against the average Log2 count-per-million (CPM) for the 30m/10m comparison. TE callouts list the: “TE name (TE class).” E) KEGG pathways enriched in the Steel blue module of WGCNA.

