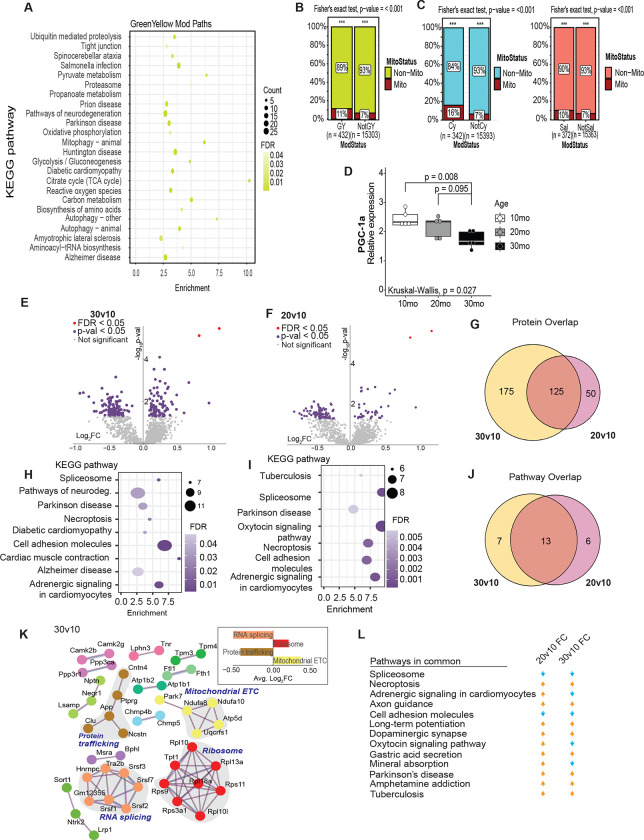
Figure 2: Metabolism of brain aging is reflected in the transcriptome and proteome.
A) KEGG pathways detected in the green-yellow module of WGCNA from age male mouse cortex. B-C) Abundance of Mitocarta 3.0 genes in the green-yellow (B), cyan, and salmon (C) modules. D) RT-qPCR detection of PGC-1a expression cortex of male mice at 10 months, 20 months, and 30 months old (n=5). E-F) Volcano plots displaying proteins quantified. Statistically significant proteins are highlighted in purple. G) Venn diagram showing the overlap between proteins that were differentially expressed in the 30-month-old mice or 20-month-old mice compared to the 10-month-old. H-I) KEGG pathways enriched in the 30-month-old cortical proteome (H) and 20-month-old cortical proteome (I). Only pathways with greater than 6 proteins were plotted. J) Venn diagram showing the overlap between enriched KEGG pathways in the 30-month-old mice, or 20-month-old mice compared to the 10-month-old cortex. K) Network identified by String analysis. Proteins are colored based on biological pathway - mitochondrial ETC (yellow), ribosome (red), protein trafficking (brown), RNA splicing (orange). L) Table displaying pathways in common between the 20v10 and 30v10 comparison and if they are activated or repressed compared to the 10-month-old mice.

