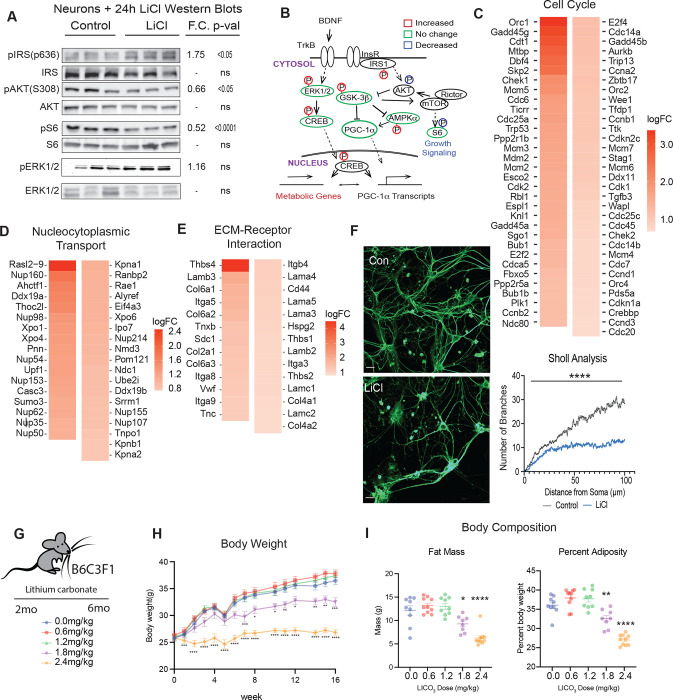
Figure 6: GSK3b plays an integrating role in growth regulation.
A) Immunodetection of phosphorylated and total protein levels of IRS, AKT, S6, and ERK1/2 in primary neurons (n=6–8). Statistical significance was determined by Student’s t-test. B) Schematic of protein expression and phosphorylation in LiCl-treated neurons by Western blot (Figs. 4C and 5A) (n=6–8). C-E) Heatmaps of cell cycle, nucleocytoplasmic transport, and extracellular matrix-receptor interaction pathways detected GSEA in lithium-treated neuron RNA-sequencing. Heatmaps are ordered by log2FC. F) Representative images (left) and quantitation (right) of immunodetection of tubulin in control and LiCl-treated primary neurons (n=13–15). Quantitation was done by Sholl analysis using the Sholl Analysis plugin in ImageJ (**** indicates p<0.0001 determined by Student’s t-test at each distance). G) Schematic of feeding timeline for lithium carbonate mouse study. Mice were fed lithium carbonate-containing food at 0, 0.6, 1.2, 1.8, and 2.4 mg/kg daily for 16 weeks (n=8–10 mice). H) Body weights of the mice fed diets containing the five doses of LiCO3. Data shown as mean ± SEM. Statistical significance determined by ordinary 2-way ANOVA. I) Body composition analysis for the LiCO3 fed mice. Total fat mass (Left) and fat mass as a percent of total adiposity (right) are shown. Individual data is shown with error bars noting mean ± SEM. Statistical significance was determined by ordinary one-way ANOVA.

