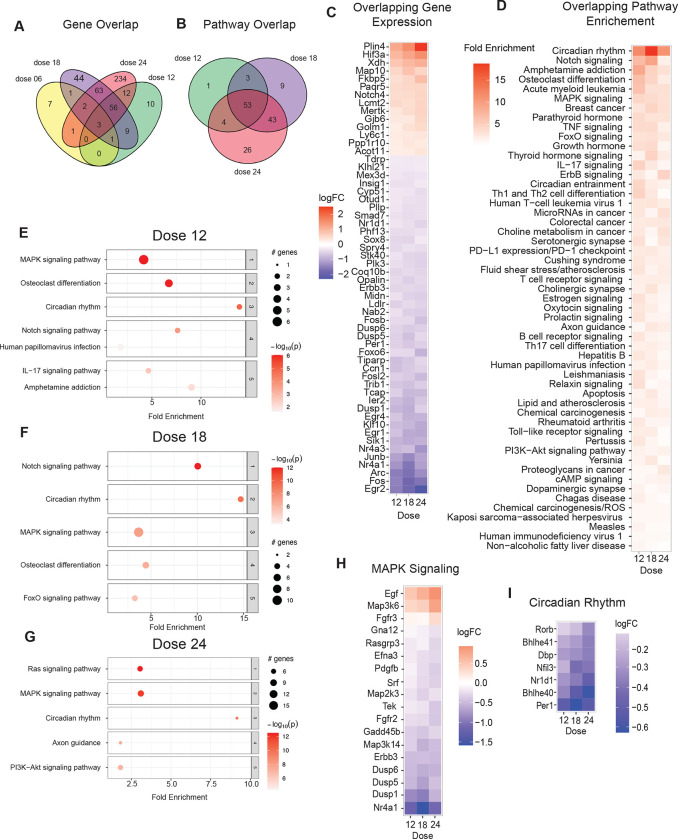
Figure 7: LiCl impacts brain growth and metabolism pathways.
A) Venn diagram of significant genes detected in the brains of mice treated with 4 different doses of LiCO3 compared to control mice (n=4). B) Venn diagram of pathways enriched in the brains of mice given 1.2, 1.8, and 2.4 g/kg/day. Pathways were detected by PathfindR. C) Heatmap of the 56 genes that are differentially expressed in all 3 doses color coded by logFC. D) Heatmap of 53 overlapping enriched pathways detected in all three doses by PathfindR ranked by fold enrichment. E-G) Dotplots of top 5 enriched pathways in the 1.2 (E), 1.8 (F) and 2.4 (G) g/kg mouse brains. H-I) Heatmap of the significantly changing genes in MAPK Signaling (H) and Circadian Rhythm (I) pathways across each of 3 doses of LiCO3 1.2, 1.8, and 2.4 g/kg.

