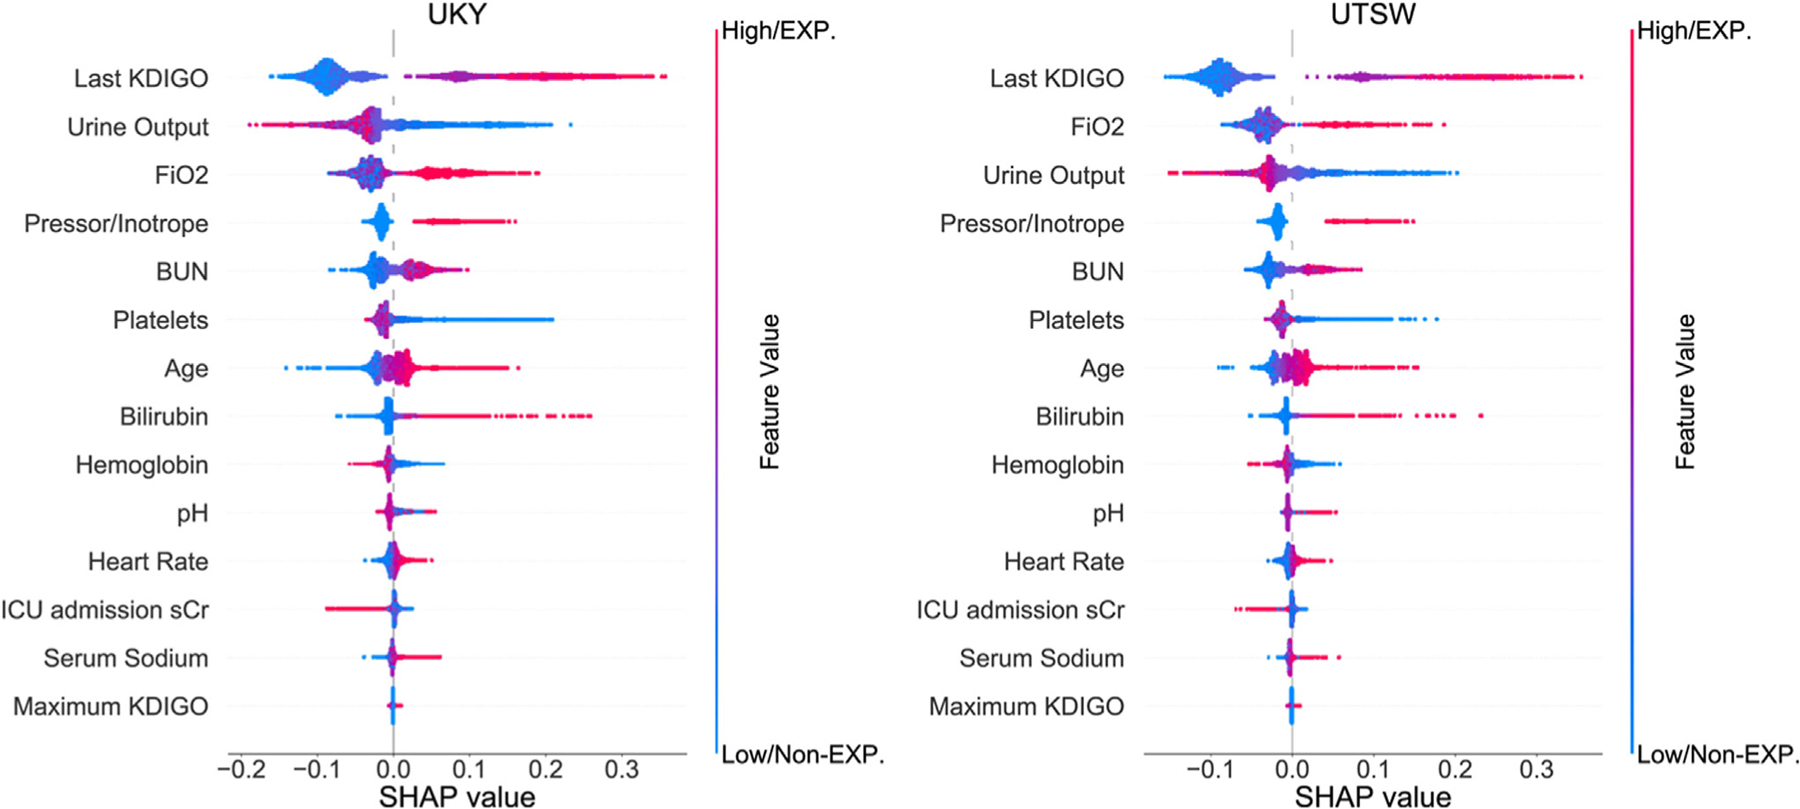
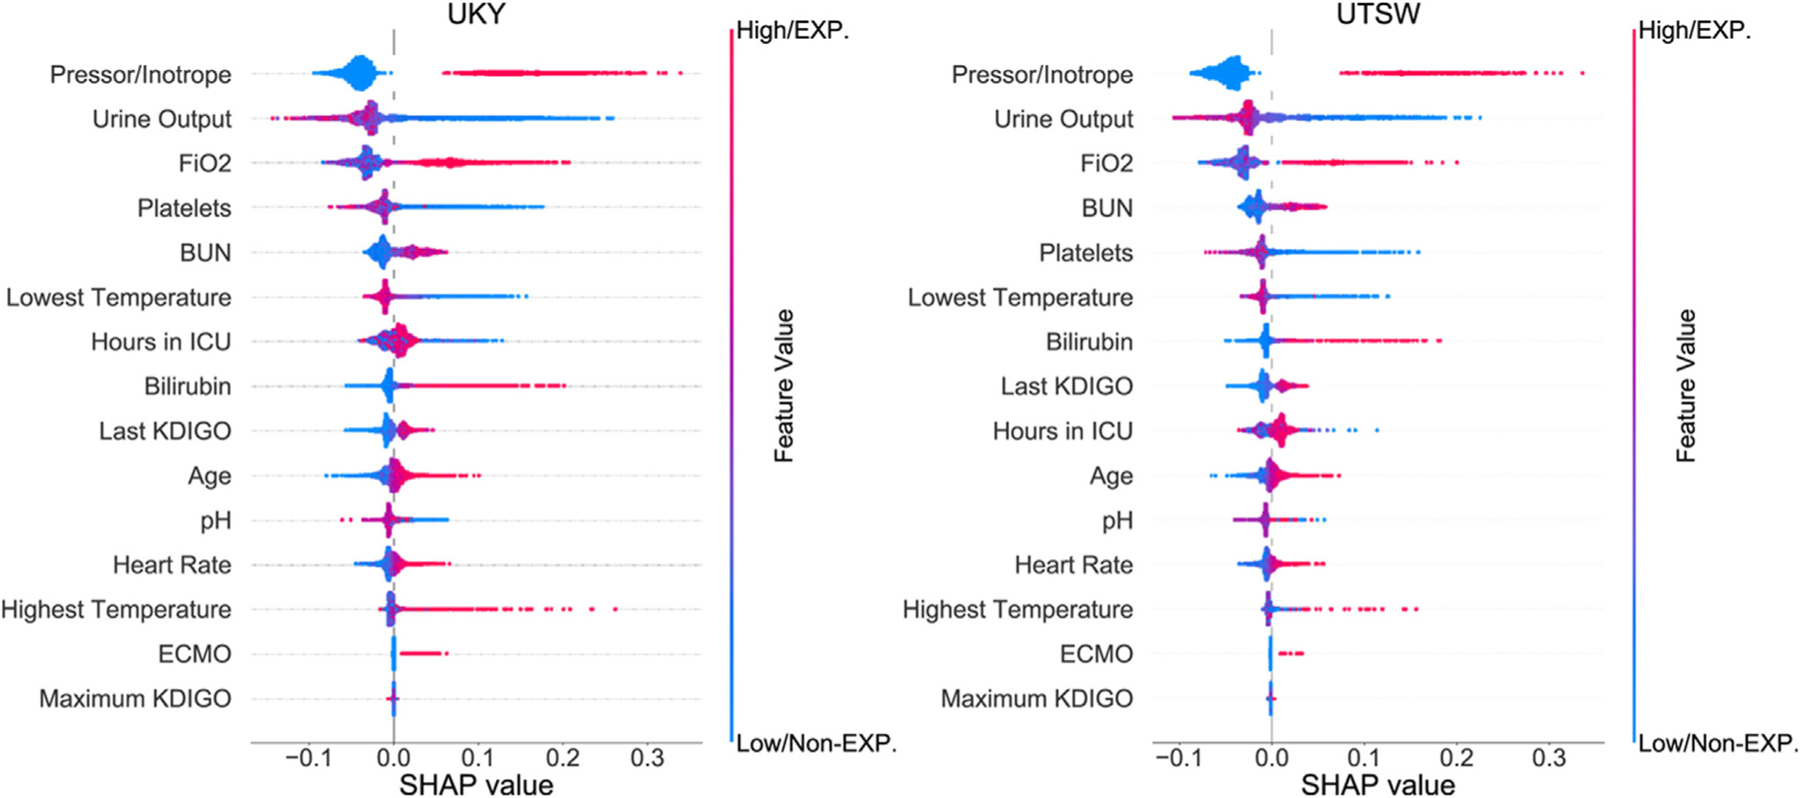
In the Original Investigation entitled “Prediction of Mortality and Major Adverse Kidney Events in Critically Ill Patients With Acute Kidney Injury” that appeared in the January 2023 issue of AJKD,1 the plot corresponding to Figure 4 was erroneously displayed for Figure 2 and vice versa. The correct versions are supplied below.
Figure 4.

SHAP (Shapley Additive Explanations) framework of top 14 final features for the prediction of major adverse kidney events. Each dot denotes a SHAP value for a feature in a particular individual. The dot color represents if the feature is present or absent (categorical data) or high versus low (continuous data): blue denotes absent/low and red denotes present/high. The x-axis represents the scale of SHAP values. A positive SHAP value for a particular feature indicates that the feature increases the predicted risk of the outcome, whereas a negative value indicates that the feature reduces the predicted risk of the outcome. The y-axis includes features ordered from top to bottom by their impact on the model prediction based on mean absolute SHAP values. Abbreviations: BUN, blood urea nitrogen; ECMO, extracorporeal membrane oxygenation; EXP, exposure; FiO2, highest fraction of inspired O2, ICU, intensive care unit; KDIGO, Kidney Disease: Improving Global Outcomes; Non-EXP, nonexposure; UKY, University of Kentucky; UTSW, University of Texas Southwestern.
Figure 2.

SHAP (Shapley Additive Explanations) framework of top 15 final features for the prediction of hospital mortality. Each dot denotes a SHAP value for a feature in a particular individual. The dot color represents if the feature is present or absent (categorical data) or high versus low (continuous data): blue denotes absent/low and red denotes present/high. The x-axis represents the scale of SHAP values. A positive SHAP value for a particular feature indicates that the feature increases the predicted risk of the outcome, whereas a negative value indicates that the feature reduces the predicted risk of the outcome. The y-axis includes features ordered from top to bottom by their impact on the model prediction based on mean absolute SHAP values. Abbreviations: BUN, blood urea nitrogen; EXP, exposure; FiO2, highest fraction of inspired O2, ICU, intensive care unit; KDIGO, Kidney Disease: Improving Global Outcomes; Non-EXP, nonexposure; UKY, University of Kentucky; UTSW, University of Texas Southwestern.
Reference
- 1.Neyra JA, Ortiz-Soriano V, Liu JL. Prediction of mortality and major adverse kidney events in critically ill patients with acute kidney injury. Am J Kidney Dis 2023;81(1):36–47. doi: 10.1053/j.ajkd.2022.06.004 [DOI] [PMC free article] [PubMed] [Google Scholar]


