

Abstract
Compared with other racial and ethnic groups in the United States, American Indian and Alaska Native (AI/AN) people experience the highest incidence of acute hepatitis c (HCV). Cherokee Nation Health Services (CNHS) implemented a pilot health screening program from January through May 2019 to assess whether conducting HCV and other preventive health screenings at food distribution sites is a feasible, acceptable, and effective strategy to increase health screening among underserved community members. Data were collected among 340 eligible participants. Most (76%) participants reported being very comfortable receiving health screenings at food distribution sites and that getting screened at food distribution sites is very easy (75.4%). Most (92.1%, n = 313) participants received HCV screening, with 11 (3.5%) individuals testing positive for HCV antibodies. Of the 11 HCV seropositive individuals, six were confirmed to have active HCV infection of which four initiated treatment. Most (55.7%) participants exhibited a body mass index in the obese range, 33.1% exhibited high hemoglobin A1C (> 6.0), 24.5% exhibited high (> 200) cholesterol, 44.6% exhibited high blood pressure ( > = 140/90), and 54.8% did not have a current primary care provider. This project demonstrated that conducting HCV and other health screenings at food distribution sites within Cherokee Nation was an effective strategy to engage AI/AN people in preventive health screenings. Future programs are needed to scale-up preventive health screenings outside of traditional medical facilities as these types of screenings may help to decrease the HCV disparities among AI/AN people.
Keywords: American Indian, Alaska Native, Hepatitis C, Screening, Community Setting
Introduction
Hepatitis C (HCV) is one of the most commonly reported notifiable conditions in the United States (U.S.), with approximately 107,300 newly identified chronic HCV cases and 66,700 acute HCV infections in 2020 [1]. Compared with other racial and ethnic groups in the U.S., American Indian and Alaska Native (AI/AN) people are disproportionately impacted by HCV, experiencing the highest rates of acute HCV, at 2.1 cases per 100,000 people in 2020, and deaths due to HCV, with a mortality rate 3.2 times higher than non-Hispanic White people [2, 3]. Studies have shown that people with HCV infection commonly experience HCV-related stigma, and that HCV-related stigma can impact access to and uptake of healthcare [4, 5].
In addition to HCV, AI/AN people experience disparities in other transmissible diseases, including human immunodeficiency virus (HIV) and syphilis, and chronic non-transmissible health conditions, including diabetes, obesity, and chronic kidney disease [6, 7]. For instance, in 2018, AI/AN people were nearly three times more likely to be diagnosed with diabetes and twice as likely to be diagnosed with end stage renal disease than non-Hispanic white adults [8]. In 2018 AI/AN males had an HIV incidence of 16.2 per 100,000 people, compared with 9.6 per 100,000 people in White males, and AI/AN females had an HIV incidence of 3.0 per 100,000 people, compared with 1.7 per 100,000 people in White females [7]. Research has demonstrated that AI/AN people are also less likely to access health care than non-Hispanic white people, including seeing a doctor, visiting emergency departments, and taking needed medications [9].
In response to the rising need for HCV care and treatment among AI/AN people, Cherokee Nation Health Services (CNHS) implemented an HCV Elimination Program in 2015. This program includes universal screening for HCV, expansion of the primary care HCV workforce, and harm reduction interventions. Since the CNHS HCV Elimination Program began, screening rates have increased for those currently receiving healthcare in CNHS [10]. However, a portion of the Cherokee population does not access CNHS and has therefore been missed for HCV screening through the program.
Community-based HCV and other health screenings have frequently been used to reach those who are missed by traditional health clinic or hospital-based screening in the U.S. For instance, health screenings at faith-based institutions and senior centers have been assessed as ways to increase screening for breast and cervical cancer [11], hypertension and cardiometabolic risks [12–14], and diabetes [13, 14] among specific minority groups, including Asian and rural African American women. Several studies have assessed HCV screening programs based in correctional facilities [15–17], homeless shelters [17, 18], and mobile medical clinics [19, 20] and have largely found these settings to be feasible and effective for HCV testing, especially when opt-out testing is implemented [21]. Research has suggested that opt-out testing, which includes notifying individuals that a test will occur unless they decline, can be an effective strategy for reducing stigma around testing and increasing testing rates for stigmatized conditions [22]. Additional locations for HCV testing that have been studied include community health centers [23], senior citizen recreation centers [24], and pharmacies [25].
Few studies have assessed the feasibility or effectiveness of conducting community-based HCV or other health screenings among AI/AN communities or the use of food distribution sites, also known as food pantries, to conduct health screenings. However, existing studies have found that non-clinic-based health screenings are acceptable [26] and useful [27, 28] for identifying disease among AI/AN communities, and that conducting health screenings among non-AI/AN people at food pantries supports identification of people with unmet healthcare needs [29, 30].
In an effort to increase the number of AI/AN people receiving HCV and other important healthcare screenings and detect individuals who could benefit from health services available through CNHS, we implemented a pilot health screening program at two food distribution sites in Cherokee Nation. Food distribution sites are frequented by community members who may be experiencing economic and social hardships, which may prevent them from accessing medical care and staying up to date on important primary health screenings [31].
Through this pilot project, we aimed to assess whether conducting health screenings at food distribution sites is an acceptable and effective strategy to increase HCV and other health screening among underserved community members within Cherokee Nation. Specifically, the project aims were to assess the feasibility and acceptability of conducting health screening at food distribution sites; assess whether conducting health screenings at food distribution sites is an effective strategy for reaching and expanding the population of community members that receive health screening; and identify demographic and clinical characteristics of individuals who frequent food distribution sites, including HCV status. Finally, we aimed to describe the demographic and clinical characteristics of those who were screened and tested positive for HCV.
Methods
Setting
Cherokee Nation is the largest federally recognized tribe in the U.S., with a 14-county reservation area in northeastern Oklahoma [32]. The Cherokee Nation Food Distribution Program operates seven food distribution stores within the reservation that provide food to eligible AI/AN people [33]. To be eligible for the Cherokee Nation Food Distribution Program, one household member must be a citizen of a federally recognized tribe, the household must reside within the Cherokee Nation tribal jurisdictional area, and household income must not exceed the U.S. Department of Agriculture’s Food and Nutrition Service income eligibility requirements [33].
This pilot project was conducted at two Cherokee food distribution sites. The first site is located in Tahlequah, a city of 16,463 people, 30.6% of whom are AI/AN [34]. Health screenings at the Tahlequah food distribution site occurred from January 12th through 19th, 2019. The second site is located in Sallisaw, a city of 8,483 people, 20.4% of whom are AI/AN [35]. Health screenings at the Sallisaw food distribution site occurred from May 1st through 15th, 2019.
This study was approved by the Cherokee Nation Institutional Review Board on November 26th, 2018. This study also received approval from the participating food distribution site authorities.
Planning and Feasibility Assessment
In this pilot project, feasibility was defined as agreement among project staff that the implementation of the health screenings was able to be successfully undertaken [36, 37]. As part of planning procedures, and to assess potential feasibility of health screenings at food distributions sites, project staff conducted pilot observation days to better understand the process of receiving food from the food distribution store, the volume of community members attending the food distribution sites and times of high traffic at participating food distribution sites. These observation days informed the pilot health screening approach, including which days and times would be best to conduct screenings.
Three pilot observation days were conducted during a one-week period in August 2019 at the Tahlequah food distribution site, including a Monday, Thursday and Friday. Observations were conducted during a one to two-hour period between 10:00am and 3:30pm on a given day. A total of 207 individuals were observed entering the Tahlequah food distribution site across the three observation days. Approximately half (50.7%; n = 105) of these individuals were observed on Monday, and the rest were spread across the other two days, 61 (29.5%) individuals on Thursday and 41 (19.8%) individuals on Friday. The middle of the day, around 1:00pm, appeared to be the busiest time. Informed by the pilot observation days, project staff decided to implement screenings in the early afternoon at the two food distribution sites to offer the most individuals the opportunity to receive health screenings without impeding the food distribution site staffs’ workflow.
Food Distribution Site Health Screenings
Eligibility
All unique AI/AN people 18 years and older who visited the food distribution sites during the pilot project period, who were able and willing to provide consent, were eligible to participate in health screenings.
Recruitment and Enrollment
To recruit participants for the health screenings, healthcare workers were stationed at check in areas when individuals checked in at the sites to redeem their food vouchers. Healthcare workers greeted and informed people who arrived at the site of the health screening event occurring that day. All interested individuals then proceeded to a table that was set up close to the waiting area to receive information on eligibility, services offered, and to complete consent procedures.
During the consent process, eligible individuals received a list of health screening options from which they could opt-out of any screenings they did not wish to receive. The project team decided to implement this testing protocol based on research suggesting that providing patients with the opportunity to opt-out of specific screenings it can be an effective strategy for reducing stigma around testing and increasing testing rates for stigmatized conditions [22]. This list of screenings included screenings for HCV, Human Immunodeficiency Virus (HIV), syphilis, blood pressure, calculated body mass index (BMI), diabetes/pre-diabetes, and lipids profile. Interested individuals were then assessed for eligibility and recruited for participation (Fig. 1). All enrolled participants were offered a $20 gift card for their participation in the health screenings, regardless of which screenings they chose to receive.
Fig. 1.

Process for participant recruitment, enrollment, and specimen collection for health screenings at food distribution sites, 2019
Data Collection
Clinical staff administering health screenings collected all survey measures for this pilot project using a paper-based intake form. This intake form included questions regarding eligibility for project enrollment. If the individual was eligible to participate in health screenings, the staff member continued a structured interview to complete acceptability and demographic intake form questions. Clinical staff also recorded all screenings received, and later recorded screening results, using the same form. If the participant was enrolled at CNHS and received a health screening result outside of the normal range, clinical staff reviewed participant electronic medical records to assess whether the participant had a recorded history of the health screening result outside of the normal range and if it was being addressed. For people who did not have a history of a screening test being outside of the normal range, or if a screening test outside of the normal range had not been addressed, they were offered a follow-up appointment. If people did not have an existing medical record and were eligible for services, a medical record was created for them.
Measures
Acceptability measures included participant-reported comfort receiving health screenings at a food distribution site, using a 4-point Likert scale from very comfortable to very uncomfortable, as well as participant-reported ease receiving health screenings at a food distribution site, using a 4-point Likert scale from very easy to very difficult.
Additional measures included screening date, screening location, current enrollment in CNHS, gender, age, marital status, highest level of education completed, employment status, housing status, health insurance status, lifetime history of homelessness, homelessness in the past six months, lifetime history of incarceration, incarceration in the past six months, frequency of tobacco use, frequency of alcohol use, lifetime history of injection drug use, injection drug use in the past six months, and indicators related to all services received at the pilot screening, including screening for HCV, HIV, syphilis via rapid plasma regain (RPR) test, blood pressure, weight, height, calculated BMI, diabetes via hemoglobin A1C (A1C) and estimated average glucose (eAG), and lipids profile [low-density lipoprotein cholesterol (LDL), high-density lipoprotein cholesterol (HDL), and triglycerides], and the results from these screenings.
Specimen Collection
Health screenings occurred in a private room set up specifically for the screenings that day. Phlebotomy was the standard method for conducting laboratory testing. Participants accepting phlebotomy were screened for HIV, HCV, cholesterol level, syphilis, and A1C, or by a combination of these as requested by each participant. Participants that declined phlebotomy were offered HCV rapid testing by finger stick.
Abnormal laboratory findings were communicated to the participant via telephone or face-to-face. If the participant had a primary care provider (PCP) and agreed for this information to be shared with the PCP, the results were forwarded to them for follow-up. If the participant did not have a PCP, the participant was given the option to come to the CNHS Specialty Clinic for an appointment or walk-in visit at their convenience.
Data Analysis
Quantitative participant data were analyzed using descriptive statistics including counts, proportions, and graphs. All quantitative analyses were performed using IBM SPSS statistics 19 [38].
Results
Health Screening Participant Demographics
Table 1 describes the demographic characteristics of participants. A total of 356 people were screened for eligibility to participate in food distribution site screenings, 340 (95.5%) of whom were eligible to participate. Among the 340 eligible individuals, 184 (54.1%) were screened at the Tahlequah site and 156 (45.9%) were screened at the Sallisaw site. Approximately two-thirds (66.0%) of all participants were female. Compared with other age ranges, the largest proportion of participants (39.8%) were 40 to 59 years of age. About two-fifths (42.8%) of participants reported being single, while 33.0% reported being married. Three-fourths (75.5%) of participants had a high school education or less, while the remaining 24.5% of participants reported a college education. Two-thirds (66.3%) of participants were unemployed (Table 1).
Table 1.
Demographics among 340 participants who were screened at food distribution sites, 2019
| Characteristic | Tahlequah (n = 184) | Sallisaw (n = 156) | Total (N = 340) | |||
|---|---|---|---|---|---|---|
| n | % | n | % | N | % | |
| Gender | 182 | 338 | ||||
| Female | 115 | 63.2 | 108 | 69.2 | 223 | 66.0 |
| Male | 67 | 36.8 | 48 | 30.8 | 115 | 34.0 |
| Age | 182 | 154 | 336 | |||
| 20 to 29 years | 26 | 14.3 | 15 | 9.7 | 41 | 12.2 |
| 30 to 39 years | 34 | 18.7 | 16 | 10.4 | 50 | 14.9 |
| 40 to 49 years | 39 | 21.4 | 31 | 20.1 | 70 | 20.8 |
| 50 to 59 years | 38 | 20.9 | 26 | 16.9 | 64 | 19.0 |
| 60 to 69 years | 21 | 11.5 | 33 | 21.4 | 54 | 16.1 |
| 70 years or older | 24 | 13.2 | 33 | 21.4 | 57 | 17.0 |
| Marital status | 183 | 339 | ||||
| Single | 95 | 51.9 | 50 | 32.1 | 145 | 42.8 |
| Married | 45 | 24.6 | 67 | 42.9 | 112 | 33.0 |
| Divorced | 31 | 16.9 | 16 | 10.3 | 47 | 13.9 |
| Widowed | 12 | 6.6 | 23 | 14.7 | 35 | 10.3 |
| Education level | 180 | 147 | 327 | |||
| High school or less | 128 | 71.1 | 119 | 81.0 | 247 | 75.5 |
| College (Associate level) | 28 | 15.5 | 21 | 14.3 | 49 | 15.0 |
| College (Bachelor level) | 15 | 8.3 | 5 | 3.4 | 20 | 6.1 |
| Graduate school | 9 | 5.0 | 2 | 1.4 | 11 | 3.4 |
| Employment status | 151 | 335 | ||||
| Not employed | 114 | 61.9 | 108 | 71.5 | 222 | 66.3 |
| Employed, full time | 60 | 32.6 | 32 | 21.2 | 92 | 27.5 |
| Employed, part time | 10 | 5.4 | 11 | 7.3 | 21 | 6.3 |
| Housing status | 181 | 148 | 329 | |||
| Permanent housing | 133 | 73.5 | 126 | 85.1 | 259 | 78.7 |
| Temporary housing | 41 | 22.7 | 18 | 12.2 | 59 | 17.9 |
| Homeless | 7 | 3.9 | 4 | 2.7 | 11 | 3.3 |
| Lifetime history of homelessness | 151 | 335 | ||||
| No | 144 | 78.3 | 131 | 86.8 | 275 | 82.1 |
| Yes | 40 | 21.7 | 20 | 13.2 | 60 | 17.9 |
| Homeless, past 6 months | 38 | 20 | 58 | |||
| No | 28 | 73.7 | 17 | 85.0 | 45 | 77.6 |
| Yes | 10 | 26.3 | 3 | 15.0 | 13 | 22.4 |
| Lifetime history of incarceration | 183 | 147 | 330 | |||
| No | 154 | 84.2 | 119 | 81.0 | 273 | 82.7 |
| Yes | 29 | 15.8 | 28 | 19.0 | 57 | 17.3 |
| Incarceration, past 6 months | 30 | 26 | 56 | |||
| No | 26 | 86.7 | 24 | 92.3 | 50 | 89.3 |
| Yes | 4 | 13.3 | 2 | 7.7 | 6 | 10.7 |
| Insurance status | 182 | 149 | 331 | |||
| Insured | 102 | 56.0 | 77 | 51.7 | 179 | 54.1 |
| No insurance | 80 | 44.0 | 72 | 48.3 | 152 | 45.9 |
| Enrolled at CNHS | 153 | 337 | ||||
| Yes | 156 | 84.8 | 143 | 93.5 | 299 | 88.7 |
| No | 16 | 8.7 | 2 | 1.3 | 18 | 5.3 |
| Unsure | 12 | 6.5 | 8 | 5.2 | 20 | 5.9 |
| Primary care provider | 179 | 151 | 330 | |||
| No | 107 | 59.8 | 74 | 49.0 | 181 | 54.8 |
| Yes | 72 | 40.2 | 77 | 51.0 | 149 | 45.2 |
Fifty-nine (17.9%) participants reported living in temporary housing, 11 (3.3%) reported being currently homeless, and 60 (17.9%) reported experiencing homelessness in their lifetime. Among those who reported experiencing homelessness in their lifetime, 22.4% reported experiencing homelessness within the past six months. Fifty-seven (17.3%) participants reported being incarcerated in their lifetime and six (10.7%) of these individuals reported incarceration within the last six months (Table 1).
Health Care Status
Among respondents, slightly less than half of participants (45.9%) reported being uninsured. Most respondents (88.7%, n = 299) reported currently being enrolled at CNHS at the time of their health screening and 11.2% (n = 38) were either not enrolled or were unsure if they were enrolled at CNHS. Fewer than half of pilot participants (45.2%) reported having a current PCP (Table 1).
Substance Use
Across pilot health screening participants, approximately two-fifths (40.1%) reported using tobacco daily and approximately 12% reported using alcohol either weekly or daily. Twenty-six (7.8%) participants reported injecting drugs in their lifetime, six of whom (26.1%) reported that they had injected drugs in the past six months (Table 2).
Table 2.
Substance use among 340 participants screened at food distribution sites, 2019
| Characteristic | Tahlequah (n = 184) | Sallisaw (n = 156) | Total (N = 340) | |||
|---|---|---|---|---|---|---|
| n | % | n | % | N | % | |
| Tobacco use | 179 | 150 | 329 | |||
| Never | 88 | 49.2 | 75 | 50.0 | 163 | 49.5 |
| Monthly or less than 1 time/month | 12 | 6.7 | 6 | 4.0 | 18 | 5.5 |
| Weekly | 10 | 5.6 | 6 | 4.0 | 16 | 4.9 |
| Daily | 69 | 38.5 | 63 | 42.0 | 132 | 40.1 |
| Alcohol use | 183 | 149 | 332 | |||
| Never | 109 | 59.6 | 106 | 71.1 | 215 | 64.8 |
| Monthly or less than 1 time/month | 49 | 26.8 | 28 | 18.8 | 77 | 23.2 |
| Weekly | 19 | 10.4 | 10 | 6.7 | 29 | 8.7 |
| Daily | 6 | 3.3 | 5 | 3.4 | 11 | 3.3 |
| Lifetime history of injecting drugs | 151 | 335 | ||||
| No | 171 | 92.9 | 138 | 91.4 | 309 | 92.2 |
| Yes | 13 | 7.1 | 13 | 8.6 | 26 | 7.8 |
| Injected drugs, past 6 months | 12 | 11 | 23 | |||
| No | 7 | 58.3 | 10 | 90.9 | 17 | 73.9 |
| Yes | 5 | 41.7 | 1 | 9.1 | 6 | 26.1 |
Acceptability
Most pilot participants reported being very (76%) or somewhat (21.6%) comfortable receiving health screenings at food distribution sites, with a higher proportion of “very comfortable” participants in Sallisaw (86%) compared with Tahlequah (67.8%). Most participants reported that getting screened at food distribution sites is easy, with three-fourths (75.4%) reporting that getting screened at food distribution sites is very easy (Table 3).
Table 3.
Acceptability of health screening at food distribution sites among 340 participants, 2019
| Characteristic | Tahlequah (n = 184) | Sallisaw (n = 156) | Total (N = 340) | |||
|---|---|---|---|---|---|---|
| n | % | n | % | N | % | |
| Comfort getting screened at food distribution site | 183 | 150 | 333 | |||
| Very comfortable | 124 | 67.8 | 129 | 86.0 | 253 | 76.0 |
| Somewhat comfortable | 54 | 29.5 | 18 | 12.0 | 72 | 21.6 |
| Somewhat uncomfortable | 5 | 2.7 | 2 | 1.3 | 7 | 2.1 |
| Very uncomfortable | 0 | 0 | 1 | 0.7 | 1 | 0.3 |
| Ease of getting screened at food distribution site | 178 | 147 | 325 | |||
| Very easy | 131 | 73.6 | 114 | 77.6 | 245 | 75.4 |
| Somewhat easy | 46 | 25.8 | 27 | 18.4 | 73 | 22.5 |
| Somewhat difficult | 1 | 0.8 | 5 | 3.4 | 6 | 1.8 |
| Very difficult | 0 | 0 | 1 | 0.7 | 1 | 0.3 |
| Primary reason for frequenting the food distribution site that day a | 149 | 149 | ||||
| I obtain food at this site | ------ | ------ | 98 | 65.8 | 98 | 65.8 |
| A family member who obtains food/services at this site told me about the screening | ------ | ------ | 18 | 12.1 | 18 | 12.1 |
| A friend who obtains food/ services at this site told me about the screening | ------ | ------ | 13 | 8.7 | 13 | 8.7 |
| Other reason b | ------ | ------ | 20 | 13.4 | 20 | 13.4 |
a This question was added for the Sallisaw health screenings after project staff observed that not all individuals at the Tahlequah screenings were attending to obtain vouchers for food to gain a better understanding of the sample population
b Other reasons included working/volunteering at the site, obtaining other services at the site, supporting others with obtaining food/services at the site
HCV Screening Results
92% (92.1%, n = 313) pilot participants received screening for HCV. Among these individuals, 167 (53.4%) participated in screenings at the Tahlequah site and 146 (46.6%) participated in screenings from the Sallisaw site. Eleven (3.5%) individuals received positive HCV antibody results across the two sites. Among the 11 individuals with positive HCV antibody results, five did not have a recorded history of HCV (Tables 4 and 5).
Table 4.
Health screening results among 340 food distribution site project participants, 2019
| Characteristic | Tahlequah (n = 184) | Sallisaw (n = 156) | Total (N = 340) | |||
|---|---|---|---|---|---|---|
| n | % | n | % | N | % | |
| Blood pressure | 181 | 77 | 258 | |||
| High ( > = 140/90) | 83 | 45.9 | 32 | 41.6 | 115 | 44.6 |
| Normal (90/60–140/90) | 98 | 54.1 | 45 | 58.4 | 143 | 55.4 |
| Body Mass Index (BMI) | 198 | 12 | 210 | |||
| Obese | 111 | 56.1 | 6 | 50.0 | 117 | 55.7 |
| Overweight | 50 | 25.3 | 5 | 41.7 | 55 | 26.2 |
| Normal weight | 34 | 17.2 | 0 | 0.0 | 34 | 16.2 |
| Underweight | 3 | 1.5 | 1 | 8.3 | 4 | 1.9 |
| Diabetes (A1C) | 114 | 67 | 181 | |||
| High (> 6.0) | 35 | 30.7 | 25 | 37.3 | 60 | 33.1 |
| Normal (4.5-6.0) | 79 | 69.3 | 41 | 61.2 | 120 | 66.3 |
| Low (< 4.5) | 0 | 0 | 1 | 1.5 | 1 | 0.6 |
| Diabetes (eAG) | 111 | 0 | 111 | |||
| High (> 126 mg/dl) | 34 | 30.6 | ------ | ------ | 34 | 30.6 |
| Normal (70–126 mg/dl) | 76 | 68.5 | ------ | ------ | 76 | 68.5 |
| Low (< 70 mg/dl) | 1 | 0.9 | ------ | ------ | 1 | 0.9 |
| Cholesterol | 115 | 73 | 188 | |||
| High (> 200) | 30 | 26.1 | 16 | 21.9 | 46 | 24.5 |
| Normal ( < = 200) | 85 | 73.9 | 57 | 78.1 | 142 | 75.5 |
| HDL | 114 | 0 | 114 | |||
| High (> 60) | 7 | 6.1 | ------ | ------ | 7 | 6.1 |
| Normal (40–60) | 52 | 45.6 | ------ | ------ | 52 | 45.6 |
| Low (< 40) | 55 | 48.2 | ------ | ------ | 55 | 48.2 |
| LDL | 114 | 0 | 114 | |||
| High (> 100) | 67 | 58.8 | ------ | ------ | 67 | 58.8 |
| Normal (0-100) | 47 | 41.2 | ------ | ------ | 47 | 41.2 |
| Triglycerides | 114 | 0 | 114 | |||
| High (> 150) | 61 | 53.5 | ------ | ------ | 61 | 53.5 |
| Normal ( < = 150) | 53 | 46.5 | ------ | ------ | 53 | 46.5 |
| HCV a | 167 | 146 | 313 | |||
| Negative | 164 | 98.2 | 138 | 94.5 | 302 | 96.5 |
| Positive | 3 | 1.8 | 8 | 5.5 | 11 | 3.5 |
| HIV | 112 | 78 | 190 | |||
| Negative | 112 | 100 | 77 | 98.7 | 189 | 99.5 |
| Positive | 0 | 0 | 1 | 1.3 | 1 | 0.5 |
| Syphilis (RPR) | 115 | 79 | 194 | |||
| Negative | 114 | 99.1 | 79 | 100 | 193 | 99.5 |
| Positive | 1 | 0.9 | 0 | 0 | 1 | 0.5 |
a Among the 11 individuals who received positive antibody test results for HCV, five had undetectable viral loads at follow-up and did not require treatment, while six had detectable viral loads. Among the six individuals with detectable viral loads, four initiated HCV treatment and two did not initiate treatment and were recorded as lost to follow-up. Among the four individuals who initiated treatment, two completed treatment. Among the 11 individuals with positive HCV antibody results, five had a history of injecting drugs, and seven each had experienced incarceration and homelessness in the past. Five of the 11 individuals did not have a previous history of HCV. Five of the six individuals who required HCV treatment were male
Table 5.
Health history among 340 food distribution site project participants, 2019a
| Characteristic | Tahlequah (n = 184) | Sallisaw (n = 156) | Total (N = 340) | |||
|---|---|---|---|---|---|---|
| n | % | n | % | N | % | |
| History of Diabetes | 96 | 153 | 249 | |||
| No | 57 | 59.4 | 125 | 81.7 | 182 | 73.1 |
| Yes | 39 | 40.6 | 28 | 18.3 | 67 | 26.9 |
| Diabetes addressed? (yes) b | 38 | 97.4 | 27 | 96.4 | 65 | 97.0 |
| Diabetes medication, past 12 months (yes) b | 35 | 89.7 | 25 | 89.3 | 60 | 92.3 |
| History of high cholesterol | 97 | 153 | 250 | |||
| No | 67 | 69.1 | 145 | 94.8 | 212 | 84.8 |
| Yes | 30 | 30.9 | 8 | 5.2 | 38 | 15.2 |
| Cholesterol addressed? (yes) c | 29 | 96.7 | 7 | 87.5 | 36 | 94.7 |
| Cholesterol medication, past 12 months (yes) c | 26 | 86.7 | 7 | 87.5 | 33 | 86.8 |
| History of HCV | 84 | 151 | 235 | |||
| No | 82 | 97.6 | 146 | 96.7 | 228 | 97.0 |
| Yes d | 2 | 2.4 | 5 | 3.3 | 7 | 3.0 |
| HCV addressed? (yes) e | 2 | 100 | 4 | 80.0 | 6 | 85.7 |
| HCV medication, past 12 months (yes) | 0 | 0 | 4 | 80.0 | 4 | 57.1 |
| History of HIV | 80 | 152 | 232 | |||
| No | 80 | 100 | 151 | 97.3 | 231 | 99.6 |
| Yes | 0 | 0 | 1 | 0.7 | 1 | 0.4 |
| HIV addressed? (yes) f | ------ | ------ | 1 | 100 | 1 | 100 |
| HIV medication, past 12 months (yes) f | ------ | ------ | 1 | 100 | 1 | 100 |
| History of syphilis (no) | 81 | 100 | 152 | 100 | 233 | 100 |
a Health history is only included for those individuals who were previously enrolled in CNHS and thus had a recorded health history through CNHS
b Percent taken from the number who have a history of diabetes
c Percent taken from the number who have a history of high cholesterol
d Those with a history of HCV were not the same individuals who tested positive for HCV during these screening
e Percent taken from the number who have a history of HCV, not among total who screened positive
f Percent taken from the number who have a history of HIV
Of the 11 HCV seropositive individuals, six (54.5%) were found to have current HCV infection by quantifiable HCV RNA test, two (18.2%) of whom did not have a recorded history of HCV and four (67%) of whom initiated HCV treatment. Among the four individuals who initiated treatment, two completed treatment, while two were lost to follow-up after treatment initiation (Fig. 2). In addition, five of the 11 individuals reported a history of injecting drugs, seven individuals had experienced incarceration in the past, and seven individuals had experienced homelessness in the past.
Fig. 2.
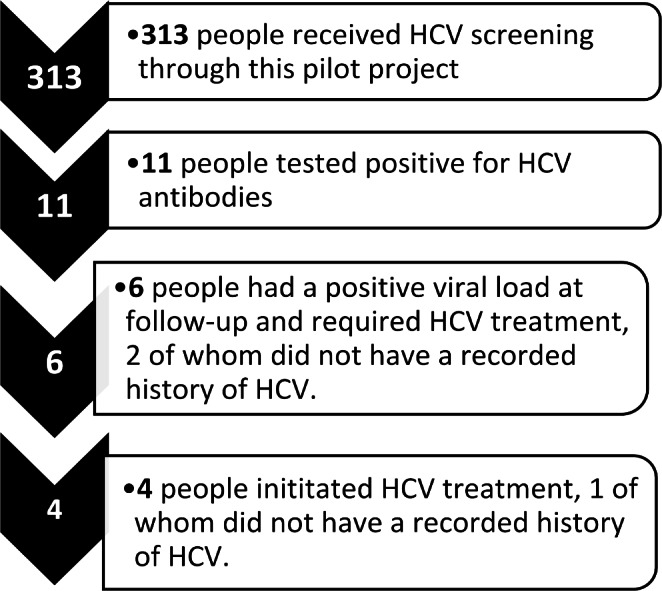
HCV screening, positivity, and treatment in Cherokee Nation as a result of pilot food distribution site screening, 2019
Demographic characteristics among those who were screened for HCV paralleled the demographic characteristics of those who received any health screenings at the food distribution sites (Table 6).
Table 6.
Subset of demographics among 313 participants screened for HCV at food distribution sites, 2019
| Characteristic | Total (N = 313) | |
|---|---|---|
| N | % | |
| Gender | 312 | |
| Female | 203 | 65.1 |
| Male | 109 | 34.9 |
| Age | 310 | |
| 20 to 29 years | 36 | 11.6 |
| 30 to 39 years | 48 | 15.5 |
| 40 to 49 years | 63 | 20.3 |
| 50 to 59 years | 61 | 19.7 |
| 60 to 69 years | 52 | 16.8 |
| 70 years or older | 50 | 16.2 |
| Marital status | 312 | |
| Single | 135 | 43.3 |
| Married | 106 | 34.0 |
| Divorced | 41 | 13.1 |
| Widowed | 30 | 9.6 |
| Education level | 304 | |
| High school or less | 229 | 75.3 |
| College (Associate level) | 44 | 14.5 |
| College (Bachelor level) | 20 | 6.6 |
| Graduate school | 11 | 3.6 |
| Employment status | 308 | |
| Not employed | 201 | 65.3 |
| Employed, full time | 87 | 28.2 |
| Employed, part time | 20 | 6.5 |
| Housing status | 303 | |
| Permanent housing | 242 | 79.9 |
| Temporary housing | 51 | 16.8 |
| Homeless | 10 | 3.3 |
| Insurance status | 305 | |
| Insured | 165 | 54.1 |
| No insurance | 140 | 45.9 |
| Incarceration, ever | 303 | |
| No | 250 | 82.5 |
| Yes | 53 | 17.5 |
Other Health Screening Results
Nearly half (44.6%) of participants exhibited high blood pressure ( > = 140/90) and more than half (55.7%, n = 117) of participants exhibited a BMI that put them in the obese range. Approximately one-third (33.1%, n = 60) of participants had high A1C (> 6.0) screenings, 24 (40.0%) of whom did not have a recorded history of pre-diabetes or diabetes. In addition, nearly one-quarter (24.5%) exhibited high (> 200) cholesterol screenings, 34 (73.9%) of whom did not have a recorded history of high cholesterol. No new cases of HIV were identified and only one new case of syphilis was identified through these health screenings (Tables 4 and 5).
Discussion
This pilot project demonstrated that conducting HCV and other preventive health screenings at food distribution sites in Cherokee Nation is both feasible and acceptable to community members. There was high participation in all health screenings at the two food distribution sites in this pilot project. Most (76%) participants reported being very comfortable receiving health screenings at food distribution sites and that the screening process was very easy (75.4%).
A primary project goal was to reach community members that may not have easy access to health care. Conducting health screenings at food distribution sites allowed health workers to meet community members where they were. This potentially removed additional barriers to healthcare access, such as transportation, money or other logistical challenges, which may have prevented participants from receiving health care in traditional clinical settings. The high proportions of participants who had experienced homelessness, incarceration, and did not have a PCP demonstrated that conducting HCV and other health screenings at food distribution sites provided an opportunity to engage with individuals who may be facing substantial social and economic hardships. At their request, participants who were not currently enrolled in health services were input into the CNHS system and linked to care if they chose to seek additional health treatment and follow-up.
To reduce potential stigma associated with receiving HCV screening, HCV testing was offered as one of many healthcare screenings that participants could receive at the food distribution sites to support their long-term and short-term health. This pilot project demonstrated that offering health screenings at food distribution sites is an effective strategy for reaching and increasing the population of Cherokee Nation tribal citizens who are screened for HCV, in addition to other important chronic health conditions in Cherokee Nation. Through this project, clinical staff screened 313 individuals for HCV and identified six (1.9%) individuals for HCV treatment, two of whom may not have otherwise been identified as they did not have a recorded history of HCV. Individuals who frequented pilot food distribution sites exhibited a similar overall prevalence of HCV (1.9%) compared to the most recently reported HCV prevalence across Oklahoma (2.0%), with the prevalence among males (4.6%) slightly higher and females (0.5%) slightly lower in our pilot population compared with the HCV prevalence in Oklahoma (2.7% among males; 1.3% among females (30).
To our knowledge, there are no comparable community-based HCV screening programs that have been implemented in Indian Country. Two prior studies by Norton et al. and Kempf et al. similarly concluded that HCV screening is acceptable [39, 40] and feasible [40] in community settings. Norton et al. assessed acceptability across two homeless shelters, two drug rehabilitation centers, and one women’s drop-in center in Raleigh, North Carolina [39]. Kempf et al. assessed acceptability and feasibility among communities in rural Alabama and Mississippi [40]. Findings across urban community-based HCV screening programs, which included programs based in correctional facilities [16, 17, 21], mobile medical clinics [19, 20], community health centers and/or sexually transmitted infection clinics [17, 23], substance use disorder and/or syringe exchange programs [17, 23, 41], homeless shelters [17, 18], a health fair [42], a community pharmacy [25], and senior centers [24] varied widely, with HCV positivity ranging from 1.2% in a community pharmacy in San Francisco [25] to 86% among people living in homeless shelters in Los Angeles [18].
The findings in this study are subject to at least five limitations. First, since this pilot project was only implemented in two of the seven food distribution sites that Cherokee Nation operates, findings cannot be generalized to the full population of individuals who frequent food distribution sites across Cherokee communities. Second, there was heavy rain and flooding that occurred during the weeks that screenings were offered in Sallisaw, which may have prevented certain groups of individuals from frequenting the site who otherwise would have, leading to selection bias. Third, participants who frequented the sites during the later health screening days may also represent a biased sample. Approximately one-fifth (20.8%) of participants reported going to the food distribution site specifically for the health screening upon recommendation from a friend or family member. In this way, participants may be more similar to each other than they would be in a random sample of individuals who frequent food distribution sites. Fourth, providing participants with a gift card may have influenced recruitment for this pilot project, incentivizing individuals to obtain health screenings who otherwise may not have participated. Fifth, although insurance, employment, and housing status were collected, neither income status nor information on those who declined to participate in the health screenings were collected, which may have provided a broader understanding of the participant sample.
Future programs are needed to scale-up health screenings across food distribution sites, as well as to identify additional locations to engage community members in health screening within Cherokee Nation. Through identifying alternative HCV screening approaches, project staff successfully increased the number of individuals screened and treated for HCV in Cherokee Nation, improving equity in HCV related care. Through identifying and learning additional strategies to screen individuals in Cherokee Nation for HCV who otherwise may have been missed, and through engaging new Cherokee individuals in CNHS, this project supported overall health and HCV elimination efforts in Cherokee Nation.
Conclusion
Limited research on strategies to engage individuals in non-clinic-based screening have been conducted among AI/AN communities in the U.S. Findings from this project demonstrate that more strategies are needed to reach populations who are missed through current screening efforts, and that implementing preventive health screening at food distribution sites or similar community service-based sites may be a helpful strategy for engaging community members in healthcare, not only for HCV, but for other infectious and chronic health conditions. Results from this pilot project may be useful to other AI/AN communities hoping to expand non-clinic-based health screening programs.
Acknowledgements
The authors would like to acknowledge Shane Dominick from Cherokee Nation Public Health, Stephanie Hammons from Cherokee Nation Health Services, and Leah Duncan from Cherokee Nation Food Distribution Program for their support with conceptualizing and implementing this project, and Wendy Nakatsukasa-Ono from Cardea Services for her guidance during this project.
Author Contributions
WE and JM led the conceptualization, implementation, and data collection for this pilot project. All authors contributed to project design and material preparation. MF performed the analysis for this project. All authors contributed to writing this manuscript and have read and reviewed the final manuscript.
Funding
Funding for this research project was provided by the Gilead Foundation.
Data Availability
Data supporting the findings of this study are not publicly available to protect the privacy and confidentiality of participants. Please contact the corresponding author for additional information.
Declarations
Conflict of Interest
Cherokee Nation Health Services has received research grants from the Gilead Foundation for the CNHS HCV Elimination Program, for which JM and WE were investigators.
Footnotes
Publisher’s Note
Springer Nature remains neutral with regard to jurisdictional claims in published maps and institutional affiliations.
References
- 1.Centers for Disease Control and Prevention (2022). Hepatitis C. Retrieved January 11, 2023, from https://www.cdc.gov/hepatitis/statistics/2020surveillance/hepatitis-c.htm
- 2.Centers for Disease Control and Prevention (2022). 2020 Viral Hepatitis Surveillance Report, Table 3.2 – Acute – Cases & Rates by Demographics. Retrieved January 11, 2023, from https://www.cdc.gov/hepatitis/statistics/2020surveillance/hepatitis-c/table-3.2.htm
- 3.Centers for Disease Control and Prevention (2022). 2020 Viral Hepatitis Surveillance Report, Table 3.8 – Death Rates by Demographics. Retrieved January 11, 2023, from https://www.cdc.gov/hepatitis/statistics/2020surveillance/hepatitis-c/table-3.8.htm
- 4.Saine ME, Szymczak JE, Moore TM, Bamford LP, Barg FK, Schnittker J, Holmes JH, Mitra N, Lo Re III. Determinants of stigma among patients with hepatitis C virus infection. Journal of Viral Hepatitis. 2020;27(11):1179–1189. doi: 10.1111/jvh.13343. [DOI] [PMC free article] [PubMed] [Google Scholar]
- 5.Harris M, Guy D, Picchio CA, White TM, Rhodes T, Lazarus JV. Conceptualising hepatitis C stigma: A thematic synthesis of qualitative research. International Journal of Drug Policy. 2021;96:103320. doi: 10.1016/j.drugpo.2021.103320. [DOI] [PubMed] [Google Scholar]
- 6.Centers for Disease Control and Prevention - Public Health Professionals Gateway (2022). Tribal Health - Chronic Diseases. Center for State, Tribal, Local, and Territorial Support. Retrieved December 15, 2022, from https://www.cdc.gov/tribal/data-resources/information/chronic-diseases.html
- 7.Centers for Disease Control and Prevention - National Center for HIV/AIDS, Hepatitis, V., STD, and, & Prevention, T. B. (2020). Health Disparities in HIV/AIDS, Viral Hepatitis, STDs, and TB - American Indians and Alaska Natives. Retrieved December 15, 2022, from https://www.cdc.gov/nchhstp/healthdisparities/americanindians.html
- 8.U.S. Department of Health and Human Services Office of Minority Health (2021). Diabetes and American Indians/Alaska Natives. Retrieved April 8, 2021, from: https://www.minorityhealth.hhs.gov/omh/browse.aspx?lvl=4&lvlID=33
- 9.Kim G, Ford KL, Chiriboga DA, Sorkin DH. Racial and ethnic disparities in healthcare use, delayed care, and management of diabetes mellitus in older adults in California. Journal of the American Geriatrics Society. 2012;60(12):2319–2325. doi: 10.1111/jgs.12003. [DOI] [PubMed] [Google Scholar]
- 10.Mera J, Williams MB, Essex W, McGrew KM, Boeckman L, Gahn D, Miller A, Durham D, Fox J, David C, Ritter T, Jones S, Bouse S, Galvani A, Ward JW, Drevets DA, Carabin H. Evaluation of the Cherokee nation hepatitis C virus elimination program in the first 22 months of implementation. JAMA network open. 2020;3(12):e2030427–e2030427. doi: 10.1001/jamanetworkopen.2020.30427. [DOI] [PMC free article] [PubMed] [Google Scholar]
- 11.Lu M, Moritz S, Lorenzetti D, Sykes L, Straus S, Quan H. A systematic review of interventions to increase breast and cervical cancer screening uptake among asian women. BMC public health. 2012;12(1):1–16. doi: 10.1186/1471-2458-12-413. [DOI] [PMC free article] [PubMed] [Google Scholar]
- 12.Jenkins F, Mueller M, Gibson LM, Gregoski MJ, Jenkins C, Magwood GS. Screening for physical activity and cardiometabolic risk factors among rural african-american women. Journal of National Black Nurses’ Association: JNBNA. 2017;28(2):1–6. [PubMed] [Google Scholar]
- 13.Marshall SE, Cheng B, Northridge ME, Kunzel C, Huang C, Lamster IB. Integrating oral and general health screening at senior centers for minority elders. American journal of public health. 2013;103(6):1022–1025. doi: 10.2105/AJPH.2013.301259. [DOI] [PMC free article] [PubMed] [Google Scholar]
- 14.McElfish PA, Rowland B, Long CR, Hudson J, Piel M, Buron B, Riklon S, Bing WI, Warmack TS. Diabetes and hypertension in marshallese adults: Results from faith-based health screenings. Journal of racial and ethnic health disparities. 2017;4(6):1042–1050. doi: 10.1007/s40615-016-0308-y. [DOI] [PMC free article] [PubMed] [Google Scholar]
- 15.Morris MD, Brown B, Allen SA. Universal opt-out screening for hepatitis C virus (HCV) within correctional facilities is an effective intervention to improve public health. International journal of prisoner health. 2017;13(3/4):192–199. doi: 10.1108/IJPH-07-2016-0028. [DOI] [PMC free article] [PubMed] [Google Scholar]
- 16.Cocoros N, Nettle E, Church D, Bourassa L, Sherwin V, Cranston K, Carr R, Fukuda HD, DeMaria A., Jr Screening for Hepatitis C as a Prevention Enhancement (SHAPE) for HIV: An integration pilot initiative in a Massachusetts County correctional facility. Public Health Reports. 2014;129(1_suppl1):5–11. doi: 10.1177/00333549141291S102. [DOI] [PMC free article] [PubMed] [Google Scholar]
- 17.Seña AC, Willis SJ, Hilton A, Anderson A, Wohl DA, Hurt CB, Muir AJ. Efforts at the frontlines: Implementing a hepatitis C testing and linkage-to-care program at the local public health level. Public Health Reports. 2016;131(2_suppl):57–64. doi: 10.1177/00333549161310S210. [DOI] [PMC free article] [PubMed] [Google Scholar]
- 18.Fuster D, Gelberg L. Community screening, identification, and referral to primary care, for hepatitis C, B, and HIV among homeless persons in Los Angeles. Journal of Community Health. 2019;44(6):1044–1054. doi: 10.1007/s10900-019-00679-w. [DOI] [PubMed] [Google Scholar]
- 19.Morano JP, Zelenev A, Lombard A, Marcus R, Gibson BA, Altice FL. Strategies for hepatitis C testing and linkage to care for vulnerable populations: Point-of-care and standard HCV testing in a mobile medical clinic. Journal of community health. 2014;39(5):922–934. doi: 10.1007/s10900-014-9932-9. [DOI] [PMC free article] [PubMed] [Google Scholar]
- 20.Trooskin SB, Poceta J, Towey CM, Yolken A, Rose JS, Luqman NL, Preston TW, Chan PA, Beckwith C, Feller SC, Lee H, Nunn AS. Results from a geographically focused, community-based HCV screening, linkage-to-care and patient navigation program. Journal of general internal medicine. 2015;30(7):950–957. doi: 10.1007/s11606-015-3209-6. [DOI] [PMC free article] [PubMed] [Google Scholar]
- 21.Abe CM, Aguwa M, Zhao M, Sullivan J, Porsa E, Nijhawan AE. Hepatitis C virus infection in the Dallas County Jail: Implications for screening, prevention, and linkage to care. Public Health Reports. 2019;134(6):626–633. doi: 10.1177/0033354919874081. [DOI] [PMC free article] [PubMed] [Google Scholar]
- 22.Young SD, Monin B, Owens D. Opt-out testing for stigmatized diseases: A social psychological approach to understanding the potential effect of recommendations for routine HIV testing. Health Psychology. 2009;28(6):675. doi: 10.1037/a0016395. [DOI] [PMC free article] [PubMed] [Google Scholar]
- 23.Ford MM, Jordan AE, Johnson N, Rude E, Laraque F, Varma JK, Hagan H. Check Hep C: A community-based approach to hepatitis C diagnosis and linkage to care in high-risk populations. Journal of Public Health Management and Practice. 2018;24(1):41–48. doi: 10.1097/PHH.0000000000000519. [DOI] [PubMed] [Google Scholar]
- 24.Falade-Nwulia, O., Irvin, R., McAdams-Mahmoud, A., Mehta, S. H., Niculescu, A., Lasola, J., Baker, D., Eppel, A., Chaulk, P., Page, K. R., Sulkowski, M., & Thomas, D. (2016). January). Senior center-based hepatitis C screening in Baltimore. Open forum infectious diseases (3 vol.). Oxford University Press. 110.1093/ofid/ofv217 [DOI] [PMC free article] [PubMed]
- 25.Dong BJ, Lopez M, Cocohoba J. Pharmacists performing hepatitis C antibody point-of-care screening in a community pharmacy: A pilot project. Journal of the American Pharmacists Association. 2017;57(4):510–515. doi: 10.1016/j.japh.2017.04.463. [DOI] [PubMed] [Google Scholar]
- 26.Smartlowit-Briggs L, Pearson C, Whitefoot P, Altamirano BN, Womack M, Bastin M, Dombrowski JC. Community-based assessment to inform a chlamydia screening program for women in a rural american indian community. Sexually transmitted diseases. 2016;43(6):390. doi: 10.1097/OLQ.0000000000000456. [DOI] [PMC free article] [PubMed] [Google Scholar]
- 27.Nsiah-Kumi PA, Lasley S, Whiting M, Brushbreaker C, Erickson JM, Qiu F, Yu F, Larsen JL. Diabetes, pre-diabetes and insulin resistance screening in native american children and youth. International journal of obesity. 2013;37(4):540–545. doi: 10.1038/ijo.2012.199. [DOI] [PubMed] [Google Scholar]
- 28.Vassalotti, J. A., Li, S., McCullough, P. A., & Bakris, G. L. (2010, January). Kidney early evaluation program: a community-based screening approach to address disparities in chronic kidney disease. In Seminars in nephrology (Vol. 30, No. 1, pp. 66–73). WB Saunders. 10.1016/j.semnephrol.2009.10.004 [DOI] [PubMed]
- 29.Larsson LS, Kuster E. Nurse’s desk: Food Bank–Based Outreach and screening to decrease Unmet Referral needs. Family and Community Health. 2013;36(4):285–298. doi: 10.1097/FCH.0b013e31829d2aa2. [DOI] [PubMed] [Google Scholar]
- 30.Bomberg EM, Rosenmoss S, Smith M, Waxman E, Seligman HK. Diabetes-related Health Care utilization and Dietary Intake among Food Pantry clients. Health equity. 2019;3(1):644–651. doi: 10.1089/heq.2019.0102. [DOI] [PMC free article] [PubMed] [Google Scholar]
- 31.National Academies of Sciences, Engineering, and, Health, M., & Medicine Division; Board on Health Care Services; Committee on Health Care Utilization and Adults with Disabilities. (2018). and. Health-Care Utilization as a Proxy in Disability Determination. Washington (DC): National Academies Press (US); Mar 1. 2, Factors That Affect Health-Care Utilization. Retrieved January 11, 2023, from https://www.ncbi.nlm.nih.gov/books/NBK500097/ [PubMed]
- 32.Cherokee Nation (2022). About the Nation. Retrieved January 11, 2023, from https://www.cherokee.org/About-The-Nation
- 33.Cherokee Nation Human Services (2020). Food Distribution Program. Retrieved January 11, 2023, from https://www.cherokee.org/all-services/human-services/family-assistance/food-distribution-program/#:~:text=The%20Cherokee%20Nation%20Food%20Distribution%20Program%20is%20funded,Services%20are%20provided%20through%20seven%20Food%20Distribution%20Stores.
- 34.United States Census Bureau (2022). QuickFacts - Tahlequah city, Oklahoma. Retrieved January 7, 2023, from https://www.census.gov/quickfacts/fact/table/tahlequahcityoklahoma/PST045221
- 35.United States Census Bureau (2022). QuickFacts - Sallisaw city, Oklahoma. Retrieved January 7, 2023, from https://www.census.gov/quickfacts/fact/table/sallisawcityoklahoma/PST045222
- 36.Pearson N, Naylor PJ, Ashe MC, Fernandez M, Yoong SL, Wolfenden L. Guidance for conducting feasibility and pilot studies for implementation trials. Pilot and feasibility studies. 2020;6(1):1–12. doi: 10.1186/s40814-020-00634-w. [DOI] [PMC free article] [PubMed] [Google Scholar]
- 37.McKay H, Naylor PJ, Lau E, Gray SM, Wolfenden L, Milat A, Bauman A, Race D, Nettlefold L, Sims-Gould J. Implementation and scale-up of physical activity and behavioural nutrition interventions: An evaluation roadmap. International Journal of Behavioral Nutrition and Physical Activity. 2019;16(1):1–12. doi: 10.1186/s12966-019-0868-4. [DOI] [PMC free article] [PubMed] [Google Scholar]
- 38.IBM SPSS Statistics for Windows, version 19 (IBM Corp., Armonk, N.Y., USA).
- 39.Norton, B. L., Voils, C. I., Timberlake, S. H., Hecker, E. J., Goswami, N. D., Huffman,K. M., … Stout, J. E. (2014). Community-based HCV screening: knowledge and attitudes in a high risk urban population. BMC infectious diseases, 14(1), 1–9. https://doi.org/10.1186/1471-2334-14-74. [DOI] [PMC free article] [PubMed]
- 40.Kempf MC, Ott C, Wise JM, Footman AP, Araya BY, Hardy CM, Walker C, Latham C, Stockett R, Daniels G, Alexander M, Lanzi RG. Universal screening for HIV and hepatitis C infection: A community-based pilot project. American journal of preventive medicine. 2018;55(5):S112–S121. doi: 10.1016/j.amepre.2018.05.015. [DOI] [PMC free article] [PubMed] [Google Scholar]
- 41.Hagedorn H, Dieperink E, Dingmann D, Durfee J, Ho SB, Isenhart C, Rettmann N, Willenbring M. Integrating hepatitis prevention services into a substance use disorder clinic. Journal of substance abuse treatment. 2007;32(4):391–398. doi: 10.1016/j.jsat.2006.10.004. [DOI] [PubMed] [Google Scholar]
- 42.Nguyen K, Van Nguyen T, Shen D, Xia V, Tran D, Banh K, Ruan V, Hu KQ. Prevalence and presentation of hepatitis B and C virus (HBV and HCV) infection in Vietnamese Americans via serial community serologic testing. Journal of immigrant and minority health. 2015;17(1):13–20. doi: 10.1007/s10903-013-9975-5. [DOI] [PubMed] [Google Scholar]
Associated Data
This section collects any data citations, data availability statements, or supplementary materials included in this article.
Data Availability Statement
Data supporting the findings of this study are not publicly available to protect the privacy and confidentiality of participants. Please contact the corresponding author for additional information.