

Abstract
Magnesium ferrite (MgFe2O4) and polyethylene glycol (PEG) are materials known for their versatility in various applications. This study presents a comprehensive comparative analysis of the electrical conductivity and dielectric relaxation of nanostructured MgFe2O4 and its composites with PEG. Through experimentation, it was observed that incorporating PEG into MgFe2O4 did not lead to a high relative observed decrease or increase in electrical conductivity at room temperature. The study revealed that the composites maintained stable electrical behavior at room temperature, with a dielectric constant value of around 9 and a loss tangent value of around 0.1 at high frequency (around 7 MHz). The electron-hole hopping mechanism was identified as the underlying cause for the strong dielectric dispersion with frequency. The low dielectric loss and conductivity of the MgFe2O4 and PEG/ferrite composites make them promising candidates for high-frequency switching applications and microelectronic devices, particularly in scenarios where negligible eddy currents are essential. Additionally, complex impedance data analysis demonstrated that the capacitive and resistive properties of the composites are primarily attributed to grain boundary processes. This study provides a comprehensive analysis of the electrical and dielectric properties of MgFe2O4 and PEG composites and highlights their potential for many applications in materials science, particularly in electrical and electronic devices.
Keywords: Ferrite nanoparticles, Polyethylene glycol, Nanocomposites, Elastic properties, Electrical properties
1. Introduction
Synthesis and investigation of nanocrystalline soft magnetic materials such as ferrites are important research fields. Varying the microstructure of these materials controls their electric and magnetic performance; this is achieved by adjusting the preparation conditions such as sintering temperature and time and sintering atmosphere [1], which greatly affect the cation distribution among different sites in ferrite nanocrystals. Moreover, inserting different cations into the composition of ferrite nanocrystals plays an essential role in controlling and modifying the structural and physical properties of the material, too [2]. In addition, these materials' resulting properties and potential applications are highly influenced by their morphology, which can be in the form of particles, rods, discs, wires, thin films, or bulk polycrystalline alloys [3]. Several potential uses are based on the physical features of these substances, including data storage, magnetic recording medium, stable pigmenting for porcelain and ceramics, catalytic effects, sensing goods, magneto-optical systems, and many others [4,5], resonance imaging, drug-delivery, guiding radionuclides to specific tissues, light-driven water-splitting and ferrofluids [6]. Thermal energy losses of ferrites can also be used in hyperthermia, that is, heating some tissues or organs as a radical treatment of cancer cells [7]. Mg Ferrite is one of the most important ferrite materials among ferrite nanoparticles. It is soft magnetic material and n-type semiconductor used in sensors, catalysis and adsorption applications [8].
It is worth mentioning that integrating nanoscale magnetic particles with a polymer is of interest to many researchers due to its significance in engineering, electromagnetic devices applications [9] and medical technological applications [10,11]. New characteristics can be achieved by combining the features of the inorganic magnetic fillers (high mechanical strength, thermal and magnetic stability) and organic polymer matrix (flexibility, dielectric, and processibility) [12]. The resulting composites may comprise magnetic nanoparticles randomly dispersed in the polymer matrix. On the other hand, polymers are easily manufactured into large-area sheets, and several polymers have relatively high breakdown field strengths for power energy storage [13]. These composites may have many applications, such as magnetic field-assisted drug delivery, suppressors of electromagnetic interference (EMI) [14], electrical and chemical energy storage devices, sensors, catalysts, and phase shifters too [[15], [16], [17]].
In addition, the encapsulation of magnetic nanoparticles with biocompatible, biodegradable, non-toxic polymers, such as poly lactic acid, polyglycolic acid, chitosan, gelatin, polyvinyl alcohol (PVA), etc., have a great interest. This is performed to obtain magnetic colloidal ferrofluids by preventing agglomerations in the biological medium in hyperthermia and drug delivery applications. Polyethylene glycol (PEG) is one of these polymers. It has several desirable characteristics, including being hydrophilic, non-immunogenic, resistant to protein, physiologically inactive, non-antigenic, and having a chain structure that is both consistent and organized [12].
Kumari et al. [18] studied calcium-substituted Mg–Zn ferrite's magnetic and dielectric properties prepared by the citrate precursor wet chemical method. These samples are classified as soft magnetic materials from the magnetic hysteresis loop of these samples and the obtained coercivity and saturation magnetization values. In addition, these samples have a low dielectric loss, making them suitable for the core of transformers and high-frequency applications. Kumari et al. [19] examined the structural, morphological, optical, photocatalytic, and antimicrobial properties of nano Ca–Mg–Zn ferrites. These ferrite nanoparticles may have promising antimicrobial potential upon Candida albicans fungi. In addition, the composition Mg0.4Zn0.1Ca0.5Fe2O4 has the best antimicrobial activity (96.1%) for the inhibition of Candida albicans fungi and superior photocatalytic response (99.5%) for the degradation of rhodamine B dye.
Investigation of the structural information of PEG from dielectric relaxation data is very important for pharmaceutical chemists to understand polymer behavior to select suitable solvents/binders in cosmetic preparations and solvents for biological molecules [20]. The study of dielectric relaxation provides the researchers with knowledge about the dynamics of the polymer chain, such as flexibility of chains, internal group rotation, mobility of the polymer segments and conformational transition resulting from chain motion in the polymer's backbone [20]. Aisida et al. [21] studied the preparation and physical properties of PVA, Polyvinylpyrrolidone (PVP) and PEG composites with ZnFe2O4 nanoparticles. They found that the properties of these materials could be controlled and improved for applications in the medical fields, such as hyperthermia and drug delivery. Ahmed et al. [22] prepared (Ni0.5Zn0.5Fe2O4+BaTiO3)/PEG and studied these composites' characteristics and dielectric properties. Their research determined that these composite materials display promising characteristics suitable for various technological and electronic applications, including but not limited to magnetic probes, transducers, and thermistors. Topkaya et al. [23] synthesized PEG/CoFe2O4 nanocomposites and studied their structural and magnetic properties. They found that these composites are promising candidates for high-density magnetic recording media.
Therefore we found that these materials have technological and biomedical applications in different fields. According to these various applications of Mg ferrite, polyethylene glycol and Mg ferrite/PEG composite, the authors are interested in examining the structural, electrical and dielectric relaxation properties of PEG/MgFe2O4 composites to enhance the properties of both PEG and MgFe2O4 nanoparticles to be suitable for various medical and technological applications.
2. Experimental methodology
2.1. Synthesis of MgFe2O4 (spinel ferrite) specimen
A sample of MgFe2O4 nano ferrite was synthesized using the citrate precursor technique. This technique is frequently employed in producing magnetic oxide nanoparticles because it is quick and simple to utilize. To prepare the desired ferrite sample, suitable amounts of metal nitrates (Mg(NO3)3·9H2O (99% purity, Oxford Lab.) and Fe(NO3)3·9H2O (97% purity, Fisher Scientific)) were used. Firstly, each metal nitrate was dissolved individually in distilled water to make clear-colored solutions. Then, an hour was spent at room temperature mixing and stirring the solutions to ensure they were completely uniform. Following that, the solution was supplemented with citric acid (C6H8O7) gradually, maintaining a constant molar ratio of metal nitrates to citric acid of 1:1. Once the pH level had exceeded 8, an aqueous solution of ammonium hydroxide was added gradually, drop by drop. After 30 min of stirring at room temperature, the resultant solution was heated to transform into a thick gel. As the gel was heated, it caught fire and burnt, creating nanoparticles of ferrite ash in the shape of trees. An agate mortar was used to crush the ferrite ash.
2.2. Preparation of nanocomposite samples
In this study, we prepared nanocomposite samples of Polyethylene Glycol (PEG-4000) and ferrite (MgFe2O4) nanoparticles. The synthesis process involved dissolving PEG in acetone and dispersing ferrite nanoparticles in the solution at a temperature of 333 K. The mass percentage (wt.%) of PEG to ferrite was varied to obtain composite samples with PEG/MgFe2O4 ratios of 20%, 50%, and 80%. The dispersion was then stirred for several hours to ensure the uniform distribution of the nanoparticles throughout the PEG matrix. After evaporation of the acetone, the resulting remnant was ground using an agate mortar to obtain a very fine nanocomposite powder.
3. Characterization
The present study employed various techniques to characterize the prepared ferrite samples and their composites. These techniques included XRD (X-ray diffraction, model GNR, APD2000 PRO, Cu-Kα radiation (wavelength (λ) = 1.5406 Å) with step and rate scan 0.03°, 2°/min respectively, 10° ≤ 2 Theta ≤ 90°), FTIR (Fourier-transform infrared spectroscopy, model Tensor 27), SEM (scanning electron microscopy, model JEOL-JMS-6510LV), and TEM (transmission electron microscopy, model JEOL-100SX). The XRD was used to determine the crystallographic structure of the prepared ferrite sample. FTIR was used to study the interaction of infrared radiation with the prepared samples and to identify the functional groups or chemical substances in the samples. SEM and TEM were used to examine the morphology of selected samples. The elastic properties of the prepared samples, such as force constants (FA, FB), stiffness constants (C11, C12), Young modulus (Y), bulk modulus (B), rigidity modulus (G), longitudinal wave velocity (VL), and shear elastic wave velocity (VS), were calculated using the numerical data obtained from the XRD and FTIR. Finally, the prepared samples' electrical properties were characterized using DC and AC electrical measurements. The fine MgFe2O4 particles and their composites were subjected to compression, forming pellets with predetermined dimensions. They were then coated with a silver paste to achieve optimal electrical conductivity at the electrode interface. Electrical properties were evaluated using a two-probe methodology with a programmable electrometer and an LCR meter (LCR METER IM3536 - Hioki) over a frequency range spanning 400 Hz to 8 MHz. The DC and AC electrical properties of the ferrite samples were analyzed as functions of temperature, encompassing a range from 295 K to 423 K. At the same time, the PEG/MgFe2O4 composites were measured at ambient temperature.
4. Results and discussion
4.1. XRD discussion
The XRD patterns obtained from the Rietveld method were subjected to refinement through the utilization of the FULLPROF software program. Fig. 1 displays the results of this process where, Yobs and Ycalc are the measured (observed) and calculated X-ray patterns, respectively, and Yobs-Ycalc is the difference between them. The Yobs-Ycalc curve's smoothness confirms the refinements' stability and fitness quality. The refined XRD pattern provided clear evidence of single-phase ferrite formation, which had an Fd-3m space group with cubic spinel symmetry [[24], [25], [26]] in agreement with the JCPDS Card No 36-0398. The value of χ2 (a measure of the goodness of fit) was minimized by refining the data to reach 1.31 to obtain the best refinement.
Fig. 1.

XRD pattern of MgFe2O4 with refined data obtained by the Rietveld method.
The crystallite size (R) and lattice strain of MgFe2O4 were estimated using the Williamson-Hall equation ( θ) [27,28] by plotting the relation between θ and to get a straight line. Where is the full width at half maximum (FWHM) of the reflection planes and the background of the XRD pattern was corrected using a Thomson-Cox-Hastings pseudo-Voigt axial divergence asymmetry function. From the obtained straight line, we can determine the crystallite size R and the strain from the intersection with the Y-axis and the slope of the line, respectively. Upon analysis, the crystallite size of MgFe2O4 fell within the range of 35.55 nm. Generally, lattice strain always occurs in crystals because of a slight displacement of atoms relative to their lattice positions. This displacement is due to crystalline defects such as dislocations. The strain in the MgFe2O4 sample has a positive value (as shown in Table 1); hence, it is considered a tensile strain. In addition, the dislocation density () can be calculated using: ( = 1/R2) and may arise in the material during preparation.
Table 1.
The lattice constant a (Å), crystallite size R (nm), strain, dislocation density (nm−2), x-ray density DXRD (g/cm3), measured density (g/cm3), porosity P and bond lengths (Å) between cations and anions in tetrahedral (A) and octahedral (B) sites of MgFe2O4.
| a (Å) | R (nm) | (nm-2) | DXRD (g/cm3) | (g/cm3) | |
|---|---|---|---|---|---|
|
8.3826 |
35.55 |
1.3 × 10⁻³ |
7.9 × 10⁻⁴ |
4.51 |
2.14 |
| P (%) | LA-A (Å) | LA-B (Å) | LB-B (Å) | LA-O (Å) | LB-O (Å) |
| 53 | 3.6298 | 3.4752 | 2.9637 | 1.6472 | 3.7975 |
The porosity (P) of MgFe2O4 was calculated using the relation; [29], where Dm and DXRD are the experimentally measured and theoretical (X-ray) densities, respectively. It is noticed that the porosity of as-synthesized MgFe2O4 is relatively high, as seen in Table 1 because nanoparticles are not sintered and consequently not compacted powder and have large pore or void size.
Furthermore, the bond lengths between cations and anions in tetrahedral and octahedral sites were calculated from the refined data using the BondStr program. The bond lengths are listed in Table 1 and were found to be analogous to the data reported in the literature [30,31]. These results provide insight into the bonding and crystal structure of the MgFe2O4 sample, as will be discussed later, which are important for understanding their properties and behavior in various applications.
Moreover, Rietveld refinement analysis suggests that the chemical formula of MgFe2O4 is [Mg0.6016Fe0.6154][Mg0.3984Fe1.3864]O4, which means that Mg2+ ions are distributed in both the tetrahedral and octahedral positions performing a mixed spinel structure.
4.2. FTIR discussion
Fig. 2 displays the FTIR spectra of pure polyethylene glycol (PEG), as well as the spectra of PEG/MgFe2O4 nanocomposites. The band representing C–C bending may be seen at approximately 1112 cm−1 [21,32]. In contrast, bands at around 962 cm−1 correspond to C–O group vibration modes in PEG [33]. Those that occur at a frequency of around 1242 cm−1 correspond to the plane deformation of C–H group bending vibrations. The bands that can be found at about 1346 cm−1 correspond to the bending modes of C–O–H, while the bands that can be found at approximately 1469 cm−1 relate to the stretching vibration of C–O in PEG [21,32]. The FTIR spectra also display the two primary bands characteristic of spinel ferrites. These bands, v2 and v1, may be seen in around 440 cm−1 and 580 cm−1, respectively. It is speculated that stretching vibrations of tetrahedral (A–site) metal-oxygen bonding is responsible for the appearance of the v1, which takes place at a higher wavenumber than v2. The occurrence of metal-oxygen bonding in the octahedral B sites is the driving force behind the appearance of a lower-frequency anti-peak, referred to as v2 [34,35]. It has been determined that the stretching modes and the H–O–H bending vibration of the hydroxyl groups are responsible for the triple band that is observed in the composite samples between about 1200 cm−1 and 1400 cm−1 [34]. The presence of water, which is associated with the vibration of the H–O–H group, can be linked to the wide bands that were found at frequencies greater than 1641 cm−1. The primary bands of ferrites, known as v1 and v2, undergo a systematic shifting when a polymer is introduced alongside the ferrites during the formation of composites [36,37]. The observed shift can be elucidated by the development of hydrogen bonding between certain oxygen atoms, which are only partially involved in covalent bonding in the ferrites, and the OH group present in the polymer [34]. The OH group in the polymer participates in bonding with certain oxygen atoms in the ferrites, despite the predominantly ionic nature of the ferrite bonding. This is due to the partially covalent nature of the metal-oxygen bonding in the ferrites. The resulting hydrogen bonding plays a significant role in the characteristics and structure of the PEG/MgFe2O4 nanocomposites, as demonstrated by the systematic shift in the primary bands, which suggests the formation of such hydrogen bonding.
Fig. 2.

FTIR spectra of pure MgFe2O4, PEG and PEG/MgFe2O4 composites.
4.3. SEM and energy dispersive X-ray (EDX) spectroscopy discussion
The surface morphology and shape of MgFe2O4 and 50 wt% PEG/50 wt% MgFe2O4 composite has been examined by SEM. The micrographs presented in Fig. 3(a and b) demonstrate that the particles exhibit irregular geometries. The average particle sizes measured for MgFe2O4, and its composite are 81 nm and 87 nm, respectively. These values are consistent with the use of ex-situ processes in composite preparation. It is well known that nanoparticles can be prone to significant agglomeration during such processes due to the difficulty in breaking apart the nanoparticle agglomerates, even with the application of high external shear forces [38]. Therefore, the particle size on the composite sample is greater than that of MgFe2O4.
Fig. 3.

SEM images of MgFe2O4 (a) and 50 wt% PEG/50 wt% MgFe2O4 (b).
The EDX spectroscopy spectrum of MgFe2O4 nanoparticles confirms the presence of Mg, O and Fe elemental peaks with some traces of C, Cu, Zn and Tb's impurity phases as illustrated in Fig. 4. The peaks at 6.3 KeV and 1.27 KeV refer to the highest peaks of iron and magnesium, respectively. From the elemental composition of MgFe2O4, it is noticed that the observed and calculated values of the atomic% and weight% are close together with some variation in the values because of the presence of the impurity elements (C, Cu, Zn and Tb), as illustrated in the inset table in Fig. 4.
Fig. 4.

The EDX analysis of MgFe2O4.
This result confirms that the atomic and weight ratios of the main elements (Mg, Fe, and O) obtained from the synthesis of nanoparticles are consistent with the anticipated stoichiometric proportions of these elements.
4.4. TEM discussion
The TEM images in Fig. 5(a, b) illustrate irregular agglomerations of particles in MgFe2O4, suggesting significant variation in particle size distribution. This variability is likely a result of the ignition stage of the citrate precursor method, which can give rise to the formation of non-uniform particles. The average particle size obtained from X-ray diffraction (RXRD) is roughly 35.55 nm. The calculated average particle size from TEM images (RTEM) is approximately 47.93 nm. The observed differences in the average particle sizes measured by XRD and TEM are because XRD can only detect the crystalline portion of the particle. At the same time, TEM can record the dimensions of the entire particle, encompassing both the grain and the grain boundary. Hence, using multiple characterization techniques is crucial to comprehensively understand the particle size distribution. Differences or discrepancies in the results obtained from various analytical techniques can provide valuable insights into the structure and properties of the investigated material. These differences may arise due to different sensitivities, measurement conditions, or limitations of each technique. By examining and reconciling such discrepancies, researchers can gain a more comprehensive understanding of the material's behavior and properties, leading to more accurate predictions and improved design of future applications [37].
Fig. 5.

(a, b). TEM images of MgFe2O4 nanoparticles.
4.5. Elastic properties discussion
All prepared samples' elastic properties were investigated based on their XRD and FTIR results. The FA, FB, C11, C12, B, Y, G, VL, and VS have been calculated by using the following formulas (Equations (1), (2), (3), (4), (5), (6)) [39,40]:
| (1) |
| (2) |
| (3) |
| (4) |
| (5) |
| (6) |
where (μ = 2.061 × 10⁻²³ g) is the reduced mass of O2− and Fe3+ions and (c = 3 × 1010 cm/s) is the velocity of the electromagnetic wave, Dx is the X-ray density [41], is the Poisson’s ratio, and a is the lattice constant.
From Table 2, the observed decrease in force constants, stiffness constants and elastic moduli by increasing PEG content in the composites is due to the interaction between ferrite nanoparticles and the PEG matrix [42]. The interaction between nanoparticles and the polymer matrix occurs due to the dispersion of nanoparticles, which have a large specific surface area, as fillers within the polymer matrix. This causes the formation of an interfacial polymer layer that is attached to the nanoparticle surfaces [38]. This causes a reduction in mechanical strength and enhances elasticity. As a result of this interaction, there is also an expansion in the bond length at the tetrahedral and octahedral sites of the ferrites. This expansion accounts for the observed decrease in the values of the vibrational frequencies ν1 and ν2 [41]. This has greatly affected the composites' electrical properties, as will be discussed later.
Table 2.
FA, FB, C11, C12, B, Y, G, VL, and VS of MgFe2O4 and PEG/MgFe2O4 composites.
| PEG wt.% | FA (N/m) | FB (N/m) | C11 (GPa) | C12 (GPa) | B (GPa) | Y (GPa) | G (GPa) | V.L. (103 m/s) | VS (103 m/s) |
|---|---|---|---|---|---|---|---|---|---|
| 0 | 243.30 | 137.77 | 227.37 | 38.53 | 101.47 | 216.20 | 94.42 | 7491.77 | 4325.37 |
| 20 | 230.45 | 136.52 | 218.96 | 37.10 | 97.72 | 208.21 | 90.93 | 7351.93 | 4244.64 |
| 50 | 228.87 | 118.81 | 207.45 | 35.15 | 92.58 | 197.26 | 86.15 | 7156.03 | 4131.54 |
| 80 | 227.29 | 118.87 | 206.54 | 34.10 | 92.18 | 196.40 | 85.77 | 7140.37 | 4122.49 |
It is worth noting that the Debye temperature, θD, represents the highest normal mode of vibration in a crystal and can be calculated using the formula θD = hcvAV/2πk [43]. In this formula, c is the velocity of light, k is Boltzmann's constant, h is Planck's constant, and νAV represents the average value of the wavenumbers ( and ). The Debye temperature θD is an important parameter that correlates the elastic properties of materials with their thermodynamic properties, such as lattice vibrations and thermal expansion. It provides a measure of the maximum vibrational frequency of the lattice, which in turn is related to the material's stiffness. A higher θD value indicates a more rigid and less deformable material. In comparison, a lower θD value indicates a softer, more deformable material [43]. θD is an indicator of the stability of the crystal lattice. This means that by keeping the temperature of the material below θD, the atomic vibrational motion is limited, and the crystal is still stable. Therefore, materials with higher Debye temperatures are more stable and rigid. So, weakening the composite samples' mechanical strength reduces their Debye temperature, as seen in Fig. 6, and hence decreases the stability.
Fig. 6.

Debye temperature with different PEG wt.% for the prepared PEG/MgFe2O4 composite samples.
4.6. DC conductivity discussion
The variation of DC conductivity (DC) of MgFe2O4 exhibits an Arrhenius relationship with temperature. As demonstrated in Fig. 7, the increase in DC with temperature indicates the semiconducting nature of the sample. This phenomenon may be attributed to charge carriers' thermally enhanced drift mobility (d). It is well known that electrical conduction in solid crystals depends mainly on the cation distribution at different sites. Therefore, the conduction mechanism can be interpreted according to the above-suggested cation distribution. That involves electron hopping between Fe2+ and Fe3+ ions in the octahedral sites and hole hopping between Mg3+↔Mg2+ ions, as depicted in Fig. 8. The d can be calculated using the following relation (Equation (7)) [44]:
| (7) |
where n, e, N, M, ρ, PFe, and M are the concentration of charge carriers, the electron charge, Avogadro’s number, the measured density, the resistivity, the number of iron atoms in the chemical formula, and the molecular weight respectively. These charge carriers can hop between localized sites if a continuous path (connected network) is present, allowing DC current flow [45]. Hopping of charge carriers can occur at the octahedral sites due to the smaller hopping length LB–B distances relative to the LA–A and LA–B sites, as observed in Table 1.
Fig. 7.

σDC as a function of temperature for the MgFe2O4 sample.
Fig. 8.

The variation of charge carrier mobility with temperature for the MgFe2O4 sample.
Hopping of those charge carriers can occur at the octahedral sites because distances are smaller than between and sites [46].
4.7. Dielectric permittivity discussion
The study of dielectric properties in this research involved the computation of several key parameters, including the dielectric constant (′) and dielectric loss (′′), AC electrical conductivity (AC), loss factor (tanδ), and the real (Z′) and imaginary (Z′′) components of the complex impedance. These parameters were examined as a function of both frequency and temperature to comprehensively understand the material's dielectric behavior.
Fig. 9 shows the relation between the ′ and the applied frequency ranges from 400 Hz to 8 MHz for nano-ferrite samples of different cations at different temperatures (from 295K to 423K). The polarization process in the material is driven by electron hopping between Fe2+ and Fe3+ ions, as well as hole hopping between Mg3+↔Mg2+ ions according to the cation distribution. Both of these mechanisms contribute to the overall polarization of the material, and understanding their behavior is critical to understanding the material's electrical properties. As usual, ′ decreases rapidly by increasing frequency at low frequencies but slowly until the frequency reaches about 4 MHz. This dispersion occurs because charge carrier hopping takes place from grains to grain boundaries and accumulates there due to the high resistivity of the grain boundaries, according to Maxwell–Wagner-type interfacial polarization [47,48]. At higher frequencies, the polarization process becomes increasingly difficult because charge carriers cannot follow the rapid variation of the applied electric field. This occurs because the space charge needs sufficient time to align itself in the direction of the electric field. As a result, the polarization process becomes less effective at higher frequencies, leading to a reduction in the dielectric constant and an increase in the dielectric loss [49].
Fig. 9.

The ε′ of MgFe2O4 as a function of frequency.
At a certain resonance frequency (4 MHz), ′ decreases abruptly, reaching a negative value and suddenly increasing again. This negative permittivity may be interpreted using microscopic and macroscopic approaches. The microscopic approach may refer to the charge carrier oscillation at plasma frequency [43,44] (In Earth's ionosphere, the electrons in the plasma naturally oscillate relative to the ions at frequencies between 2 MHz and 20 MHz, which is called plasma frequency). In addition, the macroscopic approach may be called an induction effect. The microscopic approach results from the high mobility of ions at high frequencies, which raises the conductivity, as will be seen in the AC conductivity results [50,51]. This resonance absorption occurs when the applied electric field's frequency equals the charge carriers' oscillation frequency. While the macroscopic approach can be interpreted by the presence of a conducting path (from localized charge carriers) in a dielectric matrix causing an induction effect in Mega Hertz frequency range and generating current loops in this metallic-like network, as occurring in metamaterials characterized by a negative permittivity [52]. This means that the dielectric behavior transformed from relaxation spectrum to resonance spectrum at a certain resonance frequency. After that, the material recovers its normal relaxation state.
4.8. AC electrical conductivity discussion
The AC conductivity corresponding to the universal relation obeys the power law:
| (8) |
where,
| (9) |
Equation (8) consists of two terms, with the first term (σDC) representing the frequency-independent DC conductivity of a material. The second term (aωn) is related to the dielectric relaxation caused by localized charge carriers, and this term is frequency-dependent (Equation (9)) [45]. As shown in Fig. 10, the frequency-independent portion of the conductivity corresponds to the DC conductivity at lower frequencies. This can be attributed to the high resistivity of the grain boundaries, which are more effective in the low-frequency range. At higher frequencies, the AC conductivity (σ′(ω)) exhibits dispersion, increasing roughly in a power-law fashion due to the increased availability of conductive channels within the grains and enhanced charge carrier hopping [6,53]. In addition, the capacitive reactance decreases at high frequencies, resulting in a reduction in impedance and an increase in AC conductivity. At the resonance frequency (4 MHz), the AC conductivity exhibits behavior consistent with the interpretation of the dielectric constant discussed previously.
Fig. 10.

AC conductivity of MgFe2O4 as a function of frequency.
4.9. The dielectric loss (ε′′) and dielectric loss tangent (tanδ) discussion
Dielectric material loss can arise from either leakage current loss during the hopping transitions of charge carriers or dielectric loss due to delays in the polarization process caused by alterations in the applied electric field frequency [54]. Interfacial polarization occurs by the movement of space charges in the direction of the AC field, which experiences internal friction. This frictional motion results in energy dissipation (loss) in the form of heat, which can be expressed as dielectric loss (′′) [55]. Furthermore, tanδ is the ratio of the dissipated energy (′′) to the stored energy (′) in the dielectric material [45].
In the present study, the frequency dependence of ε′′ is the same as that of tanδ, as both decrease with increasing frequency at different temperatures, as shown in Fig. 11, Fig. 12. This dispersion is attributed to the contribution of high-resistance grain boundaries to the polarization process at low frequencies. As a result, charge carriers require more energy to move among different sites in the ferrite, explaining the high values of both ε′′ and tanδ. At high frequencies, the effect of low-resistance grains dominates, and less energy is required for hopping. Therefore, the dielectric loss decreases [56].
Fig. 11.

tanδ of MgFe2O4 as a function of frequency.
Fig. 12.

The dielectric loss ε′′ of MgFe2O4 as a function of frequency.
4.10. Impedance spectroscopy discussion
The complex impedance has been used to illustrate the frequency dependency of the electrical characteristics as indicated by the following relation (Equation (10)):
| (10) |
The resistive and capacitive or inductive elements in electric circuits can be joined together in impedance. Therefore, the materials' leakage currents and dielectric behavior should be considered [57].
The real part of the complex impedance, Z′(ω), is a measure of the electric loss and is directly proportional to the AC resistivity and inversely proportional to the AC conductivity. Fig. 13 displays the variation of Z′ with frequency. It is evident that Z′ decreases with increasing frequency. At lower frequencies, the higher values of Z′ indicate lower values of AC conductivity ′AC (). In comparison, at higher frequencies, Z′ decreases. This is due to the stimulated hopping and release of charge carriers in the high-frequency range, leading to the coincidence of Z′ values at all temperatures at high frequencies due to the neglect of barrier (grain boundary) properties and the dominance of the effect of grains [58].
Fig. 13.

The Z′ of MgFe2O4 as a function of frequency.
The imaginary part of impedance Z′′ has a frequency dependence, as shown in Fig. 14. The prepared samples exhibit a relaxation peak at a resonance frequency that shifts towards higher frequencies with increasing temperature. This peak arises when the hopping polarization frequency matches the applied field frequency [59,60]. This means that the charge carriers absorb energy from the electric field at a certain frequency, and the polarization becomes maximum. We can know whether the charge carriers' transport is long-range (migrating long distances) or short-range (localized transitions). Suppose Z′′max occurs at the same frequency at varying temperatures. In that case, it indicates that the relaxation process is due to long-range transport. In contrast, if Z′′max occurs at different frequencies, it suggests that the relaxation is caused by localized (short-range) charge carrier transport [46]. Therefore, we can deduce that the relaxation process in our ferrite sample is localized transport of charge carriers.
Fig. 14.

The imaginary part of impedance Z′′ of MgFe2O4 as a function of frequency.
The Nyquist plot (Cole-Cole plot) in Fig. 15 for the MgFe2O4 sample displays two semicircular arcs. The first arc corresponds to grain boundaries (GB) contribution at lower frequencies. In comparison, the second arc corresponds to the contribution from grains (G) at higher frequencies [61]. However, only the GB semicircular arc appears clearly, and its equivalent circuit is a parallel resistor-capacitor (RC). The diameter of the GB semicircle changes with temperature due to changing the ohmic resistance of the grain boundary. The semicircular arcs collapse with increasing temperature because the thermally activated hopping process decreases resistivity [58]. Furthermore, the grain equivalent circuit is also parallel RC Still, its semicircle is very small and cannot appear clearly in the graph.
Fig. 15.

Cole-Cole diagram of MgFe2O4 as a function of frequency.
Whereas the equivalent circuit at the observed resonance frequency (4 MHz) is parallel RLC because of the presence of the inductive element effect in the material as mentioned above, as shown in Fig. 16. This equivalent circuit consists of a resistor (R) and an inductor (L) in series where R and L are in parallel with a capacitor (C).
Fig. 16.
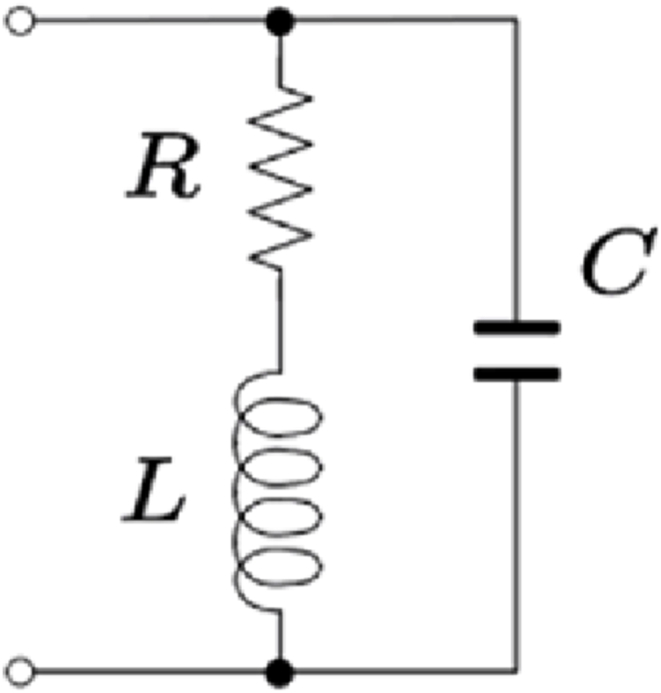
the RLC equivalent circuit of the MgFe2O4 sample at the resonance frequency.
4.11. Discussion of the effect of PEG doping on the electrical properties
The DC conductivity of composite samples has been investigated at room temperature. The overall behavior decreases σDC by embedding ferrite nanoparticles into the polymer matrix, as seen in Table 3. According to the literature [62], the DC conductivity of commercial PEG-4000 equals 1.87 × 10⁻¹¹ Ω−1 m−1, which is lower than that of the ferrite sample. This means that the conductivity of PEG is enhanced by doping with ferrite nanoparticles because the charge carrier hopping process between ferrite sites occurs through the polymer chain with the help of bond rotation, which is accompanied by segmental motion [62]. On the other hand, when the metal ion-oxygen bond length increases, as mentioned above, the hopping length increases, and the probability of charge carrier hopping decreases and consequently, DC decreases. Therefore, the conductivity of composites is lower than that of pure ferrites.
Table 3.
DC conductivity (DC Ω−1·m−1) values of different PEG doping ratios (%) at room temperature for PEG/MgFe2O4 composite samples.
| PEG wt.% | DC conductivity (σDC Ω−1·m−1) at room temperature |
|---|---|
| 0 | 5.48 × 10⁻⁶ |
| 20 | 2.29 × 10⁻⁶ |
| 50 | 2.92 × 10⁻⁷ |
| 80 | 8.99 × 10⁻⁷ |
On the other hand, the dielectric phenomena of polyethylene glycol can be described by dipole polarization, which results from the presence of a hydroxyl group in the molecule H–(O–CH2–CH2)–OH. The flexibility of the molecular chain of PEG is attributed to the rotation around the C–O bond in its backbone chain [63]. According to the literature [20,63], the dielectric permittivity of different molecular weights PEG samples has limited small values. The present study examined the dielectric properties of all prepared PEG/MgFe2O composites at room temperature. It was noticed from all-dielectric parameters figures show that there is no systematic variation in these parameters by varying the PEG/ferrite mass ratio.
In Fig. 17, the dielectric constant ′ decreases with frequency as expected. However, it is noticed that ′ has its maximum values at 80% MgFe2O4+20% PEG. This obvious increase of the dielectric parameters with increasing PEG in the composites may be related to the amorphous state of PEG compared to the crystalline state of ferrite nanoparticles. This means that adding a certain amount of amorphous polymer, which has loose and weak molecular packing, increases the composite material's flexibility [64]. This assists the molecules to be able to orient themselves relatively easily and rapidly when varying the frequency of the electric field.
Fig. 17.

The dielectric constant of the PEG/MgFe2O4 composite sample as a function of frequency.
On the other hand, the AC conductivity values (AC) of the PEG/MgFe2O4 composites appear to be close together, as shown in Fig. 18, especially in the low-frequency range. However, in the high-frequency range, it is observed that AC has its maximum at 80% MgFe2O4+20% PEG which may be due to the uncontrollable agglomeration of ferrite nanoparticles may cause the serial arrangement of ferrite grains in the polymer matrix [22] that facilitates hopping among sites during the frequency variation and increases the conductivity.
Fig. 18.

AC conductivity of PEG/MgFe2O4 composite samples as a function of frequency.
The dielectric polarization processes and hopping conduction greatly affect the dielectric losses (Tan and ) and the real and imaginary parts of impedance (Z′, Z′′) of PEG/MgFe2O4 composite materials (see Fig. 22). Therefore, these parameters have non-monotonic variation with changing PEG/MgFe2O4 mass ratio. It is worth mentioning that tan , , Z′ and Z′′ for composite samples have the same behavior as pure ferrite, as shown in Fig. 19, Fig. 20, Fig. 21, Fig. 22, Fig. 23.
Fig. 22.

The imaginary part of impedance Z′′ of PEG/MgFe2O4 composite samples as a function of frequency.
Fig. 19.

tanδ of PEG/MgFe2O4 composite samples as a function of frequency.
Fig. 20.

The dielectric loss ε′′ of PEG/MgFe2O4 composite samples as a function of frequency.
Fig. 21.

The real part of impedance Z′ of PEG/MgFe2O4 composite samples as a function of frequency.
Fig. 23.

Cole-Cole diagram of PEG/MgFe2O4 composite samples as a function of frequency.
5. Conclusions
This study has provided a comprehensive and insightful analysis of nanostructured magnesium ferrite's electrical and dielectric properties (MgFe2O4) and its composites with polyethylene glycol (PEG). Through meticulous experimentation and analysis, several key findings have emerged that hold significant implications for materials science and electronic applications. Firstly, the study revealed that incorporating PEG into MgFe2O4 influences the electrical behavior of the composites. The temperature and frequency-dependent electrical characteristics were explored, and it was observed that the composites exhibit stable electrical behavior at room temperature. Furthermore, the low dielectric loss observed in the composites suggests their suitability for applications requiring minimal energy dissipation, such as microelectronic devices. The electron-hole hopping mechanism was identified as a significant factor contributing to the dielectric dispersion with frequency. Additionally, complex impedance data analysis provided insights into composites' capacitive and resistive properties, attributing them mainly to grain boundary processes. This understanding is crucial for optimizing the materials for specific applications. This study has contributed to the fundamental understanding of the electrical and dielectric properties of MgFe2O4 and PEG composites and highlighted their potential for a wide range of applications in cutting-edge electronic devices. Future research may focus on optimizing the synthesis process and exploring integrating these materials into practical applications.
Author contribution statement
Enas H. El-Ghazzawy: Hesham M.H. Zakaly: Albandari W. Alrowaily: Conceived and designed the experiments; Analyzed and interpreted the data; Wrote the paper. Samia A. Saafan: Antoaneta Ene: Naghat M. Abo-aita: Performed the experiments; Contributed reagents, materials, analysis tools or data. Moustafa A. Darwish: Di Zhou: Ahmed S. Atlam: Analyzed and interpreted the data; Wrote the paper.
Data availability statement
Data included in article/supp. material/referenced in the article.
Declaration of competing interest
The authors declare that they have no known competing financial interests or personal relationships that could have appeared to influence the work reported in this paper.
Acknowledgements
The authors express their gratitude to Princess Nourah bint Abdulrahman University Researchers Supporting Project (Grant No. PNURSP2023R378), Princess Nourah bint Abdulrahman University, Riyadh, Saudi Arabia.
Contributor Information
Hesham M.H. Zakaly, Email: h.m.zakaly@gmail.com, hesham.zakaly@istinye.edu.tr.
Antoaneta Ene, Email: antoaneta.ene@ugal.ro.
References
- 1.Batoo K.M., Kumar S., Lee C.G., Alimuddin Finite size effect and influence of temperature on electrical properties of nanocrystalline Ni-Cd ferrites. Curr. Appl. Phys. 2009;9:1072–1078. doi: 10.1016/j.cap.2008.12.002. [DOI] [Google Scholar]
- 2.Heiba Z.K., Mohamed M.B., Wahba A.M., Almalowi M.I. Effect of vanadium doping on structural and magnetic properties of defective nano-nickel ferrite. Appl. Phys. Mater. Sci. Process. 2018;124:1–9. doi: 10.1007/s00339-018-1721-3. [DOI] [Google Scholar]
- 3.Grunberg P. second ed. Springer; USA: 2009. Nanoscale Magnetic Materials and Applications. [Google Scholar]
- 4.Abdallah H.M.I., Moyo T. Superparamagnetic behavior of MnxNi1−xFe2O4 spinel nanoferrites. J. Magn. Magn Mater. 2014;361:170–174. doi: 10.1016/j.jmmm.2014.02.077. [DOI] [Google Scholar]
- 5.Deraz N.M., Abd-Elkader O.O. Investigation of magnesium ferrite spinel solid solution with iron-rich composition. Int. J. Electrochem. Sci. 2013;8:9071–9081. [Google Scholar]
- 6.Yadav R.S., Ku I., Vilcakova J., Urb P., Machovsky M., Holek M. Structural , magnetic , optical , dielectric , electrical and modulus spectroscopic characteristics of ZnFe 2 O 4 spinel ferrite nanoparticles synthesized via honey-mediated sol-gel combustion method. J. Phys. Chem. Solid. 2017;110:87–99. doi: 10.1016/j.jpcs.2017.05.029. [DOI] [Google Scholar]
- 7.Valenzuela R. Novel applications of ferrites valenzuela. Hindawi Publ. Corp. Phys. Res. Int. Phys. Res. Int. 2012;2012 doi: 10.1155/2012/591839. [DOI] [Google Scholar]
- 8.Hammache Z., Soukeur A., Omeiri S., Bellal B., Trari M. Physical and photo-electrochemical properties of MgFe 2 O 4 prepared by sol gel route: application to the photodegradation of methylene blue. J. Mater. Sci. Mater. Electron. 2019;30:5375–5382. doi: 10.1007/s10854-019-00830-2. [DOI] [Google Scholar]
- 9.Ali I., Shakoor A., Islam M.U., Saeed M., Ashiq M.N., Awan M.S. Synthesis and characterization of hexagonal ferrite Co2Sr 2Fe12O22 with doped polypyrrole composites. Curr. Appl. Phys. 2013;13:1090–1095. doi: 10.1016/j.cap.2013.02.014. [DOI] [Google Scholar]
- 10.Quadri S.A.M.N. Nayeemuddin, low-density polyethylene/calcium ferrite nanocomposites films prepared for structural, morphological, mechanical and DC conductivity characterization. Int. J. Recent Technol. Eng. 2019;8:323–327. doi: 10.35940/ijrte.d6833.118419. [DOI] [Google Scholar]
- 11.Gordon K.L., Kang J.H., Park C., Lillehei P.T., Harrison J.S. A novel negative dielectric constant material based on phosphoric acid doped poly(benzimidazole) J. Appl. Polym. Sci. 2012;125:2977–2985. doi: 10.1002/app.36248. [DOI] [Google Scholar]
- 12.Topkaya R., Kurtan U., Baykal A., Sözeri H., Toprak M.S. Polymer assisted Co-precipitation synthesis and characterization of polyethylene glycol (PEG)/CoFe2O4 nanocomposite. J. Inorg. Organomet. Polym. Mater. 2013;23:592–598. doi: 10.1007/s10904-012-9818-1. [DOI] [Google Scholar]
- 13.Barber P., Balasubramanian S., Anguchamy Y., Gong S., Wibowo A., Gao H., Ploehn H.J., Zur Loye H.C. 2009. Polymer Composite and Nanocomposite Dielectric Materials for Pulse Power Energy Storage. [DOI] [Google Scholar]
- 14.Qi Z., Chunbo L., Zhuang W., Yang Y., Zhiyong X., Haikun Z., Chudong C. Preparation of rGO/PVA/CIP composites and their microwave absorption properties. J. Magn. Magn Mater. 2019;479:337–343. doi: 10.1016/j.jmmm.2018.11.129. [DOI] [Google Scholar]
- 15.Abu-Elsaad N.I., Nawara A.S., Mazen S.A. Synthesis, structural characterization, and magnetic properties of Ni–Zn nanoferrites substituted with different metal ions (Mn2+, Co2+, and Cu2+) J. Phys. Chem. Solid. 2020;146 doi: 10.1016/j.jpcs.2020.109620. [DOI] [Google Scholar]
- 16.Jangam K., Patil K., Balgude S., Patange S., More P. Synthesis and characterization of magnetically separable Zn1-xCoxFeMnO4 nanoferrites as highly efficient photocatalyst for degradation of dye under solar light irradiation. J. Phys. Chem. Solid. 2021;148 doi: 10.1016/j.jpcs.2020.109700. [DOI] [Google Scholar]
- 17.Shoba M., Kaleemulla S. Structural, optical and dielectric studies of Er substituted zinc ferrite nanospheres. J. Phys. Chem. Solid. 2017;111:447–457. doi: 10.1016/j.jpcs.2017.08.028. [DOI] [Google Scholar]
- 18.Kumari S., Dhanda N., Thakur A., Singh S., Thakur P. Investigation of calcium substitution on magnetic and dielectric properties of Mg–Zn nano ferrites. Mater. Chem. Phys. 2023;297:1–10. doi: 10.1016/j.matchemphys.2023.127394. [DOI] [Google Scholar]
- 19.Kumari S., Dhanda N., Thakur A., Gupta V., Singh S., Kumar R., Hameed S., Thakur P. Nano Ca–Mg–Zn ferrites as tuneable photocatalyst for UV light-induced degradation of rhodamine B dye and antimicrobial behavior for water purification. Ceram. Int. 2023;49:12469–12480. doi: 10.1016/j.ceramint.2022.12.107. [DOI] [Google Scholar]
- 20.Sengwa R.J., Kaur K., Chaudhary R. Dielectric properties of low molecular weight poly(ethylene glycol)s. Polym. Int. 2000;49:599–608. doi: 10.1002/1097-0126(200006)49:6<599::AID-PI425>3.0.CO;2-K. [DOI] [Google Scholar]
- 21.Aisida S.O., Akpa P.A., Ahmad I., Maaza M., Ezema F.I. Influence of PVA, PVP and PEG doping on the optical, structural, morphological and magnetic properties of zinc ferrite nanoparticles produced by thermal method. Phys. B Condens. Matter. 2019;571:130–136. doi: 10.1016/j.physb.2019.07.001. [DOI] [Google Scholar]
- 22.Ahmed M.A., Okasha N., Imam N.G. Crossover between PEG and BT/NZF magnetoelectric nanocomposites for tailoring applicable multiferroic materials. J. Supercond. Nov. Magnetism. 2015;28:2783–2793. doi: 10.1007/s10948-015-3115-5. [DOI] [Google Scholar]
- 23.Topkaya R., Kurtan U., Baykal A., Sozeri H., Toprak M.S. Polymer assisted Co-precipitation synthesis and characterization of polyethylene glycol (PEG)/CoFe2O4 nanocomposite. J. Inorg. Organomet. Polym. Mater. 2013;23:592–598. doi: 10.1007/s10904-012-9818-1. [DOI] [Google Scholar]
- 24.Priyadharsini P., Pradeep A., Rao P.S., Chandrasekaran G. Structural, spectroscopic and magnetic study of nanocrystalline Ni-Zn ferrites. Mater. Chem. Phys. 2009;116:207–213. doi: 10.1016/j.matchemphys.2009.03.011. [DOI] [Google Scholar]
- 25.Khirade P.P., Chavan A.R., Somvanshi S.B., Kounsalye J.S., Jadhav K.M. Tuning of physical properties of multifunctional Mg-Zn spinel ferrite nanocrystals: a comparative investigations manufactured via conventional ceramic versus green approach sol-gel combustion route. Mater. Res. Express. 2020;7 doi: 10.1088/2053-1591/ABCA6C. [DOI] [Google Scholar]
- 26.Van Tran C., La D.D., Thi Hoai P.N., Ninh H.D., Thi Hong P.N., Vu T.H.T., Nadda A.K., Nguyen X.C., Nguyen D.D., Ngo H.H. New TiO2-doped Cu–Mg spinel-ferrite-based photocatalyst for degrading highly toxic rhodamine B dye in wastewater. J. Hazard Mater. 2021;420 doi: 10.1016/j.jhazmat.2021.126636. [DOI] [PubMed] [Google Scholar]
- 27.El-Shater R.E., Atlam A.S., Elnimr M.K., Assar S.T., Tishkevich D.I., Zubar T.I., V Trukhanov S., V Trukhanov A., Zhou D., Darwish M.A. AC measurements, impedance spectroscopy analysis, and magnetic properties of Ni0.5Zn0.5Fe2O4/BaTiO3 multiferroic composites. Mater. Sci. Eng. B. 2022;286 doi: 10.1016/j.mseb.2022.116025. [DOI] [Google Scholar]
- 28.Mahajan H., Godara S.K., Srivastava A.K. Synthesis and investigation of structural, morphological, and magnetic properties of the manganese doped cobalt-zinc spinel ferrite. J. Alloys Compd. 2022;896 doi: 10.1016/j.jallcom.2021.162966. [DOI] [Google Scholar]
- 29.Chahar D., Kumar D., Thakur P., Thakur A. Visible light induced photocatalytic degradation of methylene blue dye by using Mg doped Co-Zn nanoferrites. Mater. Res. Bull. 2023;162 doi: 10.1016/j.materresbull.2023.112205. [DOI] [Google Scholar]
- 30.Singh Yadav R., Kuřitka I., Havlica J., Hnatko M., Alexander C., Masilko J., Kalina L., Hajdúchová M., Rusnak J., Enev V. Structural, magnetic, elastic, dielectric and electrical properties of hot-press sintered Co1−xZnxFe2O4 (x = 0.0, 0.5) spinel ferrite nanoparticles. J. Magn. Magn Mater. 2018;447:48–57. doi: 10.1016/j.jmmm.2017.09.033. [DOI] [Google Scholar]
- 31.Arshad M.I., Arshad S., Mahmood K., Ali A., Amin N., Umaid-ur-Rehman, Isa M., Akram A., Sabir N., Ajaz-un-Nabi M. Impact of Mg doping on structural, spectral and dielectric properties of Cd–Cu nano ferrites prepared via sol-gel auto combustion method. Phys. B Condens. Matter. 2020;599 doi: 10.1016/j.physb.2020.412496. [DOI] [Google Scholar]
- 32.Shameli K., Mahdavi M., Shabanzadeh P., Jazayeri S.D., Bin Ahmad M., Sedaghat S., Abdollahi Y., Jahangirian H. Synthesis and characterization of polyethylene glycol mediated silver nanoparticles by the green method. Int. J. Mol. Sci. 2012;13:6639–6650. doi: 10.3390/ijms13066639. [DOI] [PMC free article] [PubMed] [Google Scholar]
- 33.Mohsin M., Ansari N., Khan S. Structural , electrical and optical properties of sol-gel synthesized cobalt substituted MnFe 2 O 4 nanoparticles Structural , electrical and optical properties of sol-gel synthesized cobalt substituted MnFe 2 O 4 nanoparticles. Phys. B Phys. Condens. Matter. 2017;520:21–27. doi: 10.1016/j.physb.2017.06.020. [DOI] [Google Scholar]
- 34.Amer M.A., Meaz T.M., Mostafa A.G., El H.F. Ghazally, Structural and physical properties of the nano-crystalline Al-substituted Cr–Cu ferrite. J. Magn. Magn Mater. 2013;343:286–292. doi: 10.1016/j.jmmm.2013.05.008. [DOI] [Google Scholar]
- 35.Saafan S.A., Meaz T.M., El-Ghazzawy E.H., El Nimr M.K., Ayad M.M., Bakr M., C A., C D. Conductivity of NiZn ferrite nanoparticles in wet and dry conditions. J. Magn. Magn Mater. 2010;322:2369–2374. doi: 10.1016/j.jmmm.2010.02.039. [DOI] [Google Scholar]
- 36.Assar S.T., Abosheiasha H.F., Mansour D.E.A., Darwish M.A. Preparation and investigation of epoxy/Li0.5AlxFe2.5-xO4 nanocomposites for electronic packaging applications. J. Alloys Compd. 2020;821 doi: 10.1016/j.jallcom.2019.153533. [DOI] [Google Scholar]
- 37.Darwish M.A., Saafan S.A., El- Kony D., Salahuddin N.A. Preparation and investigation of dc conductivity and relative permeability of epoxy/Li–Ni–Zn ferrite composites. J. Magn. Magn Mater. 2015;385:99–106. doi: 10.1016/j.jmmm.2015.02.068. [DOI] [Google Scholar]
- 38.Hanemann T., Szabó D.V. 2010. Polymer-nanoparticle Composites: from Synthesis to Modern Applications. [DOI] [Google Scholar]
- 39.El-Ghazzawy E.H. Effect of heat treatment on structural, magnetic, elastic and optical properties of the co-precipitated Co0.4Sr0.6Fe2O4. J. Magn. Magn Mater. 2020;497 doi: 10.1016/j.jmmm.2019.166017. [DOI] [Google Scholar]
- 40.Mazen S.A., Elmosalami T.A. Structural and elastic properties of Li-Ni ferrite. ISRN Condens. Matter Phys. 2011. 2011:1–9. doi: 10.5402/2011/820726. [DOI] [Google Scholar]
- 41.Saafan S., Elghazzawy E., Abo-Aita N. Preparation and structural investigation of Polyethylene glycol (PEG)/nano-ferrite composites, Egypt. J. Solids. 2021;43:174–191. doi: 10.21608/ejs.2021.98349.1022. [DOI] [Google Scholar]
- 42.Rashidi S., Ataie A. A comparison study of polymer/cobalt ferrite nano-composites synthesized by mechanical alloying route. J. Ultrafine Grained Nanostruct. Mater. 2016;48:59–67. doi: 10.7508/jufgnsm.2015.02.001. [DOI] [Google Scholar]
- 43.Ibach H., Luth H. fourth ed. Springer; Germany: 2010. Solid-State Physics: An Introduction to Principles of Materials Science. [DOI] [Google Scholar]
- 44.Hakeem A., Alshahrani T., Muhammad G., Alhossainy M.H., Laref A., Khan A.R., Ali I., Tahir Farid H.M., Ghrib T., Ejaz S.R., Khosa R.Y. Magnetic, dielectric and structural properties of spinel ferrites synthesized by sol-gel method. J. Mater. Res. Technol. 2021;11:158–169. doi: 10.1016/j.jmrt.2020.12.064. [DOI] [Google Scholar]
- 45.Jonscher A. Chelsea Dielectric Press; London: 1983. Dielectric Relaxation in Solids. [Google Scholar]
- 46.Singh S., Katyal S.C., Goswami N. Dielectric and electrical study of zinc copper ferrite nanoparticles prepared by exploding wire technique. Appl. Phys. Mater. Sci. Process. 2019;125:1–14. doi: 10.1007/s00339-019-2936-7. [DOI] [Google Scholar]
- 47.Mubasher M., Mumtaz M., Hassan L., Ali Z., Ahmad M.A., Imtiaz M.F., Aamir A., Rehman K. Nadeem, Comparative study of frequency-dependent dielectric properties of ferrites MFe2O4 (M = Co, Mg, Cr and Mn) nanoparticles. Appl. Phys. Mater. Sci. Process. 2020;126:1–14. doi: 10.1007/s00339-020-03529-y. [DOI] [Google Scholar]
- 48.Mahato D.K. Ac conductivity analysis of nanocrystallite MgFe2O4 ferrite. Mater. Today Proc. 2018;5:9191–9195. doi: 10.1016/j.matpr.2017.10.043. [DOI] [Google Scholar]
- 49.Balavijayalakshmi J., Suriyanarayanan N., Jayaprakash R. Role of copper on structural, magnetic and dielectric properties of nickel ferrite nano particles. J. Magn. Magn Mater. 2015;385:302–307. doi: 10.1016/j.jmmm.2015.03.036. [DOI] [Google Scholar]
- 50.Çetinkaya H.G., Alialy S., Altındal, Kaya A. Uslu, Investigation of negative dielectric constant in Au/1 % graphene (GP) doped-Ca1.9Pr0.1Co4Ox/n-Si structures at forward biases using impedance spectroscopy analysis. J. Mater. Sci. Mater. Electron. 2015;26:3186–3195. doi: 10.1007/s10854-015-2816-7. [DOI] [Google Scholar]
- 51.Gajula G.R., Buddiga L.R., Chidambara C.K., Ch A.K., Dasari M. Dielectric, magnetic and magnetoelectric studies of lithium ferrite synthesized by solid state technique for wave propagation applications. J. Sci. Adv. Mater. Devices. 2018;3:230–235. doi: 10.1016/j.jsamd.2018.04.007. [DOI] [Google Scholar]
- 52.Cheng C., Fan R., Ren Y., Ding T., Qian L., Guo J., Li X., An L., Lei Y., Yin Y., Guo Z. Radio frequency negative permittivity in random carbon nanotubes/alumina nanocomposites. Nanoscale. 2017;9:5779–5787. doi: 10.1039/c7nr01516j. [DOI] [PubMed] [Google Scholar]
- 53.Atiq S., Majeed M., Ahmad A., Abbas S.K., Saleem M., Riaz S., Naseem S. Synthesis and investigation of structural, morphological, magnetic, dielectric and impedance spectroscopic characteristics of Ni-Zn ferrite nanoparticles. Ceram. Int. 2017;43:2486–2494. doi: 10.1016/j.ceramint.2016.11.046. [DOI] [Google Scholar]
- 54.Zhang T., He Y., Wang R., Geng W., Wang L., Niu L., Li X. Analysis of dc and ac properties of humidity sensor based on polypyrrole materials. Sensor. Actuator. 2008;131:687–691. doi: 10.1016/j.snb.2007.12.059. [DOI] [Google Scholar]
- 55.Afsana N., Ahamed J.U., Khan M. Synthesis and magnetic properties of NiFe 2 − x Al x O 4 nanoparticles. J. Supercond. Nov. Magnetism. 2019 [Google Scholar]
- 56.Ashiq M.N., Iqbal M.J., Najam-Ul-Haq M., Hernandez Gomez P., Qureshi A.M. Synthesis, magnetic and dielectric properties of ErNi doped Sr-hexaferrite nanomaterials for applications in High density recording media and microwave devices. J. Magn. Magn Mater. 2012;324:15–19. doi: 10.1016/j.jmmm.2011.07.016. [DOI] [Google Scholar]
- 57.Barsoukov E., Macdonald J.R. second ed. Canada; 2005. Impedance Spectroscopy. [DOI] [Google Scholar]
- 58.Oumezzine E., Hcini S., Rhouma F.I.H., Oumezzine M. Frequency and temperature dependence of conductance, impedance and electrical modulus studies of Ni0.6Cu0.4Fe2O4 spinel ferrite. J. Alloys Compd. 2017;726:187–194. doi: 10.1016/j.jallcom.2017.07.298. [DOI] [Google Scholar]
- 59.Hamdaoui N., Azizian-Kalandaragh Y., Khlifi M., Beji L. Structural, magnetic and dielectric properties of Ni0.6Mg0.4Fe2O4 ferromagnetic ferrite prepared by sol gel method. Ceram. Int. 2019;45:16458–16465. doi: 10.1016/j.ceramint.2019.05.177. [DOI] [Google Scholar]
- 60.Verma K., Sharma S. Impedance spectroscopy and dielectric behavior in barium strontium titanate-nickel zinc ferrite composites. Phys. Status Solidi Basic Res. 2012;249:209–216. doi: 10.1002/pssb.201147322. [DOI] [Google Scholar]
- 61.Ghosh P., Bhowmik R.N., Das M.R., Mitra P. Electrical conductivity and magnetic field dependent current-voltage characteristics of nanocrystalline nickel ferrite. Phys. E Low-Dimensional Syst. Nanostruc. 2017;88:218–227. doi: 10.1016/j.physe.2017.01.019. [DOI] [Google Scholar]
- 62.Murugendrappa M.V., Khasim S., Ambika Prasad M.V.N. Conductivity and DSC studies of poly(ethylene glycol) and its salt complexes. Indian J. Eng. Mater. Sci. 2000;7:456–458. [Google Scholar]
- 63.Mishra M.K., Moharana S., Dash B., Mahaling R.N. Effect of poly(ethylene glycol) on the dielectric properties of poly(vinylidene fluoride)/BiFeO3/poly(ethylene glycol) composite films for electronic applications. Polym. Sci. 2017;59:133–142. doi: 10.1134/S0965545X17010102. [DOI] [Google Scholar]
- 64.Pandey K., Dwivedi M.M., Das I.M.L., Singh M., Agrawal S.L. Ion transport studies on Al-Zn ferrite dispersed nano-composite polymer electrolyte. J. Electroceram. 2010;25:99–107. doi: 10.1007/s10832-009-9596-5. [DOI] [Google Scholar]
Associated Data
This section collects any data citations, data availability statements, or supplementary materials included in this article.
Data Availability Statement
Data included in article/supp. material/referenced in the article.