Abstract
Translation is pervasive outside of canonical coding regions, occurring in lncRNAs, UTRs, and introns1-4, especially in aging4-6, neurodegeneration5,7, and cancer8-10. Notably, the majority of tumor-specific antigens are results of noncoding translation11-13. While the resulting polypeptides are often nonfunctional, translation in noncoding regions is nonetheless necessary for the birth of new coding sequences14,15. The mechanisms underlying the surveillance of translation in diverse noncoding regions and how escaped polypeptides evolve new functions remain unclear10,16-19. Intriguingly, functional polypeptides derived from annotated noncoding sequences often localize to membranes20,21. Here, we integrate massively parallel analyses of over 10,000 human genomic sequences and millions of random sequences with genome-wide CRISPR screens, accompanied by in-depth genetic and biochemical characterizations. Our results show that the intrinsic nucleotide bias in the noncoding genome and in the genetic code frequently results in polypeptides with a hydrophobic C-terminal tail, which is captured by the ribosome-associated BAG6 membrane protein triage complex for either proteasomal degradation or membrane targeting. In contrast, canonical proteins have evolved to deplete C-terminal hydrophobic residues. Our results reveal a fail-safe mechanism for the surveillance of unwanted translation from diverse noncoding regions and suggest a possible biochemical route for the preferential membrane localization of newly evolved proteins.
How cells faithfully decode the genome to synthesize a functional proteome is a fundamental question in modern biology. While the fidelity of transcription and translation are high, the substrate specificities that dictate which DNA regions are transcribed and which RNA molecules are translated are rather low, resulting in pervasive transcription of the genome22 and widespread translation in noncoding regions of the transcriptome, such as UTRs, introns, and long noncoding RNAs (lncRNAs)1-4. Furthermore, these aberrant translational activities are elevated in aging4-6, neurodegeneration5,7, and cancer8-10, due to the impairment of mRNA splicing and polyadenylation7,23-25, mRNA quality control26-28, and translation termination10,29. Consequently, peptides derived from noncoding regions account for the majority of tumor-specific antigens11-13 and tend to be associated with unfavorable prognoses for patients30.
Despite the prevalence of translation in noncoding sequences and its likely significant contributions to disease pathogenesis, the surveillance mechanisms preventing the accumulation of potentially toxic aberrant translation products remain poorly understood. To date, relevant studies have primarily focused on 3’ UTR translation in a small set of genes and have reached very different conclusions regarding the role of ribosome stalling16,17, proteasomal degradation10,18, and lysosomal aggregation19. Alongside these conflicting results, the lack of studies involving lncRNAs, introns, and 5’ UTRs underscores the need for more systematic investigations aimed at uncovering potential unifying principles for the surveillance of translation in diverse types of noncoding sequences.
While most aberrant translation products are likely nonfunctional, on the evolutionary timescale translation in noncoding sequences is necessary to expose the noncoding genome to natural selection and to facilitate the origination of new protein-coding genes. There have been numerous recent discoveries of functional peptides translated from previously annotated lncRNAs in mammalian cells20,21. Intriguingly, among 64 functional peptides whose cellular localization had been determined experimentally, about three-quarters (47) localize to plasma and organelle membranes (Supplementary Table 1). Similarly, studies in yeast show that proto-genes (translated non-genic sequences) tend to encode putative transmembrane regions14,15. However, the biochemical mechanism allowing polypeptides derived from noncoding sequences to escape cellular surveillance and preferentially localize to membranes remains elusive.
In this study, by combining unbiased high-throughput screens with in-depth dissection of individual cases, we present a unified model for the mitigation of translation in diverse noncoding sequences, which also provides insights into the preferential membrane targeting of newly evolved proteins.
Noncanonical proteins are unstable
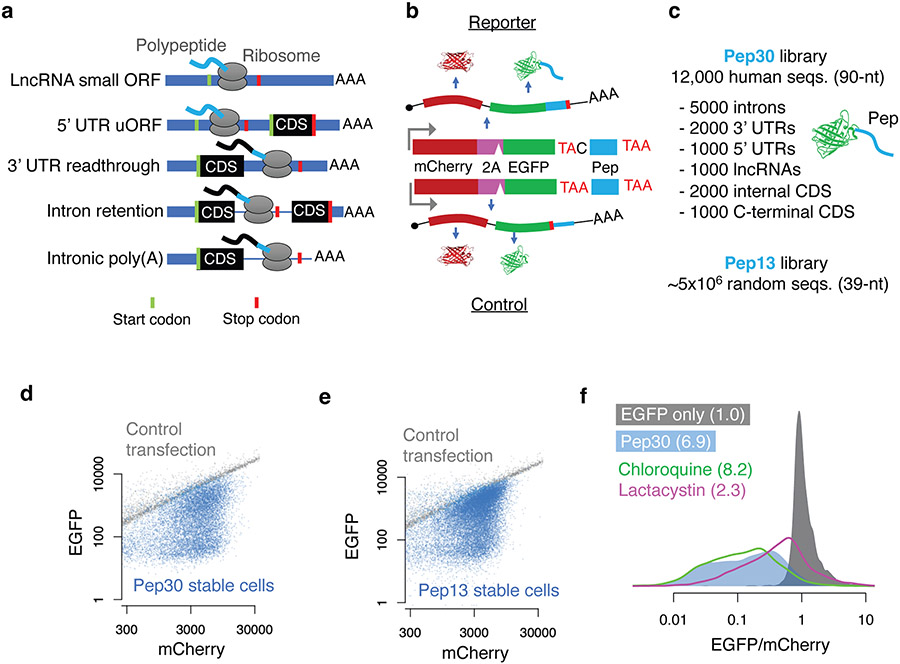
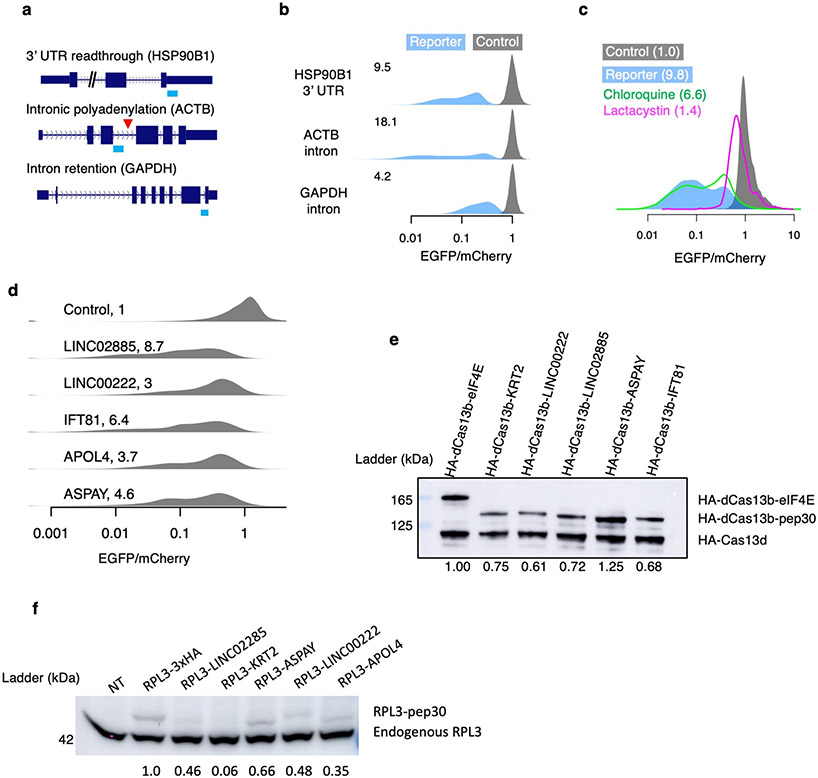
A common outcome of translation in various noncoding contexts is that the resulting polypeptide has a C-terminal tail derived from annotated noncoding sequences (Fig. 1a, light blue). We therefore constructed reporters fusing various noncoding sequences to the C-terminal end of the EGFP ORF in an mCherry-2A-EGFP bicistronic reporter (Fig. 1b, top) and used the EGFP/mCherry ratio to quantify the impact of translation in noncoding sequences on EGFP levels in single cells while also normalizing for variations in transfection, transcription, and translation rates18,19. As a control, we generated a similar plasmid with a single nucleotide difference that creates a stop codon preventing translation into the noncoding sequence (Fig. 1b, bottom). Using this reporter system in HEK293T cells, we show that translation in the 3’ UTR of HSP90B1, the retained last intron of GAPDH, and the prematurely polyadenylated intron 3 of ACTB all resulted in substantial loss of EGFP (9.5, 18.1, and 4.2-fold, respectively, Extended Data Fig. 1a-b). Inhibition of the proteasome but not the lysosome almost completely rescued the loss of EGFP caused by ACTB intron translation (1.4-fold loss of EGFP/mCherry ratio relative to control) (Extended Data Fig. 1c), suggesting that the peptide encoded by the ACTB intron is primarily degraded by the proteasome.
Fig. 1 ∣. Noncoding translation products are unstable.
a, Noncoding translation in diverse contexts generates a C-terminal tail derived from noncoding sequences. Green/red bars indicate start/stop codons, respectively. CDS: canonical protein-coding sequences. b, Top: a mCherry-2A-EGFP bicistronic reporter for monitoring noncoding translation. Bottom: a control plasmid with a single base difference abolishing noncoding translation. Pep: noncoding sequence derived peptide. c, Two cell libraries where each cell stably expresses EGFP extended with either a sequence randomly selected from the human transcriptome (up to 30 aa, Pep30) or a random sequence (up to 13 aa, Pep13). d, flow cytometry analysis of the Pep30 (d) or Pep13 cell library (e). Also shown are cells transfected with the EGFP-only control reporter (gray). f, Density plot of the EGFP/mCherry ratio for Pep30 stable cells without treatment (light blue), or treated with proteasome inhibitor (lactacystin, magenta) or lysosome inhibitor (chloroquine, green). The numbers indicate the median fold loss of EGFP/mCherry relative to control (gray, EGFP only).
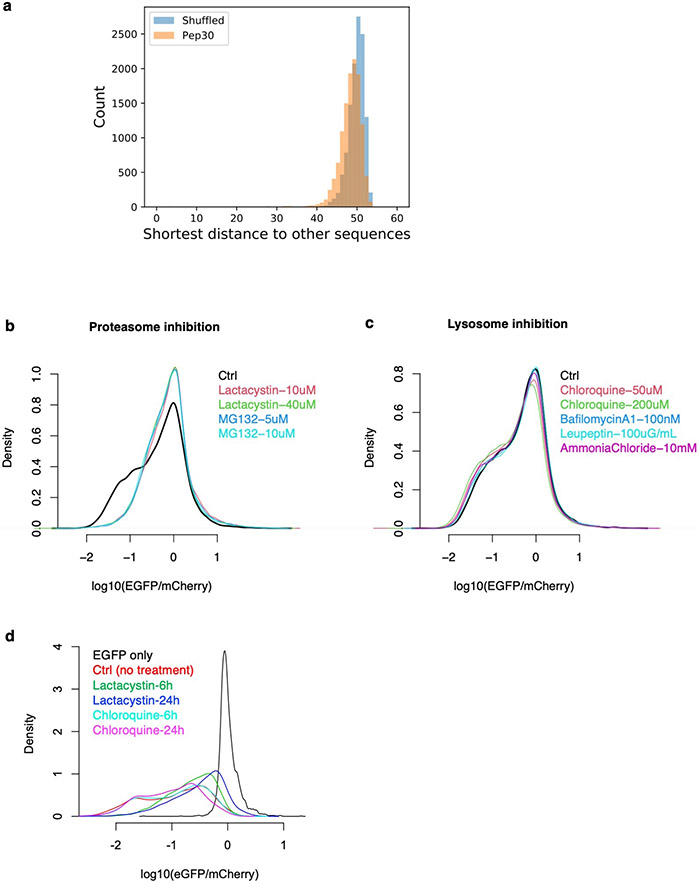
To systematically investigate translation in diverse types of noncoding sequences, we generated a library of HEK293T cells in which each cell stably expresses one of 12,000 bicistronic reporters, with EGFP fused to a C-terminal peptide encoded by an endogenous sequence (90-nt) randomly selected from human 5’ UTRs, 3’ UTRs, introns, lncRNAs, as well as coding sequences (CDS) from both internal and terminal coding exons (Pep30 library, Fig. 1c. Sequences listed in Supplementary Table 2. Diversity shown in Extended Data Fig. 2a). Using flow cytometry analysis, we observed a substantial loss of EGFP for almost all reporters, with no significant change in mCherry (Fig. 1d, median 6.9-fold decrease of EGFP/mCherry). These results suggest that translation in most noncoding sequences causes a decrease in the accumulation of the protein without affecting mRNA abundance. Six representative noncoding sequences were further tested in two non-EGFP reporters (RPL3 and PspCas13b) to rule out effects specific to EGFP or flow cytometry (Extended Data Fig. 1d-f). We also generated a second library (Pep13) in which EGFP was fused to ~5 million random sequences of 39 nucleotides (encoding peptides up to 13 amino acids) and observed a similar loss of EGFP (Fig. 1e), suggesting that translation in “unevolved” sequences is mitigated by default. Similar to the ACTB intron reporter (Extended Data Fig. 1c), the 6.9-fold loss of EGFP in the Pep30 cell library was reduced to 2.3-fold after 24 hours of proteasome inhibition, with lysosome inhibition having minimal effect (Fig. 1f. Other inhibitors in Extended Data Fig. 2b-d). These results demonstrate that aberrant translation products derived from diverse noncoding sequences are primarily degraded by the proteasome in human cells.
Instability linked to hydrophobic C-tail
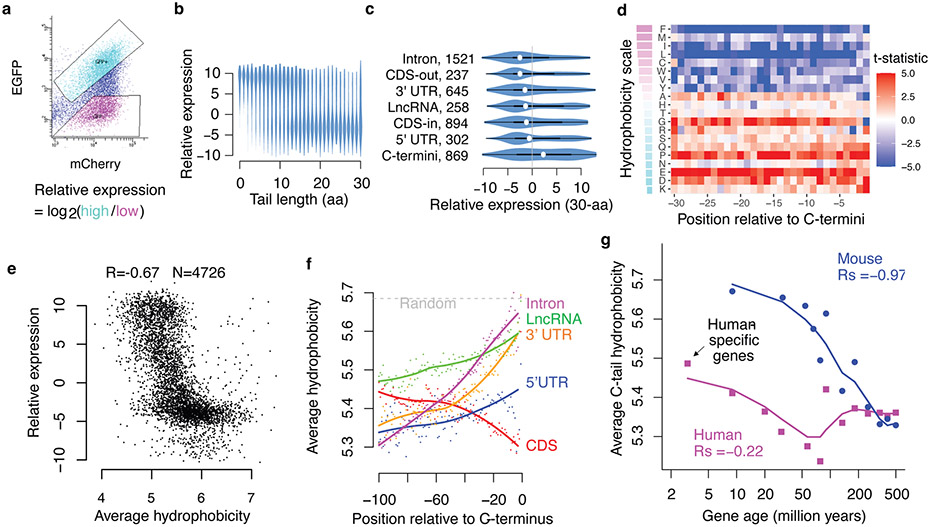
To quantify the expression of each reporter, we sorted cells with high EGFP and low EGFP into separate bins and sequenced the library DNA in each bin (Fig. 2a). Using the log2 ratio of read counts (EGFP-high/EGFP-low) as a measurement of EGFP expression (Fig. 2a), we found that EGFP expression is negatively correlated with the length of the tail peptide (peptides can be shorter than 30-aa due to in-frame stop codons), with most peptides 15-aa or longer being associated with low EGFP expression (Fig. 2b). The strong dependence on tail peptide length, and therefore stop codon recognition, indicates that the loss of EGFP is largely due to translation of the noncoding sequence, ruling out a major contribution of translation-independent mechanisms, such as RNA degradation or sequestration mediated by the noncoding sequence.
Fig. 2 ∣. Noncoding translation mitigation is associated with C-terminal hydrophobicity.
a, Pep30 stable cells were sorted into high and low EGFP bins and the tail sequences (DNA) were cloned and sequenced. The relative expression of each sequence is calculated as the log2 ratio of read counts in EGFP-high vs. EGFP-low bin. b, Violin plots of relative expression for tails of varying lengths. c, Violin and box plots comparing expression of 30-aa tails encoded by various types of sequences. The box indicates the minima, maxima, upper and lower quartiles and the white dot indicates the median value. The number of sequences in each category is indicated. CDS-out: frameshifted CDS. CDS-in: inframe CDS. d, A heatmap visualizing the association (Two-sided Student’s t-test statistics capped at 5.0) between expression and the presence of each amino acid at every position in the Pep30 library. Amino acids (rows) are sorted by hydrophobicity (Miyazawa scale). e, Average hydrophobicity vs. relative expression scatter plot for tails of 30-aa length. f, Genome-scale average hydrophobicity at each residue within the last 100-aa of peptides encoded by coding (>=200aa) and various noncoding sequences (>=30aa). g, Average C-tail (last 30aa) hydrophobicity of human (magenta) and mouse (blue) genes grouped by age based on time of origination estimated from vertebrate phylogeny. The lines are a loess fit of the dots.
To understand the determinants of degradation beyond the length of the tail peptide, we next focused on peptides of identical length (30-aa, n = 4,726). We found that translation in all classes of noncoding sequence is often associated with low protein expression, with the strongest effect observed in introns, followed by 3’ UTRs, lncRNAs, and 5’ UTRs (Fig. 2c). Interestingly, internal coding sequences, regardless of whether they are fused to EGFP in-frame or out-of-frame, often resulted in low expression comparable to that of noncoding sequences (Fig. 2c, CDS-inframe and CDS-frameshift), with frameshifted CDS being more destabilizing than those preserving the reading frame. In contrast, endogenous C-terminal coding sequences, which are fused to EGFP in-frame, comprise the only group that is more associated with high protein expression (Fig. 2c, C-termini). These results indicate that the signal that triggers proteasomal degradation of aberrant translation products is also present in annotated coding sequences (albeit weaker) but is depleted from the C-terminal ends of annotated proteins. Our data thus underscore the importance of protein C-termini in mediating protein degradation and suggest that functional proteins may have evolved to avoid proteasomal degradation, while proteins carrying an “unevolved” C-terminal tail are degraded by default, as is the case with truncated proteins as well as peptides derived from noncoding sequences and random sequences.
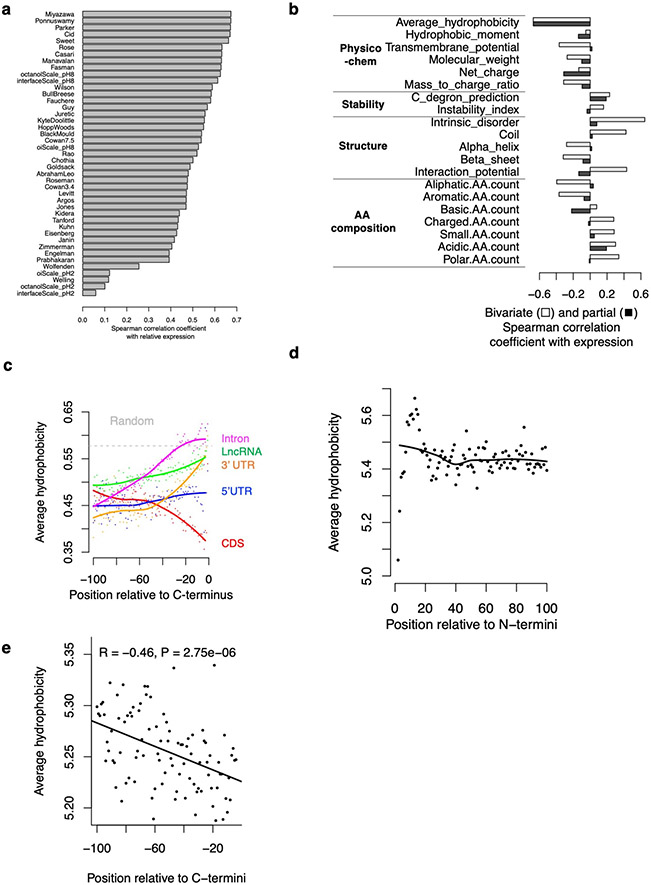
To uncover the exact nature of the degradation signal, we next examined the amino acid composition and various physicochemical and structural properties of the tail peptides. Strikingly, almost all hydrophobic residues are associated with low EGFP expression at most positions in the 30-aa tail (Fig. 2d). The only exception is alanine (A), which is the least hydrophobic of the nine hydrophobic residues, and is only associated with low expression at the last two positions, consistent with its function as a C-terminal end degron (C-degron) recognized by Cullin-RING E3ubiquitin ligases31,32. We also confirmed two other C-degrons, arginine (R) at the 3rd to last position and glycine (G) at the last position31,32 (Fig. 2d). However, a 30-variable regression model using A/G/R residues in the last ten positions is only weakly predictive of EGFP expression (Spearman correlation coefficient, Rs = −0.22). In contrast, the average hydrophobicity (Miyazawa scale) of residues in the 30-aa peptide has a much stronger negative correlation with EGFP expression (Rs = −0.67, Fig. 2e. Similar results with other hydrophobicity scales, Extended Data Fig. 3a).
Among all the physiochemical and structural properties examined, average hydrophobicity has the strongest negative correlation with expression (Extended Data Fig. 3b). While several other properties, including transmembrane potential, also showed a strong correlation with EGFP expression, these associations are largely due to their correlation with hydrophobicity, as when controlling for hydrophobicity (i.e., partial correlation), most of these associations become much weaker (Extended Data Fig. 3b), but not vice versa. One striking example is the tendency to be disordered (intrinsic disorder): while sometimes perceived as a trigger for protein degradation, protein disorder is positively correlated with EGFP expression (Rs = 0.65). However, this correlation was largely lost when controlling for hydrophobicity (Rs = 0.08). This is due to a strong negative correlation between protein disorder and hydrophobicity (Rs = −0.93), as has been previously documented33. Similarly, peptides predicted to fold into either α-helices or β-sheets are associated with low expression, whereas peptides predicted to be unstructured (coil/loop) are more highly expressed. These results highlight the dominant role of C-terminal hydrophobicity, and not C-degron or protein disorder, in triggering proteasomal degradation of polypeptides derived from diverse noncoding sequences in human cells.
Selection against C-tail hydrophobicity
To determine if C-terminal hydrophobicity underlies the aforementioned differential stability between canonical protein C-termini and all other sequences, including internal protein sequences and peptides derived from noncoding sequences (Fig. 2c), we performed genome-wide in silico analysis of C-terminal hydrophobicity in both the canonical proteome and the predicted noncoding proteome. We found that hydrophobic residues are progressively depleted towards the C-terminal end of canonical proteins (CDS), especially within the last 30 aa, whereas the opposite trend is present for all other sequences (Fig. 2f). Notably, the very C-termini of peptides from introns, 3’ UTRs, and lncRNAs have a hydrophobicity approaching that of entirely random amino acid sequences, suggesting that by default, unevolved nonfunctional proteins will have a relatively high average hydrophobicity and are subjected to proteasomal degradation. Similar results were obtained with a different hydrophobicity scale (Extended Data Fig. 3c). The depletion of C-terminal hydrophobicity is not detected at protein N-termini (Extended Data Fig. 3d) and cannot be explained by the lack of protein domains near the C-termini (Extended Data Fig. 3e).
Further supporting the evolutionary selection against protein C-terminal hydrophobicity, we found that in both humans and mice, evolutionarily young protein-coding genes tend to have higher hydrophobicity at the C-terminal tail (last 30aa) than evolutionarily older genes (Fig. 2g). For example, human-specific genes - the youngest human genes originating after the human-chimpanzee divergence 4 to 6 million years ago34 - have the highest C-terminal hydrophobicity as a group than that of older genes in the human genome. A strong negative correlation (Rs = −0.97, p < 10−15) is observed between estimated gene age and average protein C-tail hydrophobicity in the mouse genome, supporting the idea that as genes evolve, they progressively lose hydrophobic residues in the C-terminal tail, potentially resulting in longer protein half-lives. A similar albeit weaker trend is observed in the human genome, especially for genes originating within the last 100 million years (Fig. 2g).
Hydrophobicity bias in the genetic code
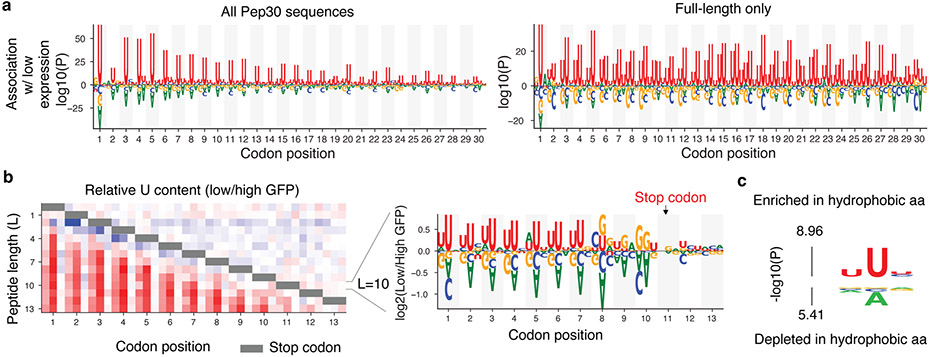
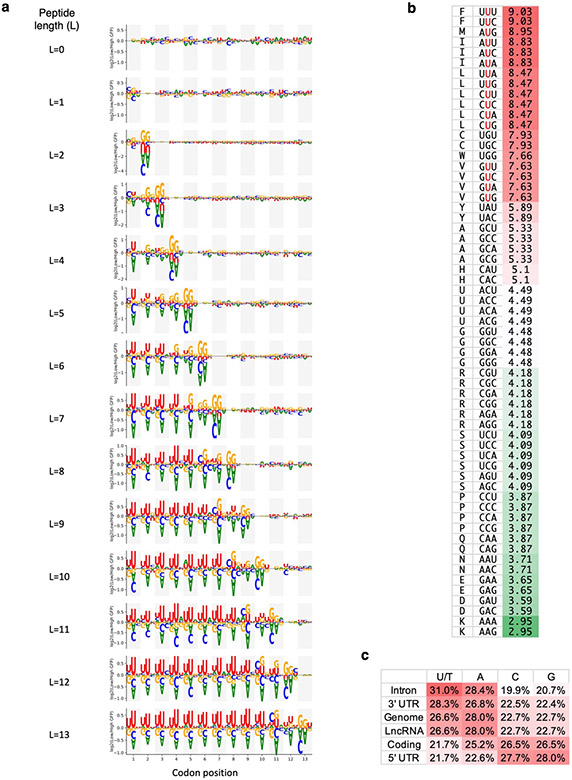
To understand why noncoding sequences tend to encode more hydrophobic amino acids, we examined the association between nucleotide composition and reporter expression in the Pep30 and Pep13 libraries. Strikingly, we observed a 3-nt periodicity of U-enrichment in sequences associated with low EGFP expression in the Pep30 library, with U-enrichment peaking at the center position of each codon (Fig. 3a). There is a progressive decline of U-bias from the 5’ to 3’ end, which disappears when sequences with premature in-frame stop codons are removed (Fig. 3a, bottom), suggesting that the 3-nt periodicity of U-enrichment is translation dependent. The dependency on the stop codon is more evident in the Pep13 library: the periodic enrichment of U ends three codons before the stop codon, and no significant nucleotide bias can be observed after the stop codon (Fig. 3b, more details in Extended Data Fig. 4a). The three codons immediately upstream of the stop codon strongly enrich for codons encoding C-end degrons (Arg/Gly).
Fig. 3 ∣. A bias in the genetic code links instability and hydrophobicity with U-content.
a, Nucleotides enriched/depleted in reporters of low EGFP expression in the Pep30 library using all sequences (left) or only sequences encoding a full-length 30aa peptide (right). Nucleotides height scaled by log10 transformation of two-sided Mann-Whitney U test P values. b, A heatmap color-coding the log2 ratio of U frequency between Pep13 sequences in GFP-low bin vs. GFP-high bin for each nucleotide and codon position (column) and peptide length (L, row). Color bar: from −1 (blue) to +1 (red). Gray bar indicates positions of stop codons. Relative frequency of all four bases for L=10 (stop codon at codon position 11) are shown on the right. c, Probability logo showing enriched and depleted nucleotides in codons of hydrophobic amin acids in the genetic code. P values were computed using two-sided Mann-Whitney U tests.
The association of low reporter expression with both hydrophobicity and U-rich codons suggests that hydrophobic amino acids are encoded by U-rich codons, especially with U at the center position of the codon. Indeed, this is the case (Fig. 3c). In fact, all 16 codons with U at the center code for highly hydrophobic amino acids (Extended Data Fig. 4b). The strong reading frame-specific association of U content with hydrophobicity in the genetic code potentially contributes to the decreased stability of frameshifted coding sequences (Fig. 2c).
While the association between U-rich codons and hydrophobic amino acids has been known since 197935, the biological significance remains unclear. Because canonical coding sequences have evolved to be GC-rich / AT-poor relative to the AT-rich genomic background, sequences outside of functional coding regions are thus T/U-rich and will tend to code for more hydrophobic residues. Indeed, we found a strong agreement between U-content, C-terminal hydrophobicity, and low reporter expression across different genomic regions. For example, introns have the highest U-content (31.0%, Extended Data Fig. 4c), the highest C-terminal hydrophobicity (Fig. 2f), and the lowest reporter expression (Fig. 2c), whereas 5’ UTRs have a U-content comparable to coding regions and are also associated with moderate hydrophobicity. On average, amino acids coded by the AT-rich noncoding genome are 40% more likely to be hydrophobic (FMILCWVY) than the last 30-aa of canonical proteins (37.7% vs. 27.0%). While the absolute difference is moderate for individual residues, what triggers proteasomal degradation is likely the clustering of multiple hydrophobic residues, which scales exponentially with cluster size. For example, a 1.4-fold difference translates into a 10-fold difference for a cluster of seven hydrophobic residues.
Taken together, our massively parallel reporter assays and integrative genomic analysis support a unified model for the mitigation of translation in diverse noncoding sequences: noncoding sequences tend to have high U-content and are therefore more likely to code for hydrophobic residues, resulting in a hydrophobic C-tail that triggers proteasomal degradation. Functional proteins, on the contrary, have evolved to deplete hydrophobic residues near the C-termini.
Surveillance of AMD1 3’ UTR translation
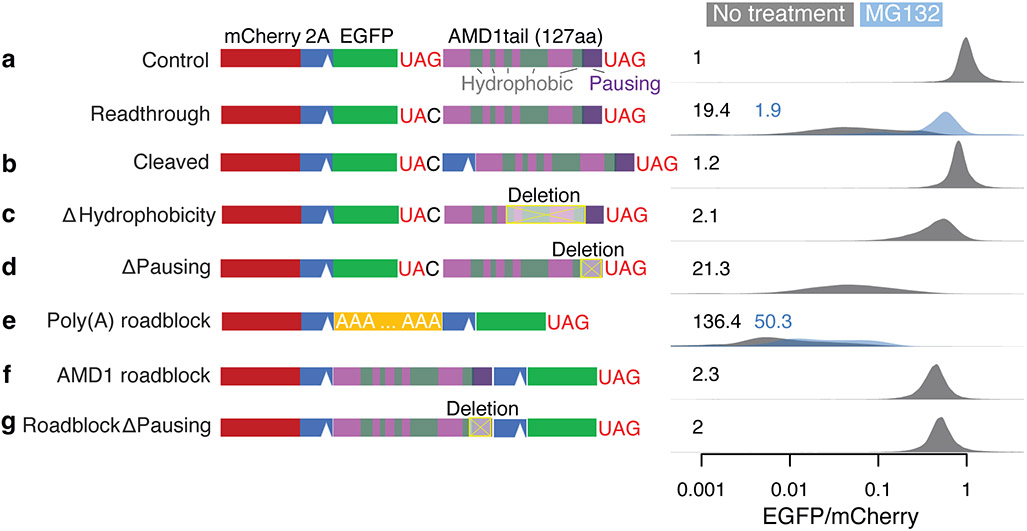
Previously, ribosome stalling and not proteasomal degradation was proposed to explain the surveillance of readthrough translation in the 3’ UTR of AMD116. Ribosomes pause near the in-frame stop codon in the 3’ UTR, and the last 21 codons in the AMD1 3’ UTR ORF (Fig. 4a) were found necessary to induce ribosome pausing in cell-free assays16. It was proposed that ribosome pausing results in a queue of stalled ribosomes covering the entire 3’ UTR and preventing further translation in the 3’ UTR16. However, no ribosome footprints indicative of a ribosome queue in the AMD1 3’ UTR can be observed16,29.
Fig. 4 ∣. AMD1 3’ UTR translation mitigation.
a-g, Reporter constructs shown on the left were transfected into HEK293T cells. The EGFP/mCherry ratio was quantified in individual cells using flow cytometry with distributions shown on the right on a log-10 scale. The number in each plot is the median fold-decrease of the EGFP/mCherry ratio. Data from cells treated with the proteasome inhibitor MG-132 are shown in blue.
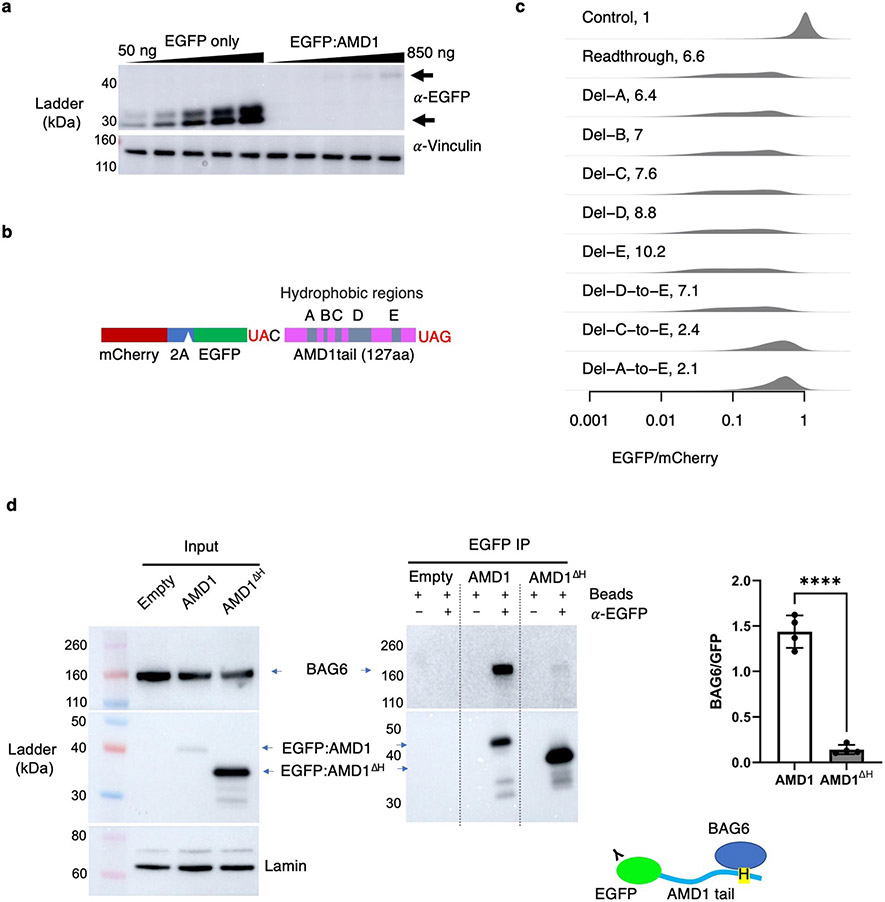
In our reporter system, readthrough translation of the AMD1 3’ UTR led to a 19.4-fold decrease of EGFP/mCherry (Fig. 4a). Western blot confirms the loss of EGFP protein, ruling out EGFP misfolding as the cause of reduced fluorescence in flow cytometry assays (Extended Data Fig. 5a). However, unlike the conclusion from the previous study16, we found that proteasome inhibition by MG132 almost completely rescued the decrease in EGFP/mCherry ratio (from 19.4-fold to 1.9-fold, Fig. 4a), similar to other reporters used in our study. Furthermore, EGFP can be almost completely stabilized by a P2A peptide that results in co-translational cleavage of the AMD1 peptide from EGFP (Fig. 4b), a rescue that cannot be explained by the ribosome queueing model. We identified multiple hydrophobic regions within the 127-aa AMD1 peptide that may serve as the degron (Fig. 4a). While no rescue was observed when deleting individual hydrophobic regions (Extended Data Fig. 5b-c), a substantial rescue was observed when the three most C-terminal hydrophobic regions were deleted simultaneously while retaining most of the ribosome pausing signal (Fig. 4c). These results suggest that the hydrophobic regions act redundantly to mediate degradation of the AMD1 peptide.
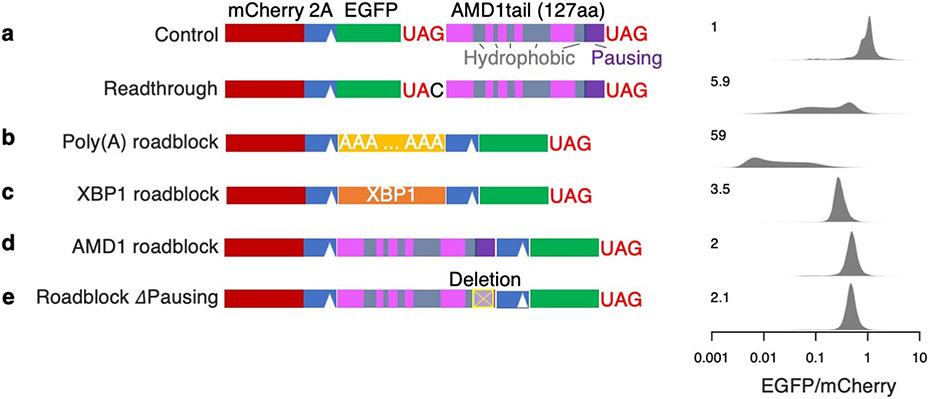
Importantly, deleting the ribosome pausing sequence (the last 21 codons) in the reporter failed to rescue the loss of EGFP (Fig. 4d). To directly test whether the AMD1 3’ UTR sequence can act as a roadblock for ribosomes, we adapted a tricistronic reporter system previously used to assess ribosome stalling by a poly(A) sequence36. Specifically, a poly(A) sequence (A63) inserted between mCherry and EGFP (separated by T2A and P2A) caused a 136-fold decrease of EGFP relative to mCherry that cannot be rescued with proteasome inhibition (Fig. 4e), consistent with the model that ribosomes stall in the poly(A) region and fail to translate the downstream EGFP. In contrast, replacing A63 with the AMD1 3’ UTR ORF caused only a ~2-fold decrease of EGFP (Fig. 4f), suggesting that unlike A63, most ribosomes experience no difficulty translating through the AMD1 3’ UTR ORF. The 2-fold effect persists after deleting the 21-codon ribosome pausing signal (Fig. 4g, also see replicate in Extended Data Fig. 6), suggesting this effect is attributable to factors other than ribosome stalling, such as incomplete cleavage by T2A and/or ribosome fall-off after the T2A sequence37. Our results thus argue against the formation of a ribosome queue caused by stable ribosome stalling at the AMD1 3’ UTR ORF in cells.
Taken together, our results suggest that similar to other noncoding sequences, the reduced protein output from AMD1 3’ UTR translation is mainly caused by C-terminal hydrophobicity-mediated proteasomal degradation rather than ribosome queueing-mediated inhibition of translation elongation.
BAG6 mediates proteasomal degradation
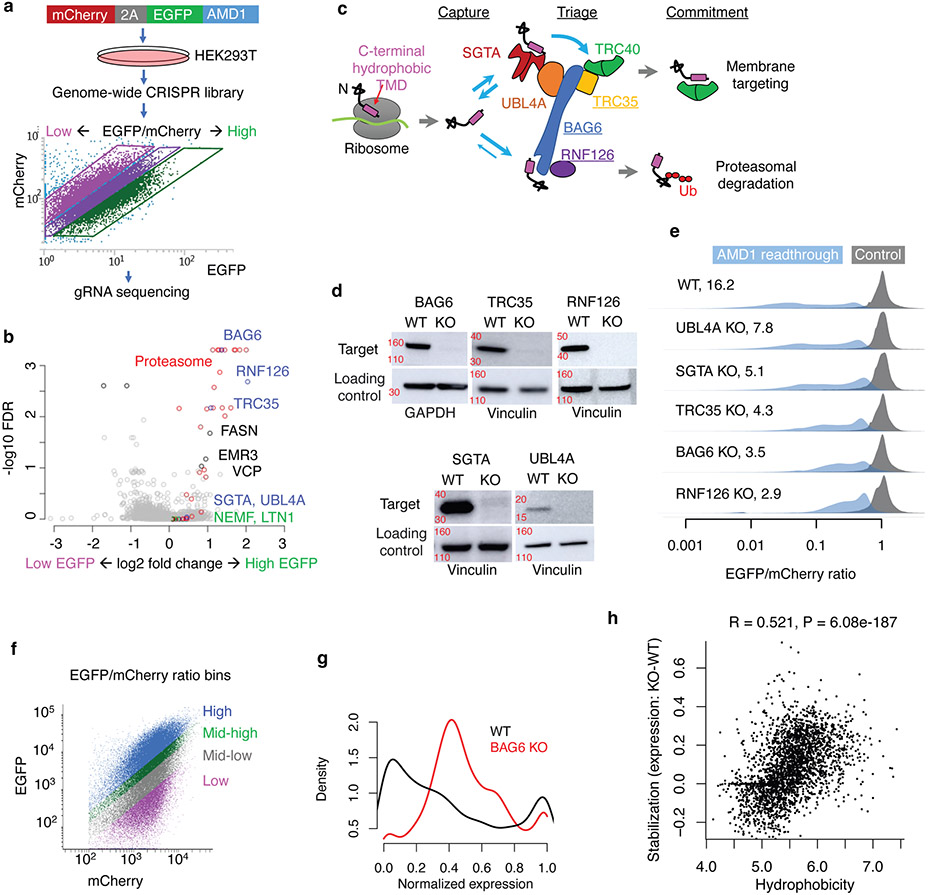
To unravel the molecular pathway that captures noncoding sequence-derived peptides for proteasomal degradation, we performed a genome-wide CRISPR knockout (KO) screen38 using the AMD1 readthrough reporter (Fig. 5a). The unbiased screen unambiguously supported the role of the proteasome: of the genes whose knockout resulted in a rescue (higher EGFP/mCherry ratio), most (17/20) of the top hits (FDR < 0.01) are components of the 26S proteasome in the ubiquitin-dependent protein degradation pathway (Fig. 5b, red). In contrast, none of the genes known to be involved in resolving ribosome stalling, such as the RQC factors NEMF and LTN1, have any impact on the EGFP/mCherry ratio (Fig. 5b, green), again arguing against the role of ribosome stalling and queueing in the mitigation of AMD1 3’ UTR translation. Similarly, knockout of lysosomal genes has no effect on the EGFP/mCherry ratio (Supplementary Table 3).
Fig. 5 ∣. BAG6 pathway mediates proteasomal degradation of noncoding translation products.
a, A CRISPR screen using the AMD1 reporter stably integrated into HEK293T cells. b, Gene-level summary of the CRISPR screen from MAGeCK. c, Schematic of the TRC/GET pathway targeting proteins with a C-terminal hydrophobic region. d, Representative western blots confirming the depletion of TRC proteins in KO cells (N=2 biologically independent samples). GAPDH was used as loading control for BAG6 and vinculin was used for all other proteins. Approximate location of nearest kDa molecular weight markers is shown in red. e, EGFP/mCherry ratio of the AMD1 reporter in WT and KO cells. (N=1). f, WT and BAG6 KO HEK293T cells were transduced with the Pep30 library and sorted into four bins with respect to EGFP/mCherry ratio and then sequenced. g, A density plot of normalized expression of each sequence in WT and BAG6 KO cells. h, A scatter plot of stabilization vs. average hydrophobicity of each tail peptide. Shown are the Spearman correlation coefficient R and the P value of a two-sided Spearman’s correlation test. No adjustments were made for multiple comparisons.
Interestingly, the remaining three top hits with FDR < 0.01, BAG6(BAT3), TRC35(GET4), and RNF126, are all key components of the highly conserved BAG6 pathway for membrane protein triage in the cytosol39-42(Fig. 5c). The BAG6 pathway is embedded as a quality control module in the Transmembrane domain Recognition Complex (TRC) pathway, also called Guided Entry of Tail-anchored proteins (GET) pathway, for the triage of tail-anchored (TA) membrane proteins. TA proteins have a hydrophobic C-terminal tail that functions as a transmembrane domain (TMD) while also serving as the membrane targeting signal. Immediately after being released from the ribosome, TA proteins are captured by the ribosome-associated co-chaperone SGTA, which binds and shields the hydrophobic TMD in nascent TA proteins39-41. SGTA then delivers the substrate to the BAG6-UBL4A-TRC35 heterotrimeric complex via binding to UBL4A. Authentic TA proteins will be transferred directly from SGTA to TRC40, which is associated with the trimeric complex via TRC35, and are then committed to membrane targeting. Defective TA proteins, however, will be released from SGTA and re-captured by BAG6, which recruits the E3 ubiquitin ligase RNF126 that catalyzes the ubiquitination of the substrate, committing it to proteasomal degradation43,44. In addition to acting as an adaptor for TRC40 in the membrane targeting arm of the pathway, TRC35 also blocks the nuclear localization signal on BAG6 and retains BAG6 in the cytosol for protein quality control45.
Three features of the BAG6 pathway make it especially appealing for the surveillance of translation in noncoding sequences. First, the pathway recognizes C-terminal hydrophobic tails, a defining feature of aberrant translation products that is also associated with their degradation (Fig. 2). Second, multiple components of this pathway, including BAG6, TRC35, and SGTA are physically associated with translating ribosomes41,42,46, positioning the complex for rapid surveillance of aberrant translation products before they are released to the cytoplasm. Lastly, the BAG6 complex functions at the intersection of membrane targeting and proteasomal degradation, potentially explaining why most evolutionary young proteins derived from noncoding sequences are preferentially localized to membranes (Supplementary Table 1).
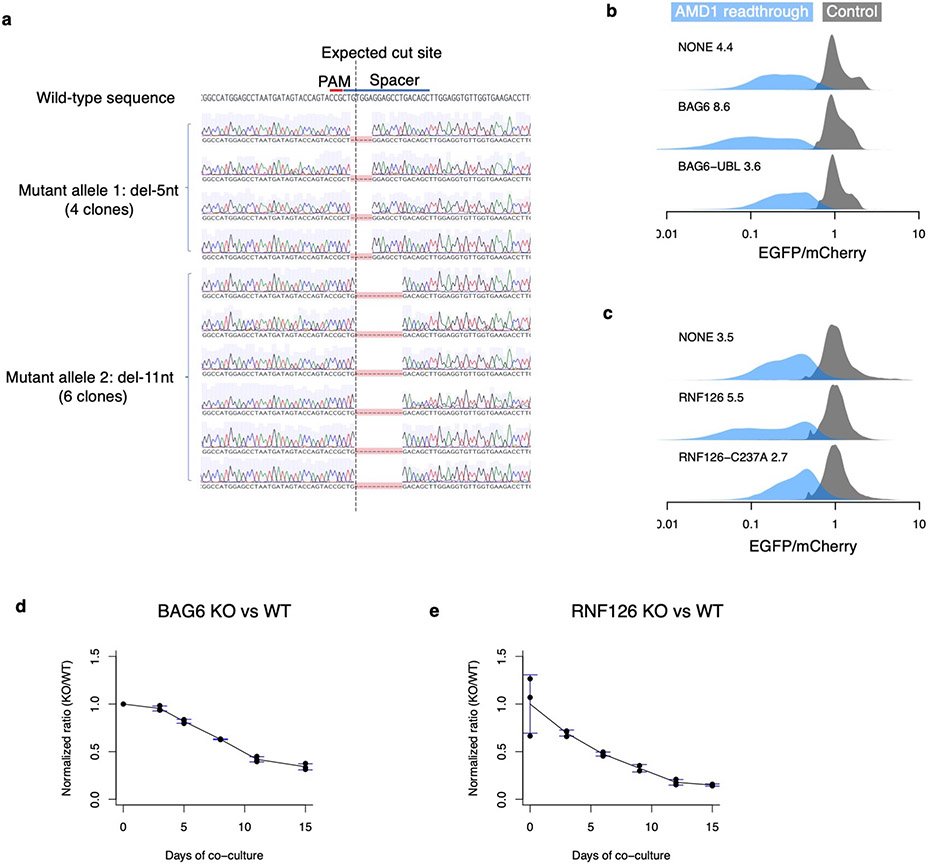
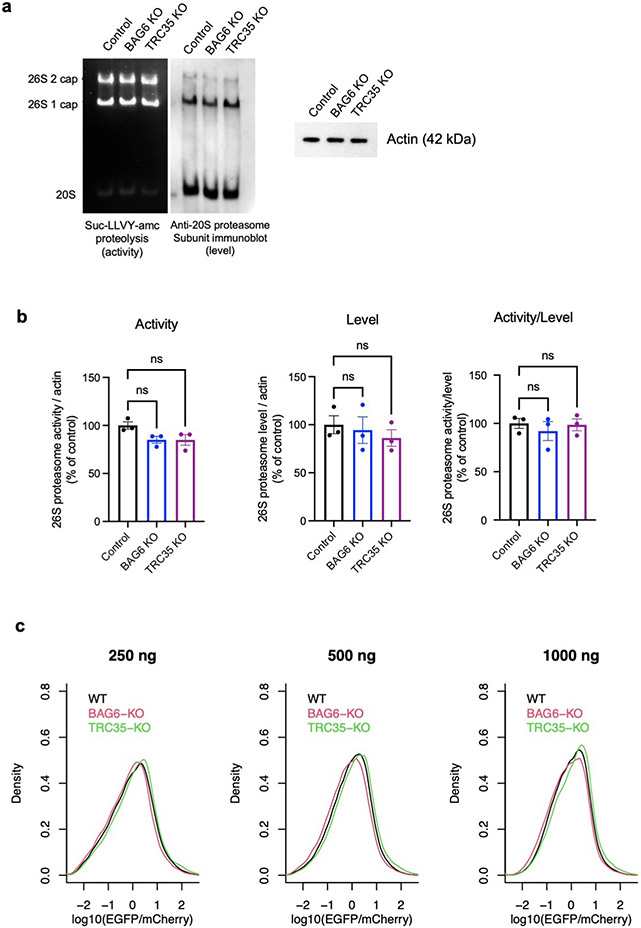
We used CRISPR/Cas9 to generate clonal knockout (KO) HEK293T cell lines for the 3 top hits BAG6, RNF126, and TRC35, as well as for SGTA and UBL4A that were upstream of BAG6 in the pathway but missed by the CRISPR screen (Fig. 5d and Extended Data Fig. 7a). Substantial rescue of the AMD1 readthrough reporter was observed in all knockout cell lines with the strongest rescue in RNF126 and BAG6 KO cells (Fig. 5e). The partial rescue in SGTA and UBL4A KO cells suggests that SGTA and UBL4A were likely false negatives in the CRISPR screen, possibly due to low guide RNA efficiencies. Transient re-expression of wild-type BAG6 or RNF126 but not the corresponding mutant forms partially reversed the KO phenotype on the AMD1 reporter (Extended Data Fig. 7b-c). BAG6 and RNF126 KO cells are viable but grow significantly slower than wild-type cells in a co-culture assay (Extended Data Fig. 7d-e). Proteasome assembly and activity are not affected in knockout cells (Extended Data Fig. 8), ruling out the alternative model that BAG6 indirectly affects reporter level via its impact on proteasome assembly47. BAG6 co-immunoprecipitated with the EGFP-AMD1 fusion protein, an association almost completely lost when the hydrophobic region required for degradation was deleted (Extended Data Fig. 5d). Taken together, our genetic and biochemical analyses of the AMD1 reporter support a model where BAG6 binds C-terminal hydrophobic regions in substrates and results in proteasomal degradation.
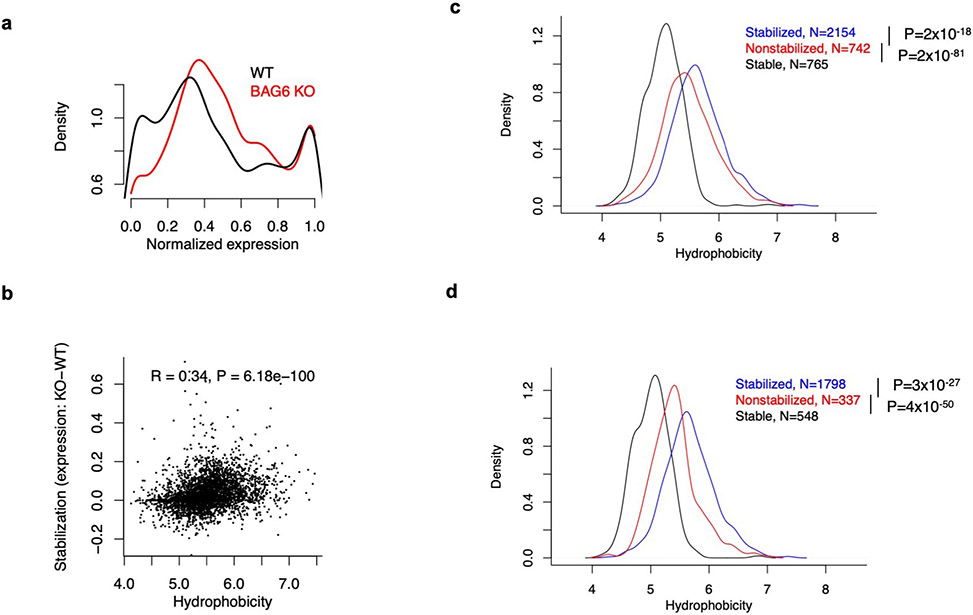
To systematically test the role of BAG6 in mediating the proteasomal degradation of aberrant translation products from diverse noncoding sequences beyond the AMD1 tail, we repeated the Pep30 high-throughput reporter assay in both wild-type and BAG6 KO cells (Fig. 5f). To increase the sensitivity of detecting changes, we sorted cells into four bins based on their EGFP/mCherry ratio and calculated a normalized expression value for each sequence using read counts in the sorted bins (Methods). A large fraction of the sequences showed an increase of expression in BAG6 KO cells (Fig. 5g), indicating BAG6 mediates the degradation of many noncoding translation products. Importantly, the extent of rescue by BAG6 KO is correlated with the average hydrophobicity of the tail sequence (Fig. 5h, R=0.52, P = 2x10−187), consistent with a model where BAG6 binds hydrophobic C-terminal tails and mediates proteasomal degradation. The results in Fig. 5g-h are confirmed in a biological replicate (Extended Data Fig. 9).
Taken together, our genome-wide screen and systematic follow-up validations uncovered an unexpected role of the BAG6 membrane protein triage pathway in mediating proteasomal degradation of diverse noncanonical ORF translation products.
Cancer mutants as endogenous substrates
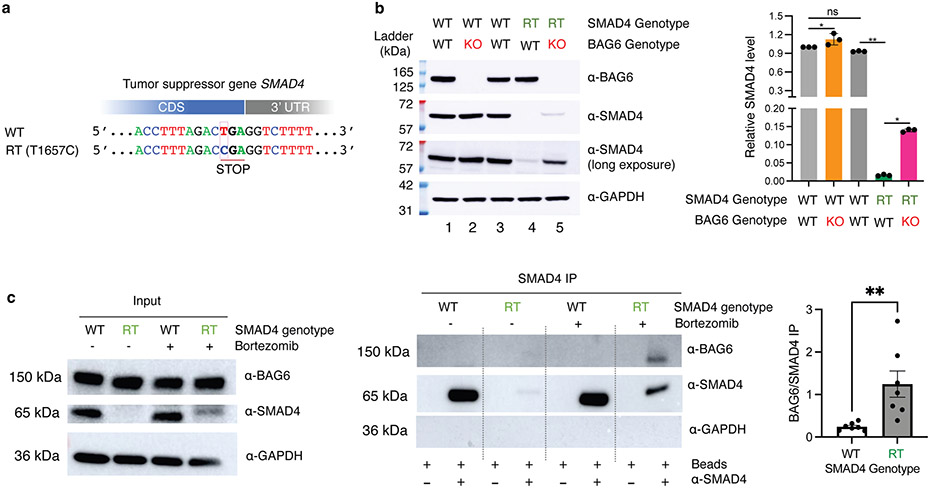
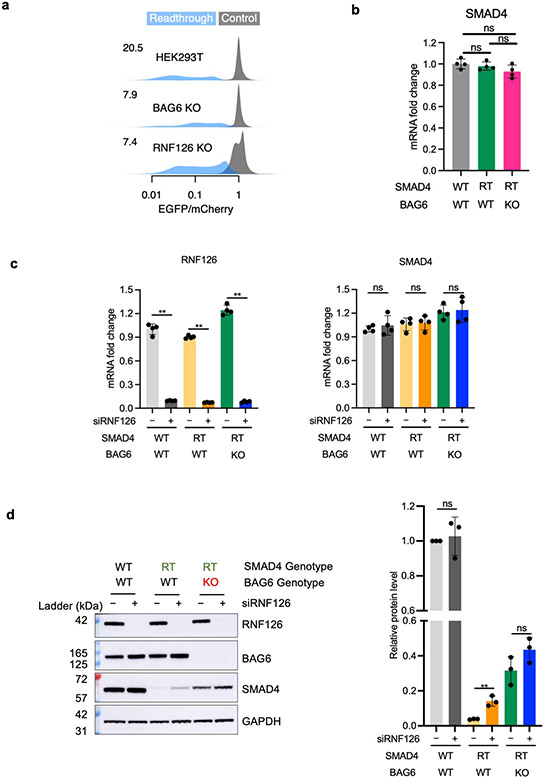
Recurrent mutations identified from the COSMIC cancer mutation database disrupt the stop codons of more than 400 cancer-associated genes resulting in translation into their 3’ UTRs, including in the tumor suppressor gene SMAD410 (Fig. 6a). Consistent with our model, the SMAD4 3’ UTR encodes a short hydrophobic sequence which leads to proteasomal degradation of the SMAD4 readthrough product10. Utilizing our dual color reporter system, we confirmed that fusing SMAD4 3’ UTR encoded peptide to EGFP resulted in a substantial (20.5-fold) loss of EGFP fluorescence, which was partially rescued in BAG6 KO cells (Extended Data Fig. 10a). Using a previously generated HEK293T cell line carrying a homozygous SMAD4 readthrough mutation T1657C10, we confirmed that the endogenous SMAD4 readthrough protein is almost completely degraded (Fig. 6b, lane 4). We further derived a clonal BAG6 KO cell line from the SMAD4 T1657C readthrough cell line and found that the endogenous SMAD4 readthrough protein can be stabilized by BAG6 knockout (Fig. 6b, lane 5) without an increase of SMAD4 mRNA abundance (Extended Data Fig. 10b). Depleting RNF126 similarly resulted in a rescue of both the reporter and endogenous SMAD4 readthrough (Extended Data Fig. 10). BAG6 was co-immunoprecipitated with endogenous SMAD4 readthrough protein but not wild type SMAD4, despite the wild-type protein being much more abundant (Fig. 6c). Taken together, these results show that in addition to exogenously expressed reporters, the BAG6 pathway also mediates the degradation of endogenous readthrough proteins, such as SMAD4 readthrough via binding to the 3’ UTR coded hydrophobic C-terminal tail. Our results uncover details of a new mechanism for how tumor suppressor genes are inactivated in cancer.
Fig. 6 ∣. SMAD4 readthrough as endogenous substrate of BAG6.
a, The mutation T1657C disrupts SMAD4 stop codon and results in readthrough (RT) translation in the 3’ UTR. b, The SMAD4 readthrough protein is barely detectable in BAG6 wild-type (WT) cells (lane 4) but is stabilized in BAG6 KO cells (lane 5). RT: readthrough with homozygous T1657C mutations. Lane 1: parental WT cells for BAG6 KO. Lane 3: parental WT cells for SMAD4 RT. Bottom: quantification, N=3 biologically independent samples. Data are presented as mean values +/− s.d. c, BAG6 co-IP with SMAD4 readthrough products. Bortezomib: proteasome inhibitor. N=7 biologically independent samples. Data are presented as mean values +/− s.d. Two-sided Student’s t-test was used to calculate P values. No adjustments were made for multiple comparisons. *: P < 0.05; **: P < 0.01.
Discussion
We have combined massively parallel reporter assays, genome-wide CRISPR screens, integrative genomic analysis, as well as in-depth genetic and biochemical dissections to uncover a mechanism underlying the surveillance of widespread translation in diverse noncoding sequences in human cells. Noncoding sequences, i.e., lncRNAs, 5’ UTRs, 3’ UTRs, and introns, are heterogeneous in biogenesis, sequence, and structure. It has thus far been unclear whether a common mechanism is used for the surveillance of unintended translation in such diverse sequences. Our data suggests that there are at least two common features: compositional bias (U-richness/hydrophobicity) and positional bias (C-termini), that together distinguish polypeptides translated from noncoding sequences to that of functional coding sequences.
Proteasomal degradation of intracellular proteins generates short peptides that will be presented as MHC I antigens on the surface of almost all animal cells. Antigen presentation allows T cells to detect cancer cells and cells infected by viruses. It has been proposed that up to 30% of newly synthesized proteins are rapidly degraded and presented on MHC I complexes, allowing rapid detection of viral infections48. The nature of these short-lived defective ribosomal products (DRiPs) and what triggers their rapid degradation remain elusive. A previous study shows that BAG6 is associated with newly synthesized poly-ubiquitinated polypeptides and that BAG6 knockdown impairs MHC I antigen presentation49, implicating BAG6 substrates as a source of rapidly presented antigens. By uncovering diverse noncoding translation products as BAG6 substrates, our results suggest that BAG6-mediated degradation of noncoding translation products provides an important source of antigens and potentially underlie the dominance of noncoding-derived peptides in tumor-specific antigens. Our result is also consistent with a previous study suggesting hydrophobicity as a driver of MHC I antigen processing50. The BAG6 pathway thus represents a potential node of regulation and drug target for tuning the visibility of cancer cells to the immune system.
The unexpected discovery that polypeptides translated from noncoding sequences are fed into a membrane protein biogenesis and triage pathway has important implications for understanding the impact of aberrant translation on cell functions and gene evolution. The discovery raises the possibility that the influx from aberrant translation may interfere with the biogenesis and quality control of tail-anchored proteins, especially in the context of cancer, neurodegeneration, and aging, where there is a global increase of aberrant translation. On the evolutionary timescale, in addition to lncRNA-derived peptides, alternative splicing and polyadenylation isoforms of known coding genes may also evolve new functions on membranes, allowing for specializations of existing functions on membranes. The BAG6 pathway may play a key role in balancing protein quality control over physiological timescales and innovation of new proteins over evolutionary timescales.
In addition to the BAG6 pathway that we have validated, our genome-wide screen also suggests potential alternative mechanisms for the surveillance of translation in noncoding sequences. These alternative mechanisms, potentially activated in the absence of the BAG6 pathway in KO cells, may explain the partial rescue of AMD1 and SMAD4 readthrough translation and the existence of Pep30 sequences that are insensitive to BAG6 KO. We envision that the resources generated here, including the CRISPR screen, BAG6-independent Pep30 sequences, and knockout cell lines will facilitate future studies in uncovering new mechanisms for the surveillance of translation in noncoding sequences.
METHODS
Plasmids
HSP90B1, ACTB, GAPDH, and SMAD4 reporters: the 3’ UTR of HSP90B1, intron 3 of ACTB, the last intron of GAPDH, and the 3’ UTR of SMAD4 were PCR-amplified from the genomic DNA of HEK293T cells with primers listed in Supplementary Table 4. The PCR products were then either digested with NotI and SbfI (GAPDH and SMAD4) or NsiI-HF/PspOMI (ACTB and HSP90B1), which generate the same overhangs. The inserts were then ligated with NotI/SbfI-digested pJA291 (Addgene #74487)18.
AMD1 reporters: The AMD1 readthrough reporter was generated by inserting genomic DNA-amplified fragment into pJA291 using NotI/SbfI sites. Overlap extension PCR (OEP) cloning was used to insert a P2A sequence between EGFP and the AMD1 tail in the readthrough reporter. Systematic deletion of individual or combinations of hydrophobic regions from the readthrough reporter were done using NEB Q5 Site-Directed Mutagenesis (SDM) Kit (#E0554). The AMD1 roadblock reporter was generated using OEP cloning. OEP cloning was again used to delete the putative ribosome pausing signal from the roadblock reporter or replace the AMD1 sequence with a poly(A) sequence or the XBP1 stalling sequence. Deletion of the ribosome stalling signal from the readthrough reporter was also generated by OEP cloning. XBP1 stalling sequence was amplified from Addgene plasmid #159583 with Phusion PCR kit (New England Biolabs, # M0530S).
Representative noncoding sequence reporters: six noncoding sequences from the Pep30 library (KRT2 intron, APOL4 intron, ASPAY 3’ UTR, IFT81 3’ UTR, LINC00222, and LINC02885) were selected and cloned into either the original mCherry-EGFP bicistronic Pep30 reporter, fused to the C-terminal of HA-tagged dPspCas13b protein (Addgene plasmid #103866), or fused to the C-terminal of human ribosomal protein L3 (RPL3). The noncoding sequences were amplified from the Pep30 library with primer pairs carrying restriction site pairs to be used for cloning. The following pairs of restriction sites were used for each of the three reporter backbones: NotI/SbfI for mCherry/EGFP bicistronic reporter pJA291, and AscI/EcoRI for both dPspCas13b and RPL3 reporters.
CRISPR guide RNA plasmids: The parental lentiCRISPR v2 plasmid (Addgene # 52961) was digested with BsmBI and purified using the NucleoSpin Gel and PCR Clean-up kit (Macherey-Nagel). Forward and reverse oligos containing the guide sequence of interest were phosphorylated and annealed and ligated into the parental plasmid with T4 PNK and T4 DNA ligase. Targeting and non-targeting guide sequences are derived from the CRISPR KO library described previously38.
All plasmids were transformed into NEB Stable Competent E. coli (C3040) according to the manufacturer’s protocol. Positive clones were confirmed via sanger sequencing. All primers used for cloning and sanger sequencing are listed in Supplementary Table 4.
Cell culture
HEK293T cells used in this study were purchased from ATCC and have not been authenticated by our laboratory. Cells were cultured in DMEM with 4.5 g/L D-Glucose supplemented with 10% fetal bovine serum, 1% penicillin/streptomycin was added except when producing lentivirus. Low passage number cells were used and maintained under 90% visual confluency. Cells were maintained at 5% CO2 and 37 °C. HEK293T cells used in this study were confirmed to be negative for Mycoplasma Contamination and routinely tested using the MycoAlertTM Mycoplasma Detection Kit (Lonza, LT07-418). For experiments involving the SMAD4 gene, clonal cell lines harboring SMAD4 readthrough mutations as well as the parental HEK293T cells were obtained as a generous gift from Dr. Sven Diederichs. Transfection of plasmids was done using Lipofectamine 2000 or Lipofectamine 3000 according to the manufacturer’s instructions. Flow cytometry analyses of transfected cells were typically performed 24 or 48 hours after transfection.
RNF126 knockdown
HEK293T cells were seeded in 6-well plate with 2.5 x 10⁵ cells per well. Cells were transfected the next day with either 25 pmol siControl (Horizon Discovery, D-001810-10-05) or 25 pmol siRNF126 (Horizon Discovery, L-007015-00-0005) using lipofectamine RNAiMAX. Target sequences of the siRNA RNF126-targeting pool are as follows: UGUCUAACCUCACCCUCUA, CAUCACACAGCUCCUCAAU, CGGAUUAUAUCUGUCCAAG, GAACAAAACUGCUCCAACA. Target sequences of the non-targeting control pool are as follows: UGGUUUACAUGUCGACUAA, UGGUUUACAUGUUGUGUGA, UGGUUUACAUGUUUUCUGA, UGGUUUACAUGUUUUCCUA. Cells were harvested for western blot after 48 hours. Western blot was performed three times and was quantified using ImageJ software. Statistic data was generated with Prism 9, and Student’s t-test was performed to calculate the P value.
Lentivirus and stable cell line generation
For generating lentivirus, 750,000 HEK293T cells were seeded in 6-well plates with DMEM supplemented with 10% FBS. After 24 hours, the cells were transfected with the second-generation lentiviral packaging plasmids as well as the lentiviral plasmid of interest using Lipofectamine 3000. The virus-containing media was collected 48 and 72 hours after transfection, combined, clarified by centrifugation at 500 RCF for 5 minutes, and then passed through a 45 μM PVDF filter. The purified virus was stored at 4°C for short term use or aliquoted and frozen at −80°C. For the generation of stable cell lines, HEK293T cells were reverse transduced in 6-well plates in media with 10 μg/mL polybrene using purified virus such that <30% of the cells are transduced. 24 hours after transduction, the virus-containing media is removed, and fresh media added. After another 24 hours, the cells are collected, and transduction efficiency is confirmed via flow cytometry. Transduced cells are then selected with puromycin at 2 μg/mL for 48 hours or via flow cytometry to generate a stable cell line for downstream analysis.
Generation of knockout cell lines
HEK293T cells (7.5 x 10⁵) were seeded in 6-well plates and transfected the next day with 4 μg of the lentiCRISPR v2 plasmid (Addgene #52961) containing a sgRNA sequence specific to the targeted gene. After 24 hours, cells were passaged into media containing 2 μg/mL puromycin. After two days of puromycin selection, cells were collected, and single cells were sorted into 96-well plates. Individual clones were allowed to grow for 1-4 weeks and then passaged into 6-well plates. Clones were then screened for frameshift mutations in both alleles in the target gene using sanger sequencing and the ICE CRISPR analysis tool. Full knockout of the target genes was then verified using western blotting. Additionally, for BAG6 KO cells, the target locus was PCR-amplified and cloned into plasmids. Sanger sequencing of ten clones were confirmed two frameshifting alleles, one with a 5-nt deletion, and the other with a 11-nt deletion.
Competitive growth assay
Wild-type HEK293T and BAG6 (or RNF126) knockout cells were seeded at 2 million cells each into 10-cm plates with complete growth media. After 72 hours, cells were collected from both plates, passed through a 35 μM mesh cell strainer and quantified on a Countess II automated cell counter. The wild-type and knockout cells were then mixed in a 1:1 ratio and plated into three 10-cm plates. The cell mixtures were then cultured for an additional 15 days with genomic DNA collected about every three days. The gRNA target region was amplified from the genomic DNA from all samples using Q5 High-Fidelity Master Mix and subsequently purified using a NucleoSpin Gel and PCR Clean-up kit from Macherey-Nagel. The purified samples, including those from WT only or KO only cells, were sent for sanger sequencing. The proportion of WT and BAG6 knockout cells in each sample was decomposed using a custom script adapted from TIDE51. The ratio of KO/WT cells at each time point were then computed and plotted.
Flow cytometry analysis
Cells were collected and resuspended in 1-4 mL of fresh media and passed through a 35 μM mesh cell strainer immediately prior to flow cytometry. Flow cytometry was performed on either a Bio-Rad ZE5 or NovoCyte Quanteon analyzer. Gating of samples and export of data for downstream analysis was done using the FCS Express software.
RT-qPCR
SMAD4 mRNA expression in SMAD4 mutant and BAG6 KO cells. Stable cells were collected for RNA extraction, and RT-qPCR was performed to measure mRNA relative expression. Statistic data was generated with Prism 9, and Student’s t-test or One-way ANOVA test was performed to calculate the P value. SMAD4 mRNA expression in RNF126 knockdown cells. HEK293T cells were seeded in 6-well plate with 2.5 x 10^5 cells per well, and transfected was performed next day. 25 pmol siControl (Horizon Discovery, D-001810-10-05) and 25 pmol siRNF126 (Horizon Discovery, L-007015-00-0005) were transfected with lipofectamine RNAiMAX, after 48 hours, cells were harvested for RNA extraction. RT-qPCR was performed to measure mRNA relative expression. Statistic data was generated with Prism 9, One-way ANOVA test was performed to calculate P value.
Generation of the Pep30 and Pep 13 reporter library
For the Pep30 library, a pool of 12,000 oligos were synthesized by Twist Bioscience, each containing a 90-nt variable sequence flanked by a 15-nt constant sequence on each side. The left constant sequence TACTGCGGCCGCTAC carries a NotI site, whereas the right constant sequence TGACTAGCTGACCTG contains stop codons in all 3 reading frames, followed by a SbfI site (extended into the vector backbone) for cloning. The variable sequences were picked from a set of randomly selected lncRNAs52, as well as the following regions in coding mRNAs (RefSeq): the 5' end of internal coding exons (not the entire CDS), introns, 3' UTRs, 5' UTR ORFs, and the 3' end of the last coding exon. Regions annotated to multiple classes or overlapping with each other on either strand were discarded. For introns and 3’ UTRs, the first 90 nt was used. For lncRNAs and 5’ UTRs, the first AUG was identified, and the next 90 nt were used. For C-termini of CDS, the last 90nt of the ORF (excluding the stop codon) were used. For internal CDS, the first 90 nt of individual internal coding exons were used, with about one third being in-frame with the EGFP ORF. The oligo pool was PCR-amplified and then cloned into pJA291 using the NotI/SbfI sites and primers listed in Supplementary Table 4. The Pep13 library was cloned into pJA291 using the NEB Q5 Site-Directed Mutagenesis Kit (#E0554) and two oligos listed in Supplementary Table 4. The forward oligo contains 39 random bases (IDT standard mixed base N).
Massively parallel reporter assays in HEK293T cells
The Pep30 and Pep13 libraries were used to generate stable cell libraries of HEK293T using lentiviral transduction such that each cell was integrated with at most one virus. Cells were then sorted into two bins: EGFP-high (top 30%, ~15 million cells) or EGFP-low (bottom 20%, ~10 million). Genomic DNA was isolated using QIAamp DNA Mini Kit from QIAGEN. The variable regions of the reporter were then PCR amplified using Phusion HF DNA polymerase (24 cycles). Gel purified PCR products were sequenced using Illumina HiSeq 2000. Reads for each reporter sequence were counted directly from fastq files using the command “zcat $sample.fastq.gz ∣ awk ‘NR % 4 == 2’ ∣ sort ∣ bedtools groupby −g 1 −c 1 −o count > $sample.counts.txt”. The expression of each reporter sequence was calculated as the log2 read count ratio in EGFP-high bin relative to EGFP-low bin. The script used to generate Figure 2 can be found in the Github depository.
Pep30 and Pep13 library: nucleotide level analysis
Pep30 library sequence diversity: pairwise hamming distance (number of nucleotide difference) between any two sequences in the library was calculated and for each sequence, we then identify the shortest distance to any other sequence in the library. As a comparison, the same analysis was performed in a shuffled Pep30 library where each Pep30 sequence was shuffled while preserving mononucleotide frequency. Pep30 library 3-nt periodicity of U-bias: for reporter sequences with more than 100 reads (high-GFP and low-GFP combined, 10,434 of 12,000 sequences), an enrichment score in the low-GFP bin was calculated as the log2 ratio of read counts between the low-GFP bin and the high-GFP bin. kpLogo was then used to perform Wilcoxon rank-sum tests evaluating whether the presence of a particular nucleotide at each position is associated with a higher enrichment score. A logo plot was generated using Logomaker53 in which the height of each nucleotide at each position was scaled by −log10(P value). Pep13 library 3-nt periodicity of U-bias: we obtained 21,020,499 reads from 2,353,836 unique random 39-nt sequences in GFP-high cells, and 31,388,971 reads from 3,178,572 unique sequences in GFP-low cells. Sequences were translated in silico to determine peptide length and then grouped by peptide length (L). Each group contains more than 400,000 reads. For each peptide length group (L from 0 to 13), the fraction of A/C/G/U nucleotides at each position was calculated (unique sequences weighted by read counts) for GFP-high and GFP-low samples separately. The log2 ratio of nucleotide frequency was then used to generate sequence logo plots using Logomaker.
Massively parallel reporter assays comparing WT and BAG6 KO HEK293T cells
HEK293T as well as a clonal BAG6 knockout cell line were reverse transduced with the Pep30 library such that less than 30% of cells were transduced (thus are most likely a single integration per cell). The virus-containing media was removed after 24 hours and fresh media with 10% FBS and 1% PenStrep was added to the plates. After another 24 hours, transduced cells were purified based on their expression of mCherry. The transduced populations were returned to culture and allowed to grow out for an additional 6 days, with passaging as necessary to maintain confluence below 80%. After 6 days, both populations were sorted into 4 bins based on the ratio of EGFP/mCherry expression (High, mid-high, mid-low, and low) using a FACSAria cell sorter. The same mCherry/EGFP ratio gates were used for both WT and BAG6 KO cells. Sorted cells were spun down at 500 RCF for 5 minutes, washed once with 1000 uL PBS, spun down again, then frozen at −20 as a cell pellet. Genomic DNA was subsequently isolated from the cell populations using a Machery Nagel Nucleospin Tissue kit and genomic DNA was eluted in 50 uL of elution buffer. Libraries were then amplified using PCR with custom Illumina adapters, using Q5 high-fidelity PCR mix with 1000 ng input gDNA per sample. Libraries were amplified for a total of 24-27 cycles. After amplification, libraries were cleanup up using SPRISelect beads at a ratio of 0.7x. Purified library size was confirmed via gel and libraries were quantified using the KAPA qPCR Illumina library quantification kit. Libraries were subsequently pooled in a ratio based on the number of total cells collected from each sample. The pooled library was sequenced on a NextSeq 550 with 2.5% PhiX spike in, using the 75-cycle high-output kit with 80 cycles in read 1 and 8 cycles in index read 1. Reads were aligned to a custom index for the Pep30 library generated with the command bowtie-build in bowtie version 1.2.3 and the option −v 3 --best (best alignment with up to 3 mismatches). The counts of each Pep30 sequence were extracted from the alignment with the bash command cut −f 3 ∣ sort ∣ uniq −c. For each sequence, a normalized expression value was calculated using its counts in all four bins. Briefly, we first calculated the slope of read count changes from low, mid-low, mid-high, to high EGFP/mCherry bins. Sequences with more reads in lower ratio bins will have a more negative slope, whereas sequences with more reads in higher ratio bins will have a more positive slope. We then used an inverse logit transformation to convert the slope to a normalized “expression” value between 0 and 1. Only sequences encoding a full-length 30aa peptide and have at least 3000 total reads (combining all 4 bins) were used in the analysis.
Genome-wide CRISPR screen
The Human Activity-Optimized CRISPR Knockout Library (3 sub-libraries in lentiCRISPRv1) was obtained from addgene (#1000000100) and prepared according to the standard protocol. Library lentivirus was produced using Mirus LT1 transfection reagent and second-generation packaging plasmids. 9.2x10⁷ HEK293T cells carrying the stable AMD1-EGFP reporter were reverse transduced with the CRISPR library with 8 μg/mL polybrene. Media was changed 24 hours after transduction. Selection with 2 μg/mL puromycin was initiated 48 hours after transduction. After 48 hours of puromycin selection, cells were collected and sorted, sorted cell populations were frozen at −80 °C. Libraries were prepared for Illumina sequencing from the sorted cell populations as described in Joung et. al., 2017. Libraries were amplified for a total of 28 PCR cycles, purified using the Zymo DNA Clean & Concentrator-5 kit, and the correct-sized band was subsequently purified by gel extraction. Fragment sizes of the libraries were confirmed by bioanalyzer and concentrations were determined using the KAPA qPCR library quantification kit. The pooled library was then sequenced on a NextSeq 550 with 86 cycles in Read 1 and 6 cycles in Index Read 1. MAGeCK54 was used to analyze the CRISPR screen result.
Co-immunoprecipitation
HEK293T cells were seeded in 10-cm plates with 3x10⁶ cells per plate. Reporters were transfected into the cells 24 hours after seeding using Lipofectamine 3000. 48 hours after transfection, cells were treated with DMSO (vehicle) or 0.1 μM Bortezomib. After 24 hours of drug treatment, cells were collected, washed twice in cold PBS, and resuspended in lysis buffer (0.025 M Tris pH 7.4, 0.15 M NaCl, 0.001 M EDTA, 1% NP-40 alternative, 5% Glycerol). Lysates were incubated at 4°C with rotation for 30 minutes, centrifuged at 12,000 RCF at 4°C for 20 minutes, and the supernatant was collected. The pulldowns were performed using Novex DYNAL Dynabeads Protein G conjugated with a primary antibody according to the manufacturers protocol. Following coimmunoprecipitation, western blots were performed as described below.
Western blotting
Cells were cultured and transfected where applicable as described above. Cells were collected on ice and washed with cold PBS and subsequently lysed in RIPA buffer supplemented with a 1X protease inhibitor cocktail for 30 minutes at 4 °C on a rotator. Lysates were then cleared by centrifugation at 16,000 RCF and 4 °C for 20 minutes. Protein concentrations were determined using a BCA assay and samples were then prepared using LDS sample buffer supplemented with sample reducing agent and heated to 70 °C for 10 minutes. Samples were then run on an SDS-PAGE gel and transferred to an activated PVDF membrane for 90 minutes at 30 volts or overnight at 10 volts. Membranes were blocked with 5% BSA in PBS-T for 1 hour at room temperature or overnight at 4 °C. Membranes were then cut and incubated with the appropriate primary antibody in blocking buffer supplemented with 0.02% sodium azide for 1 hour at room temperature or overnight at 4 °C. Secondary antibodies were added at a 1:10,000 dilution and incubated for 1 hour at room temperature. Immobilon ECL Ultra Western HRP Substrate was then added to the membranes and blots were visualized using an Amersham Imager 600.
In-gel proteasome activity
Cells were harvested in a buffer containing 50 mM tris-HCl (pH 7.4), 5 mM MgCl2, 5 mM ATP, 1 mM dithiothreitol, 1 mM EDTA, 10 mM NAF (Sodium fluoride), 25 mM β-glycerolphosphate, phosphatase inhibitors, and 10% glycerol, which preserved 26S proteasome assembly. The samples (3 biological replicates per condition: control, BAG6 knockout, and TRC35 knockout) were homogenized and centrifuged at 20,000g for 25 min at 4°C. The supernatant was collected and normalized for protein concentration determined by Bradford assay. Samples (40 μg protein/well) were loaded on 4% nondenaturing gels and run for 190 min at 160V in buffer containing 180 mM boric acid, 180 mM Trizma base, 5 mM MgCl2, 1 mM ATP, and 1 mM dithiothreitol. The gels were incubated for approximately 10 minutes at 37°C in buffer containing 50 mM Tris-HCl, 5 mM MgCl2, 5 mM ATP, 1 mM dithiothreitol, 10% glycerol, and 125 μM of the fluorogenic proteasome substrate Suc-LLVY-amc (Enzo Life Sciences). 26S proteasome activity bands were detected by transilluminator with 365-nm light and photographed by iPhone 10S camera. The same samples used for in-gel proteasome activity were run in parallel for western blotting to determine levels of the 26S proteasome. Samples (60 μg protein/well) were loaded on 4% nondenaturing gels and run under the same conditions as gels for activity. Gels were transferred to 0.2μM nitrocellulose membranes, blocked in 5% milk, and incubated with primary mouse anti-proteasome 20S α1, 2, 3, 5, 6 & 7 subunits monoclonal antibody (1:2000, Enzo Life Sciences) in SuperBlock Buffer (ThermoFisher) overnight at 4°C and secondary anti-mouse antibody (1:3000) in 5% milk for two hours at room temperature. Membranes were developed with enhanced chemiluminescent reagent Immobilon Western HRP substrate and Luminol reagent (Millipore) using a Fujifilm LAS3000 imaging system. Samples (10.5 ug protein/well for actin or 22.5 ug protein/well for ubiquitinated proteins) were also run on NuPAGE 4-12% Bis-Tris gels (Invitrogen) under denaturing conditions and immunoblotted for actin or ubiquitinated proteins using the same procedure above using primary anti-mouse actin antibody (1:7000) or rabbit anti-K48 linkage polyubiquitin antibody (1:2000, Cell Signaling Technologies) and secondary anti-mouse or anti-rabbit antibody (1:3000). ImageJ (http://rsb.info.nih.gov/ij) was used to quantify the signal from 26S proteasome activity (in-gel proteasome activity assay) and 26S proteasome levels (western blot). Relative activities and levels were calculated for each sample and averaged across the four technical replicates for each sample. These values were then normalized by actin levels for each condition. The results were used to compare proteasome level and activity of each of the knockouts relative to the control. Statistical analysis was performed with GraphPad Prism9 using 1-way ANOVA to compare groups. Data are expressed as mean ± standard error of mean for the three biological replicates, with p < 0.05 considered significant.
Correlation between mitigation and physiochemical and structural properties of tail peptides
Secondary structures of each peptide was predicted using S4PRED55, which outputs a vector indicating whether each residue is in an α-helix, β-sheet, or coil. The number of residues in each of the secondary structure motif in a peptide is used to calculate the correlation with mitigation. Protein intrinsic disorder was calculated using the program IUPred3, specially for short disorder analysis without smoothing. The disorder score for each residue in a peptide is added together and the total disorder score is used to calculate correlation with mitigation. All other properties were calculated using the following functions in the R package Peptides56: Average_hydrophobicity: hydrophobicity using the Miyazawa scale57 unless otherwise noted (Extended Data Fig. 2); Hydrophobic moment: hmoment , Amino acid composition (*.AA.count): aacomp, Mass-to-charge ratio: mz, Molecular weight: mw, Net charge: charge, Interaction potential: boman, Instability index: instaIndex, and Transmembrane potential: membpos.
Genome-scale hydrophobicity analysis
We systematically compared C-terminal hydrophobicity of proteins encoded by coding and noncoding sequences (Fig. 2f). The coding sequences (CDS) of annotated proteins were downloaded from Ensembl (Homo_sapiens.GRCh38.cds.all.fa) and translated into proteins using BioPython. Only proteins with more than 200-aa were used for downstream analysis. The cDNA sequences for protein-coding and long noncoding RNA transcripts (lncRNA) were obtained from GENCODE v37. From the coding transcripts the 5’ UTR and 3’ UTR sequences were extracted. For both 5’ UTR and lncRNA, the longest ORF was translated into peptides. For 3’ UTR and introns, the first in-frame stop codon marks the end of the tail ORF and only those with at least 30 codons were used. Noncoding sequence encoded peptides were removed if found in the canonical proteome. For each group, the average hydrophobicity at each position relative to the last amino acid(the most C-terminal) was calculated using the hydrophobicity function in the R package Peptides56. To rule out that the depletion of hydrophobicity is due to the lack of protein domains (which are often hydrophobic), a subset of proteins depleted of annotated protein domains (NCBI CDD: Conserved Domain Database58) in the last 100aa were analyzed.
Correlation between C-tail hydrophobicity and gene age
Gene age was inferred by a previous study34. Briefly, human and mouse genes were assigned to branches of the vertebrate phylogenetic tree based on the presence and absence of orthologs in various species. The age of the genes in a branch is calculated as the middle point of each branch. The average hydrophobicity of the last 30aa of all genes in a branch was calculated using the R package Peptide described above.59
Extended Data
Extended Data Fig. 1 ∣. Translation surveillance of representative noncoding sequences.
a, Noncoding sequences in the HSP90B1 3’ UTR, an ACTB intron, and a GAPDH intron were cloned into the bicistronic reporter system shown in Fig. 1b. b, Density plots for the distribution of EGFP/mCherry ratios as measured by flow cytometry 24 hours after reporter transfection. The median fold loss of EGFP/mCherry ratio relative to control is shown on the top left corner of each density plot. c, Density plot of the EGFP/mCherry ratio for cells transfected with either the control or the ACTB intron reporter, alone or with simultaneous treatment of either proteasome inhibitor (lactacystin) or lysosome inhibitor (chloroquine). The numbers indicate the median fold loss of EGFP/mCherry relative to control. d-f, six noncoding sequences from the Pep30 library (KRT2 intron, APOL4 intron, LINC00222, LINC02885, ASPAY 3’ UTR, and IFT81 3’ UTR) were selected and cloned into either the original mCherry-EGFP bicistronic reporter (d, cloning failed for KRT2), fused to the C-terminus of HA-tagged PspCas13b protein (e, cloning failed for APOL4), or fused to the C-terminus of RPL3 (f, cloning failed for IFT81). d, Same as b for indicated noncoding sequences. e, Equal amount of HA-dPspCas13b-pep30 reporter plasmids were co-transfected with a HA-RfxCas13d plasmid and the protein abundance was assayed by western blotting with an HA antibody. HA-dCas13b fused to human protein eIF4E was used as a control. The abundance of HA-dCas13b-pep30 was quantified by first normalizing to HA-Cas13d then to eIF4E fusion. f, Equal amount of RPL3 reporter plasmids were transfected into HEK293T cells and western blots were performed using an RPL3 antibody, which detects both endogenous RPL3 (lower bands) and the RPL3 reporter protein (upper bands). NT: no transfection control. The level of the reporter protein was first normalized to endogenous RPL3 and then to the RPL3-3xHA sample. N=4 biological replicates.
Extended Data Fig. 2 ∣. Characterization of the Pep30 library.
a, Sequence diversity in the Pep30 library. The pairwise hamming distance (number of nucleotides that are different) between any two sequences (of 90-nt) in the library was calculated. Subsequently for each sequence, we identify the shortest distance to any other sequence in the library. The result showed that the vast majority (98%) of Pep30 sequences are at least 40 nt (out of 90 nt) different from other sequences in the library, with a median distance of 48. This is very close the distribution when the Pep30 library sequences are shuffled (median: 50). The result indicated that our Pep30 library is nearly as diverse as one can get from entirely unrelated sequences. b-d, Effect of proteasome inhibition or lysosome inhibition on the Pep30 library. b, Pep30 cells were treated with proteasome inhibitors for 8 hours and then analyzed with flow cytometry. Ctrl: Pep30 cells without treatment. c, Same as (b) for multiple lysosome inhibitors. d, longer (24h vs. 6h) proteasome inhibition but not lysosome inhibition resulted in more rescue.
Extended Data Fig. 3 ∣. Hydrophobicity analyses in the Pep30 library and the human genome.
a, The correlation coefficient between Pep30 reporter expression and average hydrophobicity calculated using various scales. b, Spearman correlation coefficient (light bar) between various properties of the Pep30 sequences and reporter expression. Dark bar: partial correlation conditioned on average hydrophobicity. c. Same as Fig. 2f with a different hydrophobicity scale (Ponnuswamy instead of Miyazawa). d, Average hydrophobicity for the first 100 aa (N-termini) of annotated proteins (N= 38,933). e, Average hydrophobicity of the C-termini of annotated proteins without any annotated protein domains in the last 100aa (N=8,586). Shown are the Spearman correlation coefficient R and the P value of a two-sided Spearman’s correlation test. No adjustments were made for multiple comparisons.
Extended Data Fig. 4 ∣. Bias in the genetic code drives hydrophobicity.
a, Same as Fig. 3b (right) for all peptide lengths. b, Codons ranked by the hydrophobicity of the corresponding amino acids. c, Nucleotide composition in different types of regions in the human genome.
Extended Data Fig. 5 ∣. AMD1 3’ UTR translation mitigation.
a, Western blot confirming the loss of the EGFP-AMD1 tail fusion protein. HEK293T cells were transfected with varying amount of the AMD1 3’ UTR readthrough reporter plasmid, from 50ng to 850ng. (N = 2 biologically independent samples). b, The AMD1 3’ UTR translation reporter with the hydrophobic region in the AMD1 tail highlighted (A-E). c, Impact of deleting individual hydrophobic regions or larger regions on the EGFP/mCherry ratio. The number in each plot is the median decrease of the EGFP/mCherry ratio relative to controls. d, BAG6 co-immunoprecipitates with EGFP:AMD1 fusion protein but not a mutated fusion protein with the functional hydrophobic region C-to-E deleted (AMD1ΔH). N=4 biologically independent samples over 2 independent experiments for the quantification. Data are presented as mean values +/− s.d. P values calculated using two-sided Student’ t-test. No adjustments were made for multiple comparisons. ****: P < 0.0001.
Extended Data Fig. 6 ∣. Ribosome roadblock effect: comparing the AMD1 tail sequence, poly(A) and the XBP1 stalling sequence.
a-e, Reporter constructs shown on the left were transfected into HEK293T cells. The EGFP/mCherry ratio was quantified in individual cells using flow cytometry with distributions shown on the right on a log-10 scale. The number in each plot is the median fold-decrease of the EGFP/mCherry ratio. Note that AMD1 sequence causes less decrease in EGFP compared to both XBP1 and poly(A) sequences, and even this weak effect is independent of the putative pausing sequence in AMD1.
Extended Data Fig. 7 ∣. Characterization of the BAG6 KO cells and RNF126 KO cells.
a, Genotyping the BAG6 clonal knockout cell line. Sanger sequencing of 10 clones of PCR-amplified genomic DNA confirmed that the BAG6 KO cells contain a frameshift mutation in both alleles, one with a 5-nt deletion and the other with an 11-nt deletion around the expected Cas9 cut site. b, Re-expressing wild type BAG6 but not an inactive mutant missing the UBL domain for recruiting RNF126 (BAG6-UBL) partially reverses BAG6 KO phenotype as measured by the destabilization of AMD1 readthrough product. c, Same as b but comparing wild type RNF126 and an inactive mutant with a C237A mutation in the active site. d-e, Growth defect of BAG6 KO cells (d) and RNF126 KO cells (N=3 biologically independent samples) (e) revealed by competitive growth assays. KO cells and WT cells were mixed and co-cultured for 15 days and the relative cell numbers (KO/WT) at each time point was determined by decomposition of sanger sequencing traces as described in Methods. N=1 for day 0 of BAG6 and N=3 biologically independent samples for all other time points. Data are presented as mean values +/− s.d.
Extended Data Fig. 8 ∣. BAG6 or TRC35 knockout does not affect proteasome activity or level.
a, Representative result from in-gel proteasome activity assay showing proteasome hydrolysis activity (left) and representative immunoblot probing for a subunits levels of the 26S 1- and 2-cap proteasome and 20S proteasome (middle). Cell lysates were run on 4% nondenaturing (native) gels and incubated with fluorogenic Suc-LLVY-amc proteasome substrate to determine relative activities or immunoblotted to determine relative levels. Samples (10.5 μg protein/well) were run separately under denaturing conditions for immunoblot probing for actin as a sample processing control (right). b, The level of 26S 1- and 2-cap proteasome detected by immunoblotting normalized to actin in the same sample (left), densitometric quantification of 26S 1- and 2-cap proteasome in-gel activity normalized by actin in the same sample (middle), and the activity/level ratio (right). Data are expressed mean ± SEM for three biological replicates, where each value represents the activity/level ratio calculated by averaging four technical replicates of activity and level values. One-way ANOVA was used for statistical analysis, with P < 0.05 considered significant. c, Similar result with in vivo proteasome activity reporter assays. The proteasome activity reporter UbG76V-EGFP was co-transfected with mCherry (1:1) into cells and the EGFP/mCherry ratio measured by flow cytometry was used as an indicator of proteasome activity in cells. The distribution the EGFP/mCherry ratio in WT, BAG6 KO, and TRC35 KO cells at 250 ng, 500 ng, and 1000 ng total plasmid were shown.
Extended Data Fig. 9 ∣. Replicating the Pep30 reporter assay in BAG6 KO cells.
The sequencing-based assay shown in Fig. 5f-h was repeated starting from cell sorting. a, Same as Fig. 5g. b, Same as Fig. 5h. c, full-length Pep30 reporter sequences with a minimum of 3000 reads (all four bins combined) were divided into three groups: those that are stable in wild-type cells (normalized expression >0.8), those that are unstable in wild type cells but are stabilized (increased expression) in BAG6 KO cells, and those that are unstable in wild type cells and are not stabilized in BAG6 KO cells. Shown are the density plot of the hydrophobicity of sequences in each group. d, same as c for the replicate shown in Fig. 5. P values were calculated using two-sided Mann-Whitney U test. No adjustments were made for multiple comparisons.
Extended Data Fig. 10 ∣. BAG6 and RNF126 mediate the degradation of SMAD4 readthrough products.
a, A dual color reporter fusing SMAD4 3’ UTR encoded peptide to the C-terminus of EGFP was tested in wild-type HEK293T cells, BAG6 KO cells, and RNF126 KO cells using flow cytometry as a readout. The number on the top left corner of each density plot is the median fold loss of EGFP/mCherry in the readthrough reporter relative to control. b, No significant change of SMAD4 mRNA level with BAG6 KO. RT: readthrough. N=4 biologically independent samples. Data are presented as mean values +/− s.d. c, Efficient RNF126 knockdown and the lack of impact on endogenous SMAD4 mRNA (qRT-PCR). N=4 biologically independent samples. Data are presented as mean values +/− s.d. d, Endogenous SMAD4 readthrough protein is stabilized by both BAG6 KO and RNF126 knockdown. Representative western blots on the left and quantification on the right. N=3 biologically independent samples. Data are presented as mean values +/− s.d. One-way ANOVA was used for statistical analysis, with P < 0.05 considered significant. **: P < 0.01. No adjustments were made for multiple comparisons.
Supplementary Material
ACKNOWLEDGEMENTS
We thank David Bartel for supporting some of the early work on this project. We thank Chaolin Zhang, Peter Sims, Barry Honig, and Mohammed AlQuraishi for discussion. We thank Sven Diederichs for sharing the SMAD4 readthrough cells. X.W. is supported by NIH Director’s New Innovator Award (1DP2GM140977), Pershing Square Sohn Prize for Cancer Research, Pew-Stewart Scholar for Cancer Research Award, and the Impetus Longevity Grants. N.M. is supported by the National Institute of Aging (NIA) grants R01AG064244 and RF1AG070075. This research was funded in part through the NIH/NCI Cancer Center Support Grant P30CA013696 and used the Genomics and High Throughput Screening Shared Resource and CCTI Flow Cytometry Core. The CCTI Flow Cytometry Core is supported in part by the Office of the Director, National Institutes of Health under awards S10RR027050 and S10OD020056. The content is solely the responsibility of the authors and does not necessarily represent the official views of the National Institutes of Health.
Footnotes
CONFLICT OF INTEREST
None.
DATA AVAILABILITY
The sequencing data for the massively parallel reporter assay has been deposited in GEO with the accession number GSE208661. Uncropped gel images were included in Supplementary Fig. 1. Gating strategies for flow cytometry assays were included in Supplementary Fig. 2.
CODE AVAILABILITY
Scripts for data analysis are available at https://github.com/xuebingwu/noncoding-translation-code.
REFERENCES
- 1.Ingolia Nicholas T. et al. Ribosome Profiling Reveals Pervasive Translation Outside of Annotated Protein-Coding Genes. Cell Reports 8, 1365–1379, (2014). [DOI] [PMC free article] [PubMed] [Google Scholar]
- 2.Ji Z, Song R, Regev A & Struhl K Many lncRNAs, 5'UTRs, and pseudogenes are translated and some are likely to express functional proteins. Elife 4, e08890, (2015). [DOI] [PMC free article] [PubMed] [Google Scholar]
- 3.Weatheritt RJ, Sterne-Weiler T & Blencowe BJ The ribosome-engaged landscape of alternative splicing. Nat Struct Mol Biol 23, 1117–1123, (2016). [DOI] [PMC free article] [PubMed] [Google Scholar]
- 4.Sudmant PH, Lee H, Dominguez D, Heiman M & Burge CB Widespread Accumulation of Ribosome-Associated Isolated 3' UTRs in Neuronal Cell Populations of the Aging Brain. Cell Rep 25, 2447–2456 e2444, (2018). [DOI] [PMC free article] [PubMed] [Google Scholar]
- 5.Adusumalli S, Ngian ZK, Lin WQ, Benoukraf T & Ong CT Increased intron retention is a post-transcriptional signature associated with progressive aging and Alzheimer's disease. Aging Cell 18, e12928, (2019). [DOI] [PMC free article] [PubMed] [Google Scholar]
- 6.Mazin P. et al. Widespread splicing changes in human brain development and aging. Mol Syst Biol 9, 633, (2013). [DOI] [PMC free article] [PubMed] [Google Scholar]
- 7.Hsieh YC et al. Tau-Mediated Disruption of the Spliceosome Triggers Cryptic RNA Splicing and Neurodegeneration in Alzheimer's Disease. Cell Rep 29, 301–316 e310, (2019). [DOI] [PMC free article] [PubMed] [Google Scholar]
- 8.Dvinge H & Bradley RK Widespread intron retention diversifies most cancer transcriptomes. Genome Med 7, 45, (2015). [DOI] [PMC free article] [PubMed] [Google Scholar]
- 9.Lee SH et al. Widespread intronic polyadenylation inactivates tumour suppressor genes in leukaemia. Nature 561, 127–131, (2018). [DOI] [PMC free article] [PubMed] [Google Scholar]
- 10.Dhamija S. et al. A pan-cancer analysis reveals nonstop extension mutations causing SMAD4 tumour suppressor degradation. Nat Cell Biol 22, 999–1010, (2020). [DOI] [PubMed] [Google Scholar]
- 11.Laumont CM et al. Noncoding regions are the main source of targetable tumor-specific antigens. Sci Transl Med 10, (2018). [DOI] [PubMed] [Google Scholar]
- 12.Xiang R. et al. Increased expression of peptides from non-coding genes in cancer proteomics datasets suggests potential tumor neoantigens. Commun Biol 4, 496, (2021). [DOI] [PMC free article] [PubMed] [Google Scholar]
- 13.Smart AC et al. Intron retention is a source of neoepitopes in cancer. Nat Biotechnol 36, 1056–1058, (2018). [DOI] [PMC free article] [PubMed] [Google Scholar]
- 14.Vakirlis N. et al. De novo emergence of adaptive membrane proteins from thymine-rich genomic sequences. Nat Commun 11, 781, (2020). [DOI] [PMC free article] [PubMed] [Google Scholar]
- 15.Carvunis AR et al. Proto-genes and de novo gene birth. Nature 487, 370–374, (2012). [DOI] [PMC free article] [PubMed] [Google Scholar]
- 16.Yordanova MM et al. AMD1 mRNA employs ribosome stalling as a mechanism for molecular memory formation. Nature 553, 356–360, (2018). [DOI] [PubMed] [Google Scholar]
- 17.Hashimoto S, Nobuta R, Izawa T & Inada T Translation arrest as a protein quality control system for aberrant translation of the 3'-UTR in mammalian cells. FEBS Lett 593, 777–787, (2019). [DOI] [PubMed] [Google Scholar]
- 18.Arribere JA et al. Translation readthrough mitigation. Nature 534, 719–723, (2016). [DOI] [PMC free article] [PubMed] [Google Scholar]
- 19.Kramarski L & Arbely E Translational read-through promotes aggregation and shapes stop codon identity. Nucleic Acids Res 48, 3747–3760, (2020). [DOI] [PMC free article] [PubMed] [Google Scholar]
- 20.Chen J. et al. Pervasive functional translation of noncanonical human open reading frames. Science 367, 1140–1146, (2020). [DOI] [PMC free article] [PubMed] [Google Scholar]
- 21.van Heesch S. et al. The Translational Landscape of the Human Heart. Cell 178, 242–260 e229, (2019). [DOI] [PubMed] [Google Scholar]
- 22.Djebali S. et al. Landscape of transcription in human cells. Nature 489, 101–108, (2012). [DOI] [PMC free article] [PubMed] [Google Scholar]
- 23.Bai B. et al. U1 small nuclear ribonucleoprotein complex and RNA splicing alterations in Alzheimer's disease. Proc Natl Acad Sci U S A 110, 16562–16567, (2013). [DOI] [PMC free article] [PubMed] [Google Scholar]
- 24.Wang L. et al. SF3B1 and other novel cancer genes in chronic lymphocytic leukemia. N Engl J Med 365, 2497–2506, (2011). [DOI] [PMC free article] [PubMed] [Google Scholar]
- 25.Hsu TY et al. The spliceosome is a therapeutic vulnerability in MYC-driven cancer. Nature 525, 384–388, (2015). [DOI] [PMC free article] [PubMed] [Google Scholar]
- 26.Wang D. et al. Inhibition of nonsense-mediated RNA decay by the tumor microenvironment promotes tumorigenesis. Mol Cell Biol 31, 3670–3680, (2011). [DOI] [PMC free article] [PubMed] [Google Scholar]
- 27.Son HG et al. RNA surveillance via nonsense-mediated mRNA decay is crucial for longevity in daf-2/insulin/IGF-1 mutant C. elegans. Nature Communications 8, 14749, (2017). [DOI] [PMC free article] [PubMed] [Google Scholar]
- 28.Sun Y, Eshov A, Zhou J, Isiktas AU & Guo JU C9orf72 arginine-rich dipeptide repeats inhibit UPF1-mediated RNA decay via translational repression. Nat Commun 11, 3354, (2020). [DOI] [PMC free article] [PubMed] [Google Scholar]
- 29.Wangen JR & Green R Stop codon context influences genome-wide stimulation of termination codon readthrough by aminoglycosides. Elife 9, (2020). [DOI] [PMC free article] [PubMed] [Google Scholar]
- 30.Dong C. et al. Intron retention-induced neoantigen load correlates with unfavorable prognosis in multiple myeloma. Oncogene 40, 6130–6138, (2021). [DOI] [PMC free article] [PubMed] [Google Scholar]
- 31.Lin HC et al. C-Terminal End-Directed Protein Elimination by CRL2 Ubiquitin Ligases. Mol Cell 70, 602–613 e603, (2018). [DOI] [PMC free article] [PubMed] [Google Scholar]
- 32.Koren I. et al. The Eukaryotic Proteome Is Shaped by E3 Ubiquitin Ligases Targeting C-Terminal Degrons. Cell 173, 1622–1635 e1614, (2018). [DOI] [PMC free article] [PubMed] [Google Scholar]
- 33.Dyson HJ & Wright PE Intrinsically unstructured proteins and their functions. Nat Rev Mol Cell Biol 6, 197–208, (2005). [DOI] [PubMed] [Google Scholar]
- 34.Zhang YE, Vibranovski MD, Landback P, Marais GAB & Long MY Chromosomal Redistribution of Male-Biased Genes in Mammalian Evolution with Two Bursts of Gene Gain on the X Chromosome. Plos Biology 8, (2010). [DOI] [PMC free article] [PubMed] [Google Scholar]
- 35.Wolfenden RV, Cullis PM & Southgate CC Water, protein folding, and the genetic code. Science 206, 575–577, (1979). [DOI] [PubMed] [Google Scholar]
- 36.Juszkiewicz S & Hegde RS Initiation of quality control during poly(A) translation requires site-specific ribosome ubiquitination. Mol Cell 65, 743–750 e744, (2017). [DOI] [PMC free article] [PubMed] [Google Scholar]
- 37.Liu Z. et al. Systematic comparison of 2A peptides for cloning multi-genes in a polycistronic vector. Sci Rep 7, 2193, (2017). [DOI] [PMC free article] [PubMed] [Google Scholar]
- 38.Wang T, Wei JJ, Sabatini DM & Lander ES Genetic screens in human cells using the CRISPR-Cas9 system. Science (New York, N.Y.) 343, 80–84, (2014). [DOI] [PMC free article] [PubMed] [Google Scholar]
- 39.Wunderley L, Leznicki P, Payapilly A & High S SGTA regulates the cytosolic quality control of hydrophobic substrates. J Cell Sci 127, 4728–4739, (2014). [DOI] [PMC free article] [PubMed] [Google Scholar]
- 40.Shao S, Rodrigo-Brenni MC, Kivlen MH & Hegde RS Mechanistic basis for a molecular triage reaction. Science 355, 298–302, (2017). [DOI] [PMC free article] [PubMed] [Google Scholar]
- 41.Hessa T. et al. Protein targeting and degradation are coupled for elimination of mislocalized proteins. Nature 475, 394–397, (2011). [DOI] [PMC free article] [PubMed] [Google Scholar]
- 42.Mariappan M. et al. A ribosome-associating factor chaperones tail-anchored membrane proteins. Nature 466, 1120–1124, (2010). [DOI] [PMC free article] [PubMed] [Google Scholar]
- 43.Rodrigo-Brenni MC, Gutierrez E & Hegde RS Cytosolic quality control of mislocalized proteins requires RNF126 recruitment to Bag6. Mol Cell 55, 227–237, (2014). [DOI] [PMC free article] [PubMed] [Google Scholar]
- 44.Hu X. et al. RNF126-Mediated Reubiquitination Is Required for Proteasomal Degradation of p97-Extracted Membrane Proteins. Mol Cell 79, 320–331 e329, (2020). [DOI] [PubMed] [Google Scholar]
- 45.Wang Q. et al. A ubiquitin ligase-associated chaperone holdase maintains polypeptides in soluble states for proteasome degradation. Mol Cell 42, 758–770, (2011). [DOI] [PMC free article] [PubMed] [Google Scholar]
- 46.Leznicki P & High S SGTA associates with nascent membrane protein precursors. EMBO Rep 21, e48835, (2020). [DOI] [PMC free article] [PubMed] [Google Scholar]
- 47.Akahane T, Sahara K, Yashiroda H, Tanaka K & Murata S Involvement of Bag6 and the TRC pathway in proteasome assembly. Nat Commun 4, 2234, (2013). [DOI] [PubMed] [Google Scholar]
- 48.Yewdell JW & Nicchitta CV The DRiP hypothesis decennial: support, controversy, refinement and extension. Trends Immunol 27, 368–373, (2006). [DOI] [PubMed] [Google Scholar]
- 49.Minami R. et al. BAG-6 is essential for selective elimination of defective proteasomal substrates. J Cell Biol 190, 637–650, (2010). [DOI] [PMC free article] [PubMed] [Google Scholar]
- 50.Huang L, Kuhls MC & Eisenlohr LC Hydrophobicity as a driver of MHC class I antigen processing. EMBO J 30, 1634–1644, (2011). [DOI] [PMC free article] [PubMed] [Google Scholar]
- 51.Brinkman EK, Chen T, Amendola M & van Steensel B Easy quantitative assessment of genome editing by sequence trace decomposition. Nucleic acids research 42, e168, (2014). [DOI] [PMC free article] [PubMed] [Google Scholar]
- 52.Hezroni H. et al. Principles of long noncoding RNA evolution derived from direct comparison of transcriptomes in 17 species. Cell Rep 11, 1110–1122, (2015). [DOI] [PMC free article] [PubMed] [Google Scholar]
- 53.Tareen A & Kinney JB Logomaker: beautiful sequence logos in Python. Bioinformatics 36, 2272–2274, (2020). [DOI] [PMC free article] [PubMed] [Google Scholar]
- 54.Li W. et al. MAGeCK enables robust identification of essential genes from genome-scale CRISPR/Cas9 knockout screens. Genome Biol 15, 554, (2014). [DOI] [PMC free article] [PubMed] [Google Scholar]
- 55.Moffat L & Jones DT Increasing the Accuracy of Single Sequence Prediction Methods Using a Deep Semi-Supervised Learning Framework. Bioinformatics, (2021). [DOI] [PMC free article] [PubMed] [Google Scholar]
- 56.Osorio D, Rondon-Villarreal P & Torres R Peptides: A package for data mining of antimicrobial peptides. The R Journal 7, 4–14, (2015). [Google Scholar]
- 57.Miyazawa S & Jernigan RL Estimation of effective interresidue contact energies from protein crystal structures: quasi-chemical approximation. Macromolecules 18, 534–552, (1985). [Google Scholar]
- 58.Lu S. et al. CDD/SPARCLE: the conserved domain database in 2020. Nucleic Acids Res 48, D265–D268, (2020). [DOI] [PMC free article] [PubMed] [Google Scholar]
- 59.Joung J. et al. Genome-scale CRISPR-Cas9 knockout and transcriptional activation screening. Nat Protoc 12, 828–863, (2017). [DOI] [PMC free article] [PubMed] [Google Scholar]
Associated Data
This section collects any data citations, data availability statements, or supplementary materials included in this article.
Supplementary Materials
Data Availability Statement
The sequencing data for the massively parallel reporter assay has been deposited in GEO with the accession number GSE208661. Uncropped gel images were included in Supplementary Fig. 1. Gating strategies for flow cytometry assays were included in Supplementary Fig. 2.
Scripts for data analysis are available at https://github.com/xuebingwu/noncoding-translation-code.


