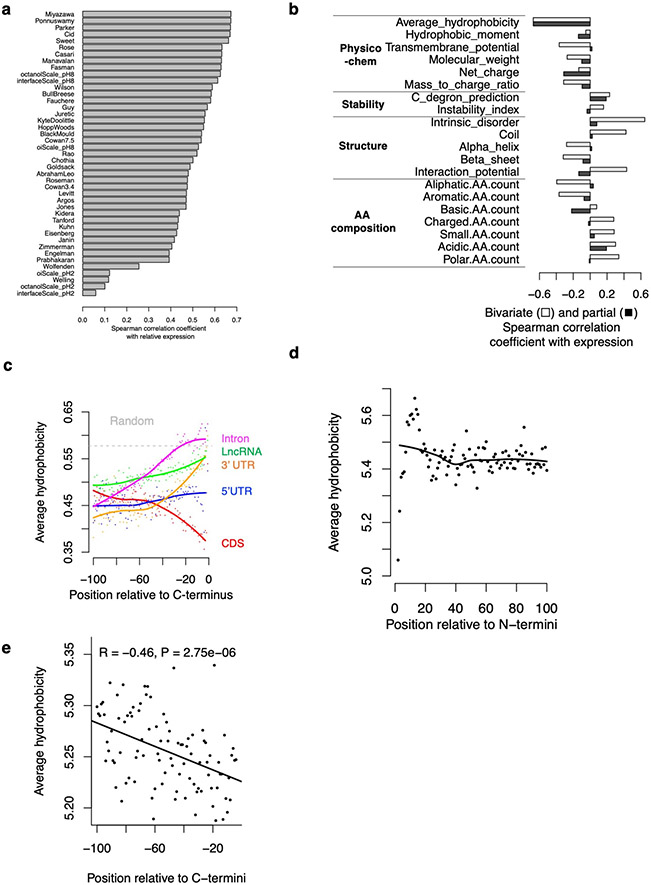
Extended Data Fig. 3 ∣. Hydrophobicity analyses in the Pep30 library and the human genome.
a, The correlation coefficient between Pep30 reporter expression and average hydrophobicity calculated using various scales. b, Spearman correlation coefficient (light bar) between various properties of the Pep30 sequences and reporter expression. Dark bar: partial correlation conditioned on average hydrophobicity. c. Same as Fig. 2f with a different hydrophobicity scale (Ponnuswamy instead of Miyazawa). d, Average hydrophobicity for the first 100 aa (N-termini) of annotated proteins (N= 38,933). e, Average hydrophobicity of the C-termini of annotated proteins without any annotated protein domains in the last 100aa (N=8,586). Shown are the Spearman correlation coefficient R and the P value of a two-sided Spearman’s correlation test. No adjustments were made for multiple comparisons.

