SUMMARY
Genetic risk variants identified in genome-wide association studies (GWAS) of complex disease are primarily non-coding1, and translating risk variants into mechanistic insight requires detailed gene regulatory maps in disease-relevant cell types2. Here, we combined a GWAS of type 1 diabetes (T1D) in 520,580 samples with candidate cis-regulatory elements (cCREs) in pancreas and peripheral blood mononuclear cell types defined using single nucleus ATAC-seq (snATAC-seq) of 131,554 nuclei. T1D risk variants were enriched in cCREs active in T cells and additional cell types, including acinar and ductal cells of the exocrine pancreas. Risk variants at multiple T1D signals overlapped exocrine-specific cCREs linked to genes with exocrine-specific expression. At the CFTR locus, T1D risk variant rs7795896 mapped in a ductal-specific cCRE which regulated CFTR, and the risk allele reduced transcription factor binding, enhancer activity and CFTR expression in ductal cells. These findings support a role for the exocrine pancreas in T1D pathogenesis and highlight the power of large-scale GWAS and single cell epigenomics for understanding the cellular origins of complex disease.
Type 1 diabetes (T1D) is a complex autoimmune disease characterized by the loss of insulin-producing pancreatic beta cells3, where the triggers of autoimmunity and disease onset remain poorly understood. T1D has a strong genetic component, most prominently at the major histocompatibility complex (MHC) locus, but including 59 additional risk loci4–6. T1D risk variants are largely non-coding, and intersection of risk variants with epigenomic data has identified enrichment within lymphoid enhancers4. However, due to limited sample sizes, incomplete variant coverage, and limited cell type resolution of existing epigenomic maps, the causal variants and cellular mechanisms of action of T1D risk loci are largely unresolved.
Discovery and fine-mapping of T1D loci
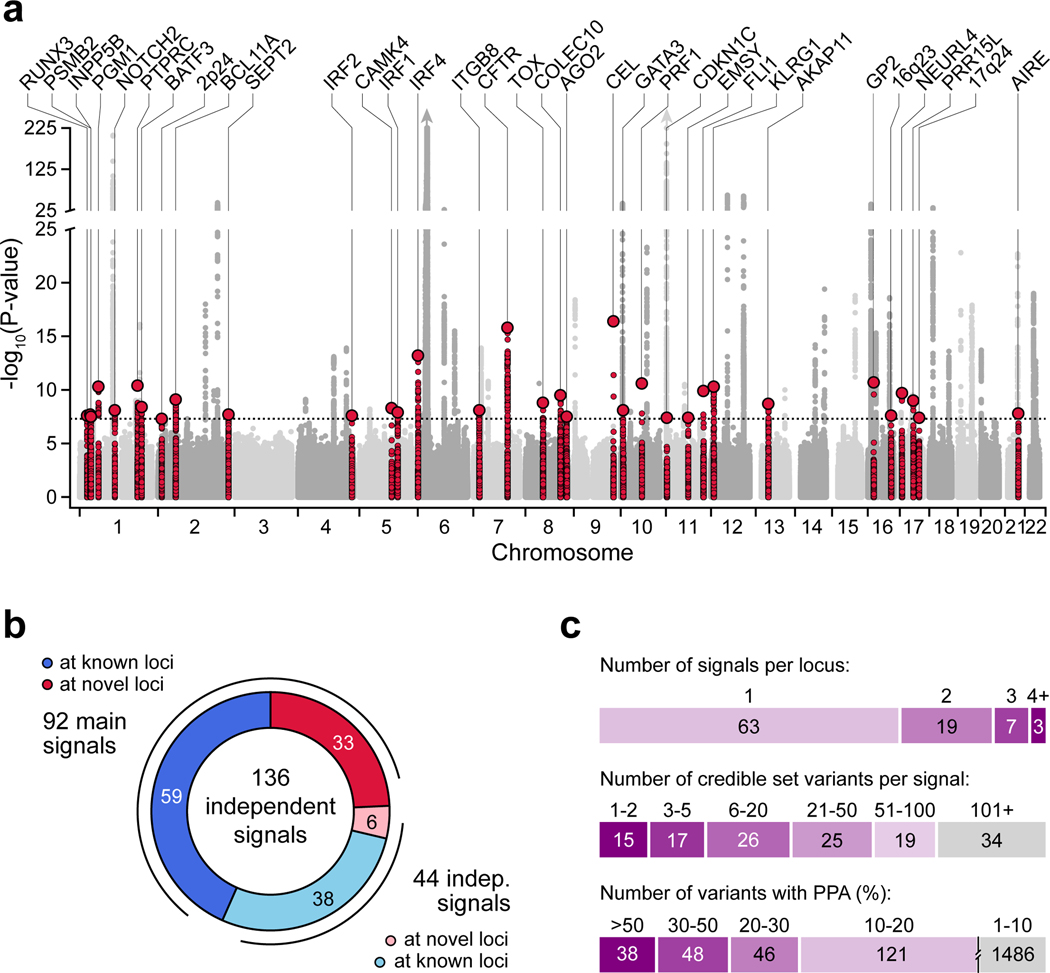
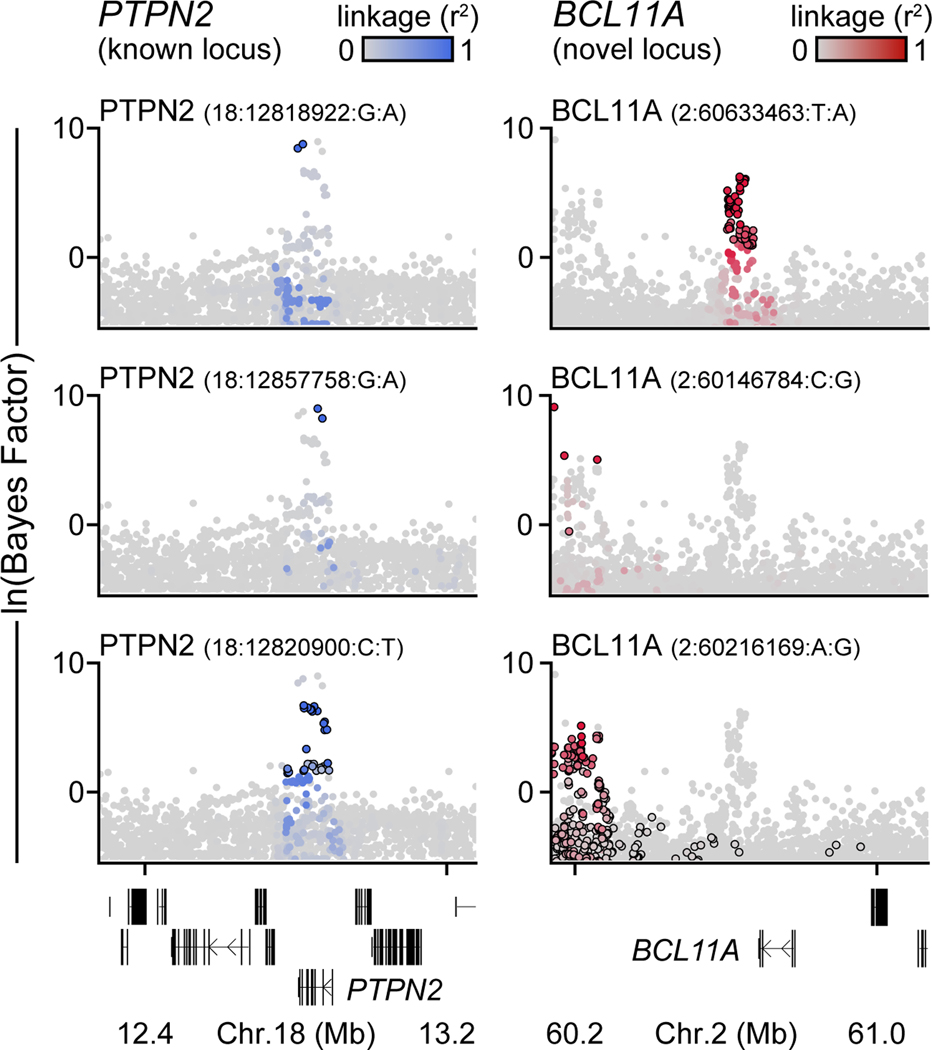
We performed a GWAS of 18,942 T1D cases and 501,638 controls of European ancestry from 9 cohorts (Supplementary Table 1). After applying uniform quality-control (Supplementary Figure 1), we imputed genotypes into the TOPMed reference panel and tested for T1D association7. Through meta-analysis, we combined association results for 61,947,369 variants and observed 81 loci reaching genome-wide significance (P<5×10⁻⁸), including 48 of 59 known loci and 33 previously unreported loci (Figure 1a, Supplementary Figure 2, Supplementary Table 2). At 92 total loci (59 known and 33 novel), we discovered 44 independent signals, of which 36 were previously unreported (Figure 1b, Supplementary Figure 3). Nearly a third (32%; 29/92) of loci contained more than one signal; for example, the PTPN2 and BCL11A loci each had three signals (Extended Data Figure 1).
Figure 1. Genome-wide association and fine-mapping identifies novel T1D risk signals.
(a) Genome-wide T1D association (two-sided -log10 transformed p-values from meta-analysis, unadjusted for multiple comparisons). Novel loci are colored (±250 kb of the index variant) and labeled based on the nearest gene. Dotted line indicates genome-wide significance (P=5×10⁻⁸). (b) Breakdown of 136 T1D risk signals, including 92 main signals (59 known and 33 novel), and 44 independent signals (38 at known and 6 at novel loci). (c) Number of signals per locus (top), 99% credible set variants from fine-mapping (middle), and variants with posterior probability of association (PPA) at various thresholds (bottom).
We fine-mapped causal variants for 136 T1D signals including 92 main and 44 independent signals (Figure 1b). We obtained the posterior probability of association (PPA) for tested variants and defined 99% credible sets for each signal (Supplementary Table 3, Supplementary Data 1). Compared to a previous study8, fine-mapping resolution was improved based on credible set size and maximum posterior probability (Supplementary Figure 4). The median credible set size was 31 variants, where nearly a quarter (24%; 32/136) contained 5 or fewer variants, and 28% (38/136) contained a single variant with >0.50 PPA (Figure 1c). Credible sets at 15% (21/136) of signals contained a nonsynonymous variant with PPA>0.01, including novel loci AIRE p.Arg471Cys (PPA=0.99), BATF3 p.Val11Ile (PPA=0.078), PRF1 p.Ala91Val (PPA=0.28), and INPP5B p.Gly250Cys (PPA=0.055) (Supplementary Table 4).
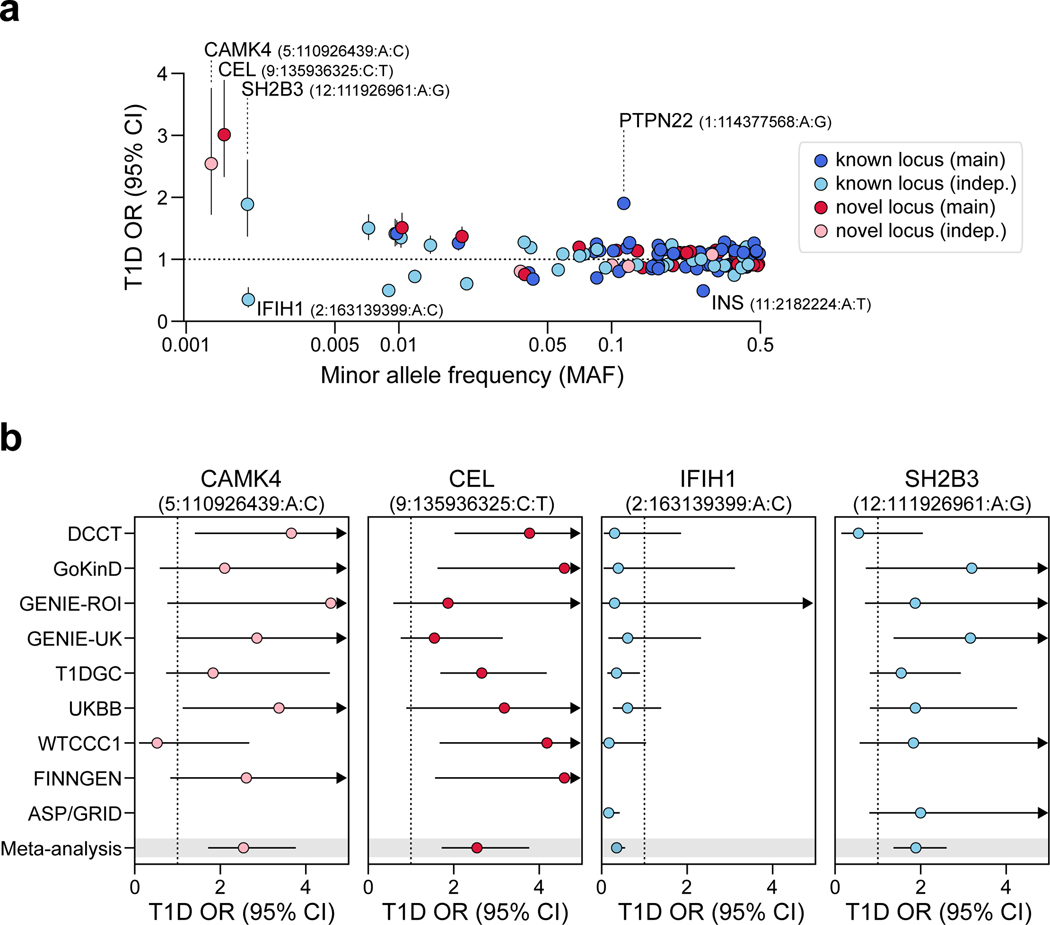
The TOPMed reference panel enables more accurate imputation of rare variants. We identified four novel variants with minor allele frequency (MAF)<0.005 and large effects on T1D (Extended Data Figure 2a). Among these, rs541856133 (MAF=0.0015, OR=3.01, 95% CI=2.33–3.89) mapped directly upstream of CEL, a gene implicated in maturity-onset diabetes of the young (MODY8)9. We also identified a novel protein-coding protective variant at IFIH1 (p.Asn160Asp, rs75671397, MAF=0.002, OR=0.35, 95% CI=0.22–0.55) independent of known signals in this gene. Two additional non-coding risk variants mapped to SH2B3 (rs570074821, MAF=0.0019, OR=1.89, 95% CI=1.37–2.61) and CAMK4 (rs72663304, MAF=0.0013, OR=2.54, 95% CI=1.72–3.76) (Extended Data Figure 2b).
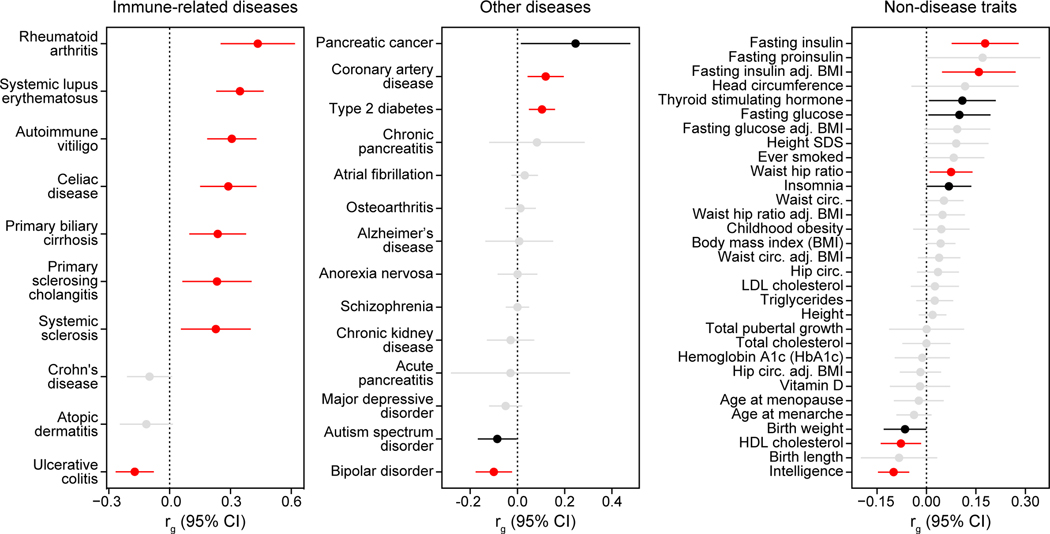
We characterized genetic correlations between T1D and other complex traits and diseases. Consistent with previous reports4,10, T1D had significant (FDR<0.10) positive correlations with autoimmune diseases such as rheumatoid arthritis (rg=0.44, FDR=7.52×10⁻⁵) and systemic lupus erythematosus (rg=0.35, FDR=5.05×10⁻⁷), and negative correlation with ulcerative colitis (rg=−0.18, FDR=1.95×10⁻³) (Extended Data Figure 3). We also observed positive correlations with metabolic traits such as fasting insulin level (rg=0.18, FDR=4.04×10⁻³), coronary artery disease (rg=0.12, FDR=1.23×10⁻²), and type 2 diabetes (rg=0.10, FDR=1.95×10⁻³), and with pancreatic diseases such as pancreatic cancer (rg=0.25, FDR=1.11×10⁻¹) although this was just above significance. These results demonstrate relationships between genetic effects on T1D and autoimmune, metabolic and pancreatic disease.
Pancreas and immune cell gene regulation
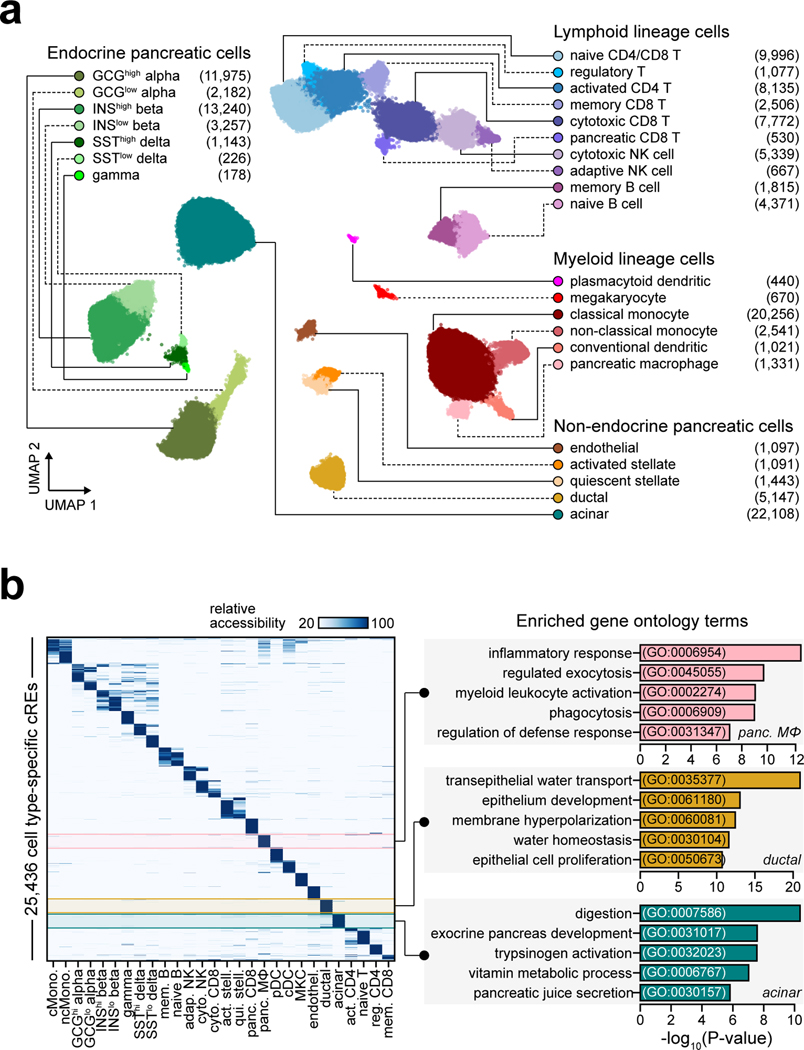
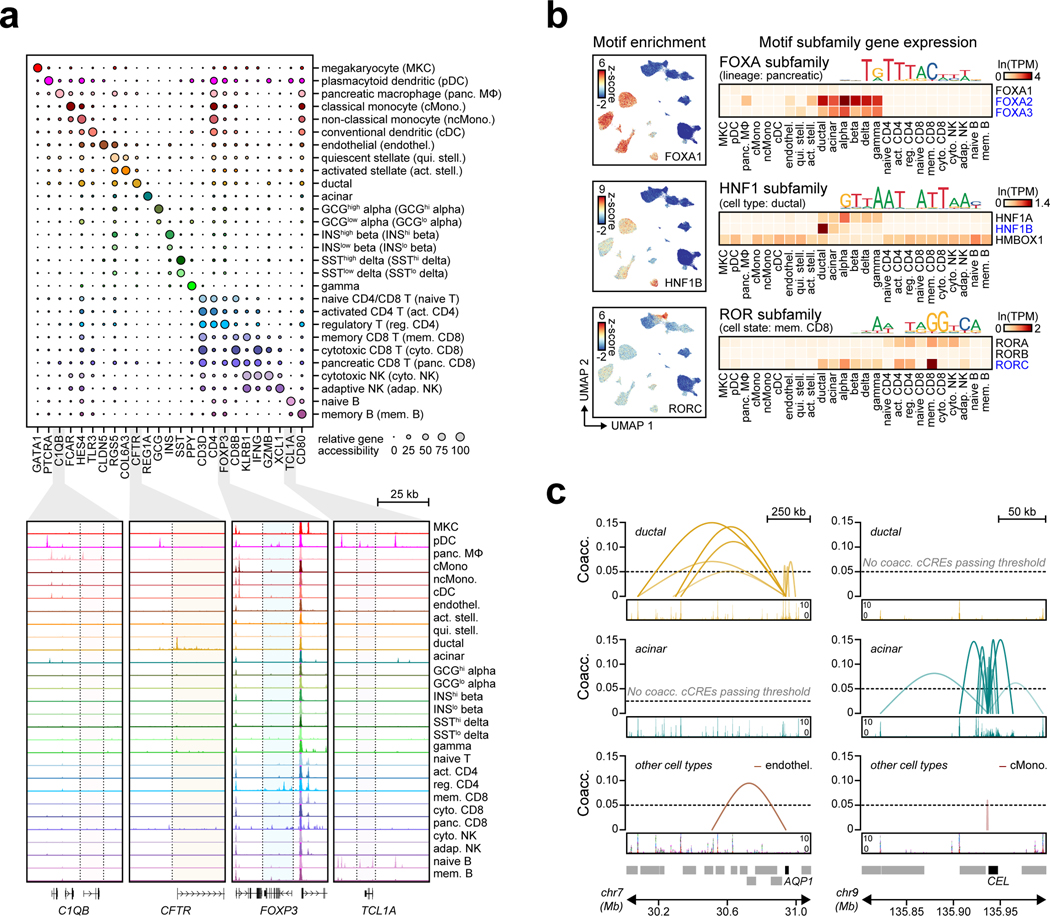
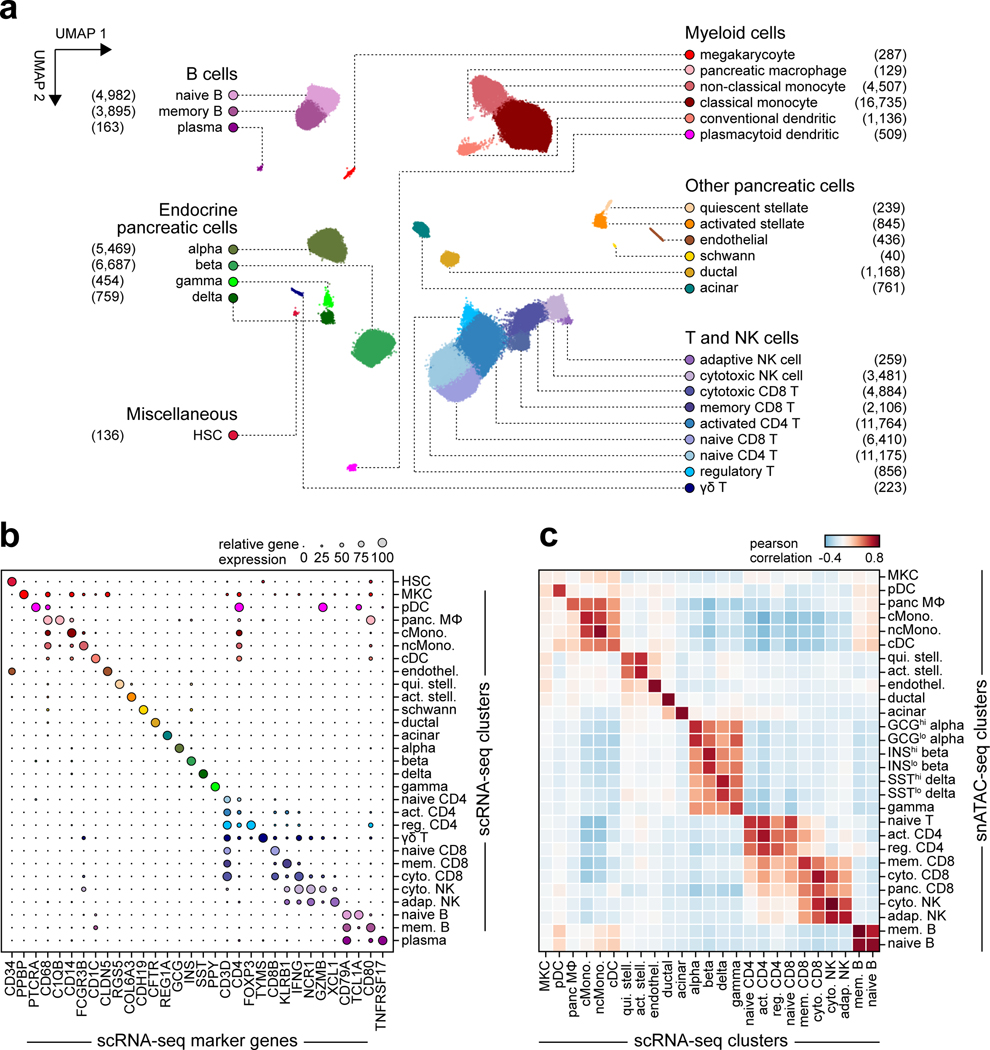
The majority of T1D risk likely affects gene regulation4. To annotate T1D risk variants, we generated an accessible chromatin reference map using snATAC-seq of peripheral blood and pancreas from non-diabetic donors (Supplementary Table 5). We grouped chromatin accessibility profiles from 131,554 cells into 28 clusters (Figure 2a, Supplementary Figure 5a–c) and assigned cell type identities using chromatin accessibility at marker genes (Supplementary Table 6). For example, chromatin accessibility at C1QB marked pancreas tissue-resident macrophages, REG1A marked acinar cells, and CFTR marked ductal cells (Extended Data Figure 4a). We also observed patterns of chromatin accessibility at marker genes for cell sub-types, such as FOXP3 for regulatory T cells (Extended Data Figure 4a). To relate cell type-resolved accessible chromatin to gene expression, we created a single cell RNA-seq (scRNA-seq) reference map of peripheral blood and pancreas. We assigned cell type identities for 90,495 cells to 29 clusters, which identified similar cell types and proportions as snATAC-seq (Extended Data Figure 5a–c).
Figure 2. Reference map of single cell chromatin accessibility from T1D-relevant tissues.
(a) Leiden clustering of single cell accessible chromatin profiles from 131,554 cells. Cells are plotted on the first two UMAP components, clusters are grouped into categories of cell types, and the number of cells per cluster are in parentheses. (b) Relative accessibility (row-normalized) for 25,436 cCREs most specific to each cluster (left), and enriched gene ontology terms for cCREs specific to pancreatic macrophages, ductal, and acinar cells (right).
To characterize cis-regulatory programs, we aggregated reads from cells within each snATAC-seq cluster and identified accessible chromatin peaks representing cCREs. There were 448,142 cCREs across all 28 clusters and an average of 77,812 cCREs per cluster (Supplementary Data 2). We also aggregated reads from cells within each snRNA-seq cluster to derive normalized expression (Supplementary Data 3). To delineate regulatory programs specifying each cell type, we identified 25,436 cCREs with accessibility patterns most specific to each cluster (Figure 2b, Supplementary Data 4). Genes within 100 kb of cell type-specific cCREs had more specific expression relative to other cCREs (Supplementary Figure 6). Cell type-specific cCREs were also enriched for GO terms representing highly specialized cellular processes (Figure 2b, Supplementary Table 7).
We defined transcriptional regulators of cCRE activity by assessing transcription factor (TF) motif enrichment (Supplementary Data 5). Enriched TF motifs included those with lineage, cell type, and cell state specificity (Extended Data Figure 4b). As TFs within subfamilies often have similar motifs, we grouped TFs into subfamilies to identify TFs with matching expression and motif enrichment patterns (Supplementary Table 8). For example, FOXA subfamily TFs FOXA2 and FOXA3 were specifically expressed in pancreatic endocrine and exocrine cells, HNF1 subfamily TF HNF1B was specifically expressed in ductal cells, and ROR subfamily TF RORC was specifically expressed in memory CD8+ T cells (Extended Data Figure 4b, Supplementary Table 8).
As the target genes of cCRE activity are largely unknown, we identified cell type-resolved co-accessibility links between distal (non-promoter) cCREs and putative target gene promoters. Across all cell types, we observed 1,028,428 links (co-accessibility>0.05) between distal cCREs and gene promoters (Supplementary Data 6). Co-accessible links were often cell type-specific; for example, distal cCREs were co-accessible with the AQP1 promoter in ductal cells and the CEL promoter in acinar cells (Extended Data Figure 4c). In nearly every cell type, target genes co-accessible with distal cCREs were more likely to be expressed in the cell type compared to matched genes (Supplementary Figure 7).
Cell type annotation of T1D risk variants
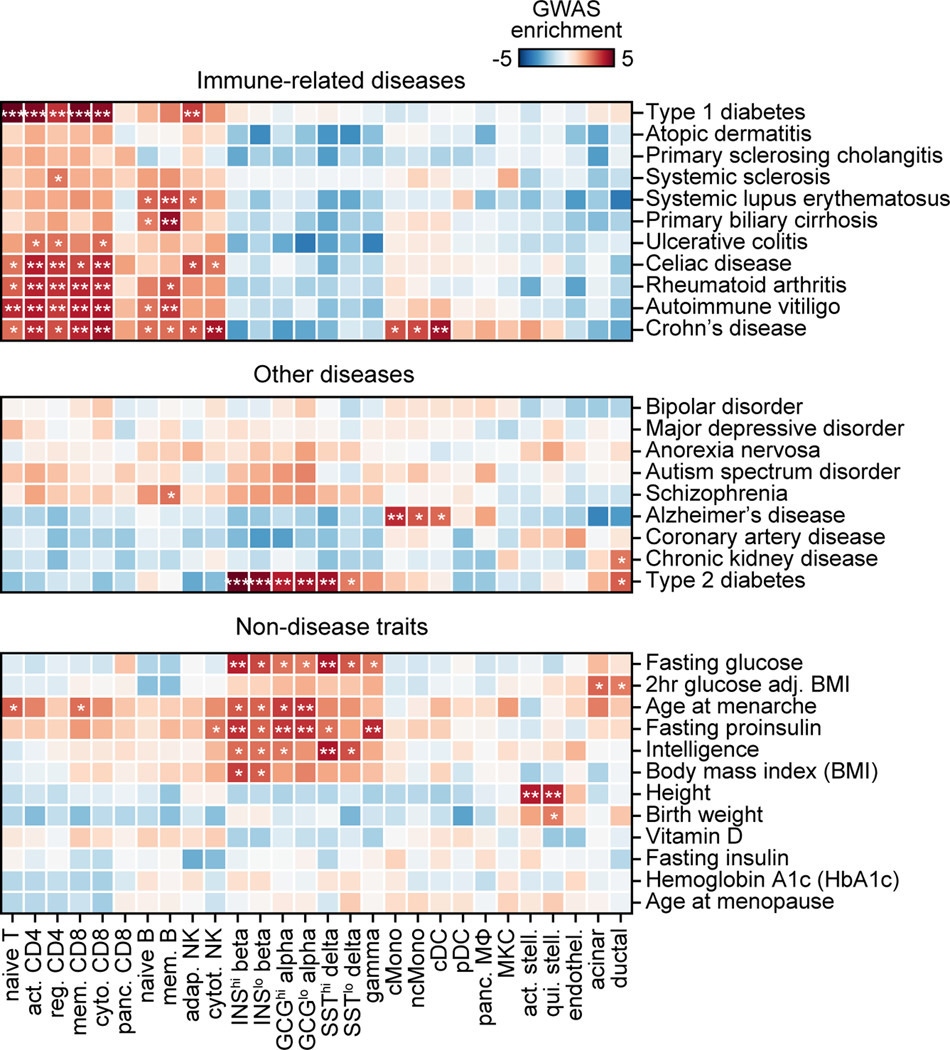
We determined enrichment of variants associated with T1D and other complex traits and diseases for cell type cCREs. For T1D, the most significant enrichment was in T cell cCREs (naïve T Z=5.57, FDR=2.26×10⁻⁵; memory CD8+ T Z=4.80, FDR=4.67×10⁻⁴; activated CD4+ T Z=4.62, FDR=6.74×10⁻⁴; cytotoxic CD8+ T Z=4.49 FDR=1.09×10⁻³; regulatory T Z=3.26, FDR=7.23×10⁻³) and adaptive NK cells (Z=3.50, FDR=9.93×10⁻³) (Extended Data Figure 6). Notably, we did not observe enrichment in pancreatic resident immune cells (CD8+ T Z=0.65, FDR=1.0; macrophage Z=−0.56, FDR=1.0). Other immune-related diseases were primarily enriched within lymphocyte cCREs, while type 2 diabetes and glycemic traits were enriched in pancreatic endocrine, acinar, and ductal cCREs (Extended Data Figure 6). These results demonstrate that T1D variants are broadly enriched for T cell cCREs and highlight other traits enriched for pancreatic and immune cell cCREs.
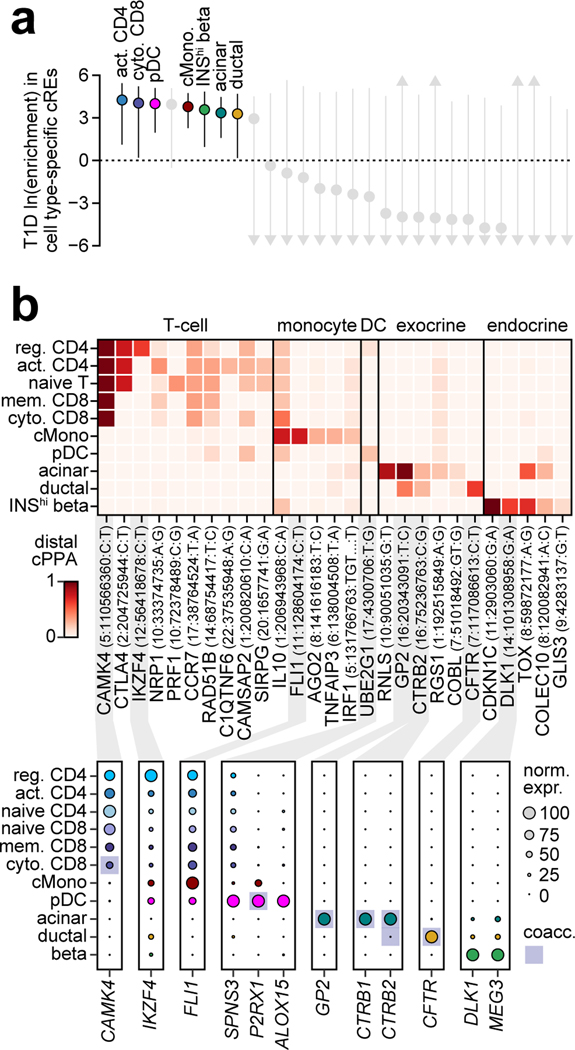
Despite the strong enrichment of T1D-associated variants in T cells, many T1D signals did not overlap a T cell cCRE suggesting that additional cell types contribute to T1D risk. To identify additional disease-relevant cell types, we used an orthogonal approach to test for enrichment of T1D variants within the subset of cell type-specific cCREs. As expected, T1D-associated variants were enriched in cCREs specific to T cells and beta cells (activated CD4+ T ln(enrich)=4.25, 95% CI=1.11–5.43; cytotoxic CD8+ T ln(enrich)=4.04, 95% CI=0.20–5.20); INShigh beta cells (ln(enrich)=3.58, 95% CI=0.95–4.84) (Figure 3a). Interestingly, T1D variants were also enriched in cCREs specific to plasmacytoid dendritic (pDC) (ln(enrich)=4.00, 95% CI=1.96–5.10), classical monocytes (ln(enrich)=3.78, 95% CI=2.23–4.74), acinar (ln(enrich)=3.35, 95% CI=1.59–4.46) and ductal cells (ln(enrich)=3.28, 95% CI=0.18–4.69) (Figure 3a).
Figure 3. Cell type-specific enrichment and mechanisms of T1D risk variants.
(a) T1D enrichment within cell type-specific cCREs. Labeled cell types have positive enrichment and 95% CI lower bound >0. Data are natural log enrichment ± 95% CI from fgwas. (b) T1D signals with highest cumulative PPA (cPPA) in cCREs for disease-enriched cell types (>0.20 cPPA for T cells and monocytes, >0.10 cPPA for other groups), and >0.01 cPPA away from the next closest group (top). Column-normalized expression for genes with TPM>1 in the highlighted cell type(s) and within ±500 kb of the index variant. Genes co-accessible with cCREs containing risk variants are annotated in rectangles (bottom).
Given insight into key T1D-relevant cell types, we next annotated T1D signals in cCREs for these cell types. Over 75% (103/136) of T1D signals contained at least one variant (PPA>0.01) overlapping a cCRE, and at 65% (67/103) of these signals the cCRE was co-accessible with a gene promoter (Supplementary Table 9). Variants with high probabilities (PPA>0.50) were significantly more likely to map in a cCRE compared to other credible set variants (OR=3.9, 95% CI 1.9–7.8, P=1.9×10⁻⁴), and these cCREs were more likely to be co-accessible with a promoter (OR=6.1, 95% CI 1.3–55.9, P=7.1×10⁻³). For each signal, we calculated the cumulative posterior probability (cPPA) of credible set variants overlapping distal cCREs in each disease-enriched cell type. Numerous T1D signals had high cPPA in T cell cCREs and not in other disease-relevant cell types (Figure 3b). We also observed T1D signals with high cPPA in acinar and ductal (exocrine), beta cell, monocyte and pDC cCREs, several of which were highly cell type-specific (Figure 3b). For each signal, we further annotated genes within 1 Mb expressed in the same cell type and co-accessible with cCREs (Figure 3b, Supplementary Table 9).
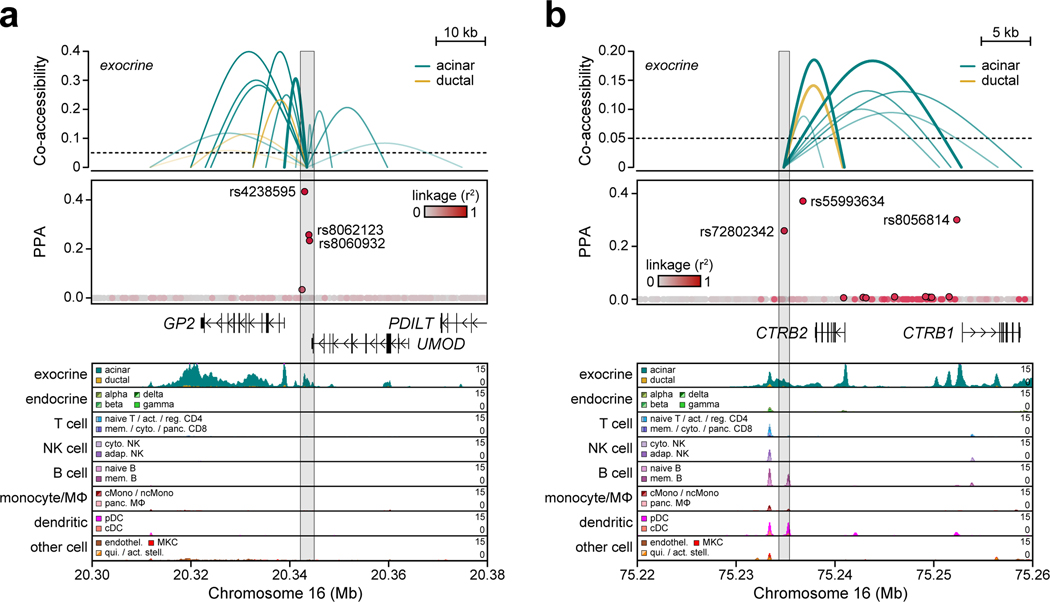
Multiple T1D signals had high cPPA specifically in pancreatic exocrine cells and were linked to genes with exocrine-specific expression. At the GP2 locus, three variants accounted for 0.951 PPA and mapped in an acinar-specific cCRE co-accessible with the promoter of GP2, which had acinar-specific expression (Figure 3b, Extended Data Figure 7a). Similarly, rs72802342 at the BCAR1 locus (PPA=0.30) mapped in an acinar-specific cCRE co-accessible with the promoters of CTRB1 and CTRB2, both of which had acinar-specific expression (Figure 3b, Extended Data Figure 7b). Other signals such as CEL had similar exocrine-specific profiles (Supplementary Figure 8a–c). Exocrine cCREs at T1D loci were also largely specific relative to stimulated immune cell and islet accessible chromatin (Supplementary Table 10).
T1D variant affects CFTR in ductal cells
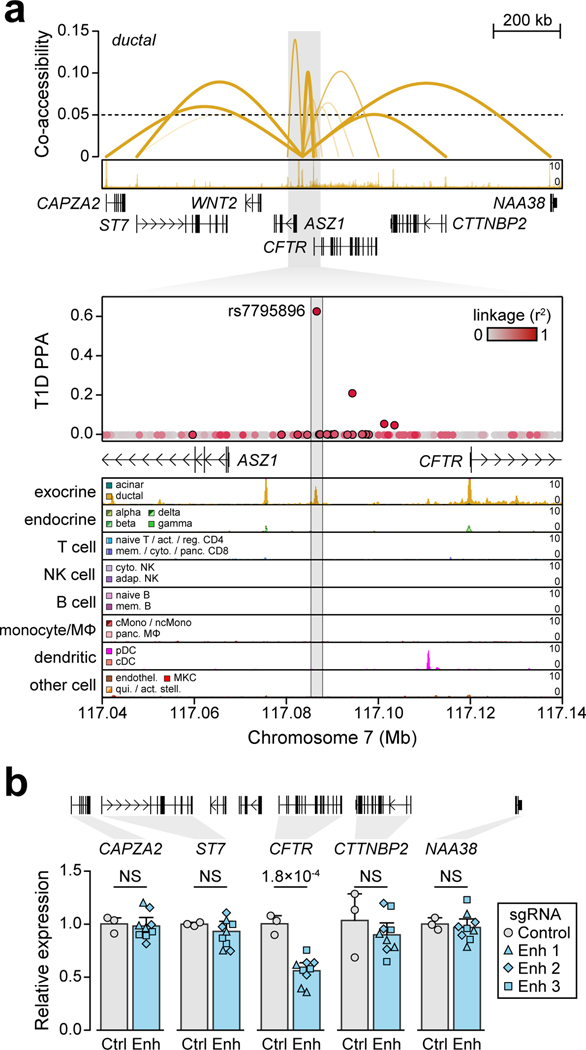
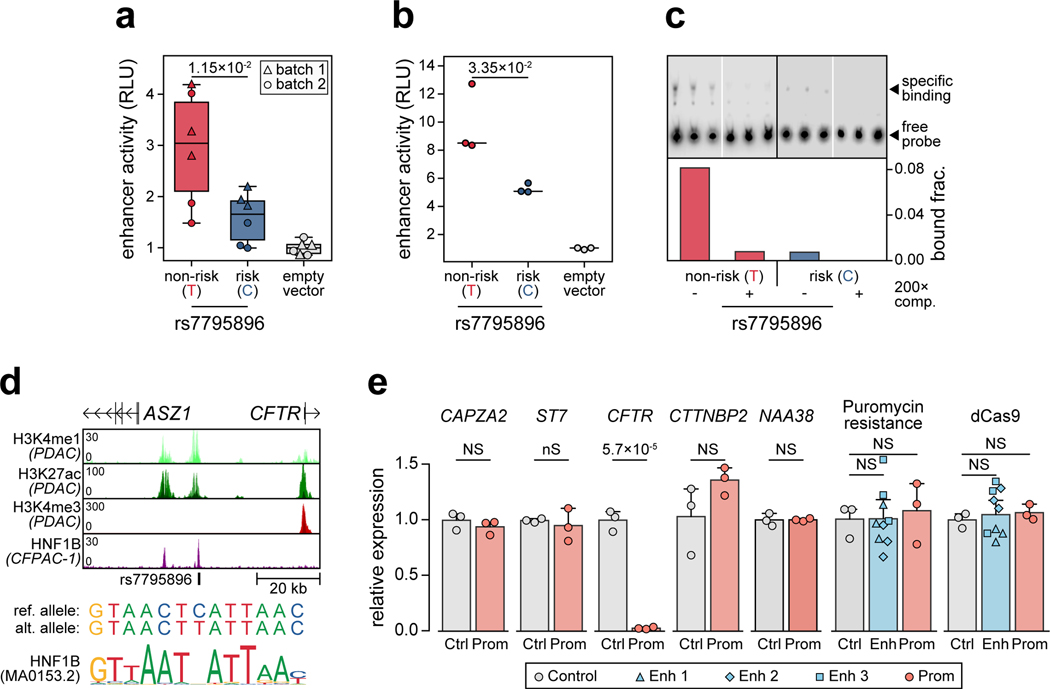
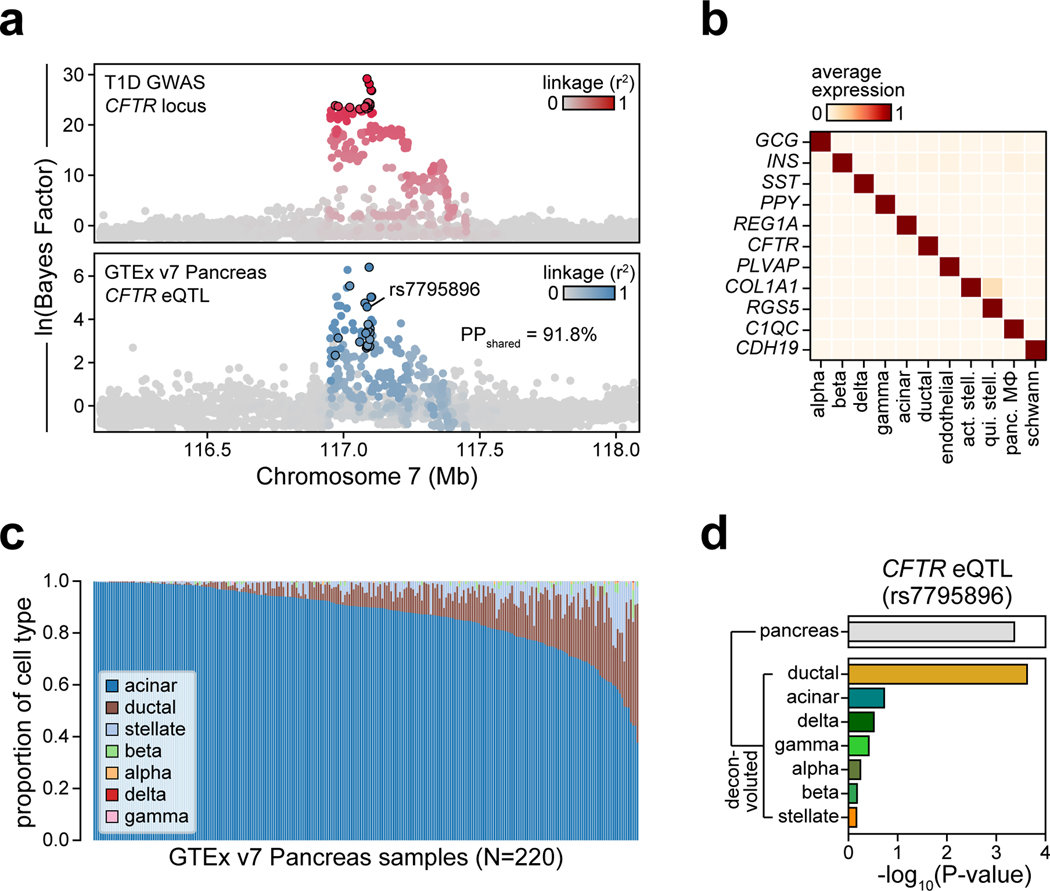
The CFTR locus contained a fine-mapped variant rs7795896 (PPA=0.63) in a distal cCRE specific to ductal cells and co-accessible with the CFTR promoter in addition to other genes (Figure 4a). Recessive mutations in CFTR cause cystic fibrosis (CF), which is often comorbid with exocrine pancreas insufficiency and CF-related diabetes (CFRD)11. Furthermore, carriers of CFTR mutations often develop chronic pancreatitis12. As CFTR has not been implicated in T1D, we sought to validate the mechanism of this locus. The T1D risk allele of rs7795896 significantly reduced enhancer activity (594bp sequence two-sided ANOVA P=1.15×10⁻², Extended Data Figure 8a; 180bp sequence two-sided t-test P=3.35×10⁻², Extended Data Figure 8b) and reduced protein binding (bound fraction rs7795896-C=0.007, rs7795896-T=0.081; Extended Data Figure 8c, Supplementary Figure 9) in Capan-1 cells. The variant mapped in a sequence motif for HNF1B, albeit in a position predicted to minimally impact binding, and overlapped a HNF1B ChIP-seq site previously identified in ductal cells13 (Extended Data Figure 8d).
Figure 4. Fine-mapped T1D variant regulates CFTR in pancreatic ductal cells.
(a) Variant rs7795896 at the CFTR locus mapped in a cCRE co-accessible with CFTR and other genes. Zoomed-in view shows the cCRE is ductal-specific. (b) Expression of genes co-accessible with the distal cCRE in CRISPR-inactivated enhancer (Enh; n=9, 3 sgRNAs × 3 biological replicates) compared to non-targeting control (Ctrl; n=3 biological replicates) in Capan-1. Data are mean ± 95% CI. P-values by two-sided ANOVA; NS, not significant.
To determine whether the enhancer harboring rs7795896 regulated CFTR in ductal cells, we used CRISPR interference (CRISPRi) to inactivate enhancer activity (CFTREnh) in Capan-1 cells (Supplementary Table 11). As positive and negative controls, we inactivated the CFTR promoter (CFTRProm) and used a non-targeting guide RNA, respectively. Quantitative PCR revealed a significant reduction in CFTR expression after enhancer inactivation (two-sided ANOVA P=1.77×10⁻⁴), whereas expression of other genes at the locus was unchanged (Figure 4b, Extended Data Figure 8e). We determined whether risk variants affected CFTR expression using pancreas eQTL data from GTEx14. Out of 13 tested genes, only CFTR had evidence for an eQTL (P=4.31×10⁻⁴), which was colocalized with the T1D signal (PPshared=91.8%) (Extended Data Figure 9a). Among candidate variants with evidence for driving the shared signal using eCAVIAR (CLPP>0.01), only rs7795896 mapped in a cCRE. The T1D risk allele of rs7795896 was associated with decreased CFTR expression, consistent with effects on enhancer activity and TF binding. We re-calculated the eQTL association including estimated pancreas cell type proportion as an interaction term, and only ductal cells had significant association (P=2.37×10⁻⁴) (Extended Data Figure 9b–d).
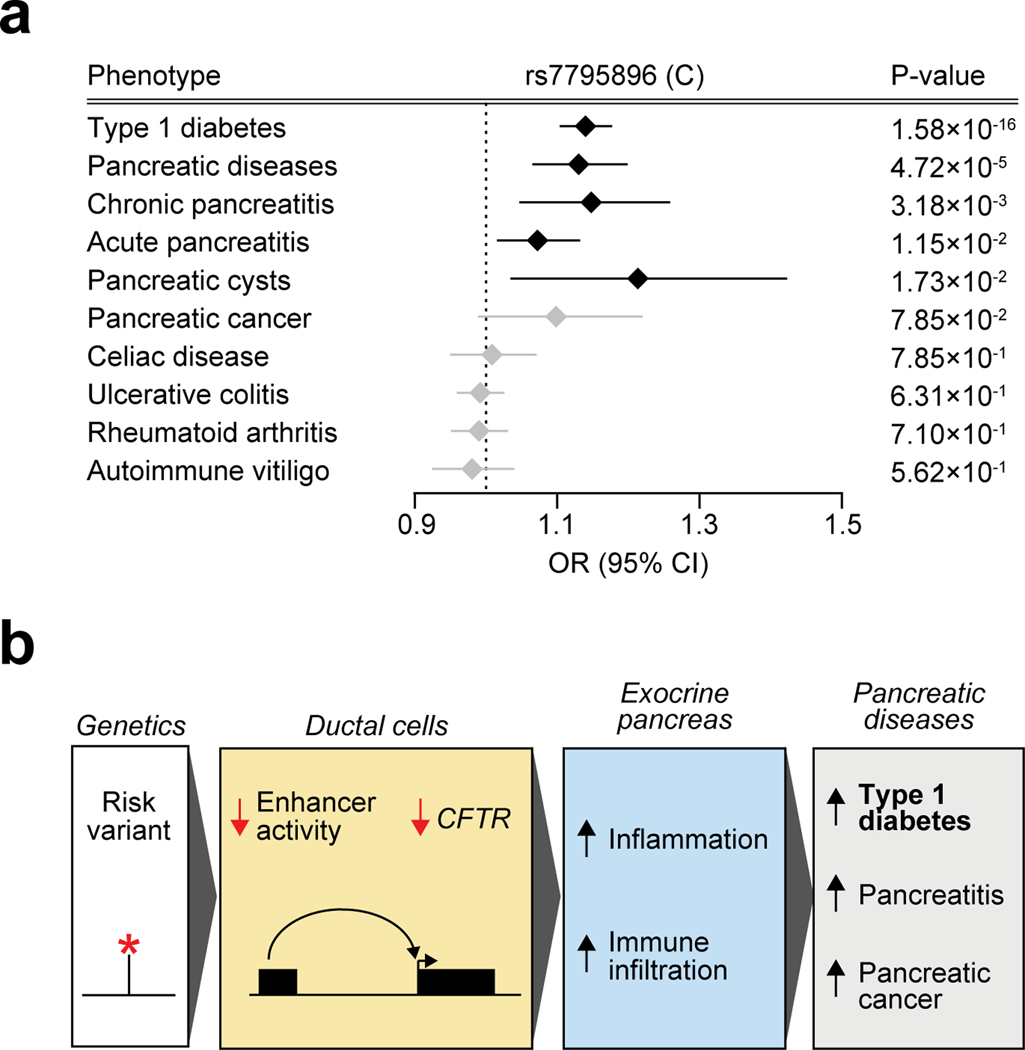
As CFTR has been implicated in pancreatic cancer15 and pancreatitis16, we asked whether rs7795896 was associated with these phenotypes in UK biobank and FinnGen. The T1D risk allele was associated with increased risk of pancreatitis (chronic pancreatitis OR=1.15, P=3.18×10⁻³; acute pancreatitis OR=1.07, P=1.15×10⁻²) and other pancreatic diseases (OR=1.13, P=4.72×10⁻⁵) (Extended Data Figure 10a). In contrast, rs7795896 was not associated with other autoimmune diseases (all P>0.05). T1D signals associated with increased risk of pancreatic disease had significantly higher cPPA in exocrine cCREs compared to other signals (two-sided Student’s t-test P=0.027) and no difference for T cell cCREs (P=0.36). Together, our findings support a model in which variants regulating CFTR and other genes in the exocrine pancreas increase risk of T1D and pancreatic diseases (Extended Data Figure 10b).
High-resolution mapping of both genetic variants influencing T1D risk and cell type-specific cis-regulatory programs in T1D-relevant tissues enabled new insight into disease mechanisms. Risk variants at multiple loci mapped to genes with specialized function in exocrine cells. While our results support variants in exocrine cCREs mediating T1D risk, fine-mapping has not resolved a single variant at most loci. Risk variants in exocrine-specific cCREs may also function in other cell types in the context of development, environmental changes, or disease progression. Continued fine-mapping in trans-ethnic cohorts with systematic evaluation of variant function in relevant cell types will further clarify risk mechanisms. Furthermore, as co-accessible links represent correlations that require both sites to vary in their accessibility, future studies will benefit from linking changes in chromatin to gene expression directly through single cell multi-omics.
Observational studies have reported exocrine pancreas abnormalities at T1D onset17, but it was unknown whether this was causing disease18. Genomic studies have also identified changes in exocrine cells in T1D19,20. Exocrine pancreas abnormalities in T1D have been considered secondary to other disease processes, such as beta cell loss causing reduced insulinotropic effects on exocrine cells or viral infection leading to exocrine inflammation. In contrast, our findings provide evidence that exocrine cells intrinsically contribute to T1D. Reduced CFTR leads to CFRD via intra-islet inflammation and immune infiltration, and immune infiltration in the exocrine pancreas has been suggested to contribute to T1D21–23. Other implicated genes encode proteins secreted from acinar cells linked to risk of pancreatic disease24–26, and may contribute to an inflammatory state. We therefore hypothesize a causal role for pancreatic exocrine gene regulation in T1D, which may provide novel avenues for therapeutic discovery.
METHODS
Genotype quality control and imputation
We compiled individual-level genotype data and summary statistics of 18,942 T1D cases and 501,638 controls of European ancestry from public sources (Supplementary Table 1), where T1D case cohorts were matched to population control cohorts based on genotyping array (Affymetrix, Illumina Infinium, Illumina Omni, and Immunochip) and country of origin where possible (US, British, and Ireland). For the GENIE-UK cohort, because we were unable to find a matched country of origin control cohort, we used individuals of British ancestry (defined by individuals within 1.5 interquartile range of CEU/GBR subpopulations on the first 4 PCs from PCA with European 1000 Genomes Project samples) from the University of Michigan Health and Retirement study (HRS). For non-UK Biobank cohorts, we first applied individual and variant exclusion lists (where available) to remove low quality, duplicate, or non-European ancestry samples and failed genotype calls for each cohort. For control cohorts, we also used phenotype files (where available) to remove individuals with type 2 diabetes or autoimmune diseases.
We then applied the HRC imputation preparation program (version 4.2.9) and used PLINK27 (version 1.90b6.7) to remove variants based on (i) low frequency (MAF<1%), (ii) missing genotypes (missing>5%), (iii) violation of Hardy-Weinberg equilibrium (HWE P<1×10⁻⁵ in control cohorts and HWE P<1×10⁻¹⁰ in case cohorts), (iv) difference in allele frequency >0.2 compared to the Haplotype Reference Consortium r1.1 reference panel28, and (v) allele ambiguity defined as AT/GC variants with MAF>40%35. We further removed individuals based on (i) missing genotypes (missing>5%), (ii) sex mismatch with phenotype records (homchrX>0.2 for females and homchrX<0.8 for males), (iii) cryptic relatedness through identity-by-descent (IBD>0.2), and (iv) non-European ancestry through PCA with 1000 Genomes Project29 (>3 interquartile range from 25th and 75th percentiles of European 1KGP samples on the first 4 PCs) (Supplementary Figure 1). Lists of independent variants for IBD and PCA calculations were generated using PLINK (‘--indep 50 5 2’). For the affected sib-pair (ASP) cohort genotyped on the Immunochip, we retained only one T1D sample from each family selected at random. For the GRID case and 1958 Birth control cohorts genotyped on the Immunochip, a portion of the cases overlapped the T1DGC or 1958 Birth cohorts genotyped on a genome-wide array. We thus used sample IDs from the phenotype files to remove these samples from the GRID and 1958 Birth cohorts and verified that no samples were duplicated between the Immunochip and genome-wide array datasets by checking IBD. We combined data for matched case and control cohorts based on genotyping array and country of origin for imputation. We used the TOPMed Imputation Server30 to impute genotypes into the TOPMed r2 panel7 and removed variants based on low imputation quality (R2<0.3). Following imputation, we implemented post-imputation filters to remove variants based on potential genotyping or imputation artifacts based on empirical R2 (genotyped variants with empirical R2<0.5 and all imputed variants in at least low linkage disequilibrium; LD, r2>0.3).
For the UK Biobank cohort, we downloaded imputed genotype data from the UK Biobank v3 release which were imputed using a combination of the HRC and UK10K + 1000 Genomes reference panels. We removed individuals who had withdrawn participation from the UK biobank. We used phenotype data to remove individuals of non-European descent. To resolve duplicate samples represented in both the UK biobank and other cohorts on different genotyping arrays, we calculated IBD between samples in the UK biobank and cohorts of UK origin, removing duplicated samples from the UK biobank (IBD>0.9). Following these filters, we then used a combination of ICD10 codes to define 1,445 T1D cases (T1D diagnosis, insulin treatment within a year of diagnosis, no T2D diagnosis). We defined controls as 362,050 individuals without diabetes (no T1D, T2D, or gestational diabetes diagnosis) or other autoimmune diseases (systemic lupus erythematosus, rheumatoid arthritis, juvenile arthritis, Sjögren syndrome, alopecia areata, multiple sclerosis, autoimmune thyroiditis, vitiligo, celiac disease, primary biliary cirrhosis, psoriasis, or ulcerative colitis). We removed variants with low imputation quality (R2<0.3).
For the FinnGen cohort, we downloaded GWAS summary statistics for type 1 diabetes (T1D_STRICT) from FinnGen freeze 3 (http://r3.finngen.fi/). This phenotype definition excluded individuals with type 2 diabetes from both cases and controls.
Association testing and meta-analysis
We tested variants with MAF>1×10⁻⁵ for association to T1D with firth bias reduced logistic regression using EPACTS (https://genome.sph.umich.edu/wiki/EPACTS) for non-UK Biobank cohorts or SAIGE31 (version 0.38) for the UK Biobank, using genotype dosages adjusted for sex and the first four ancestry PCs. For the UK Biobank we used SAIGE as it is designed to run on biobank-scale cohorts and with highly imbalanced ratios of cases vs controls. For FinnGen, we used association results from the freeze 3 release that were generated using SAIGE. Prior to meta-analysis, we used liftOver to convert GRCh37/hg19 into GRCh38/hg38 coordinates for the UK biobank. We then combined association results across matched cohorts through inverse-variance weighted meta-analysis. We used liftOver to convert GRCh38/hg38 back into GRCh37/hg19 coordinates for the meta-analysis. We removed variants that were unable to be converted, were duplicated after coordinate conversion, or were located on different chromosomes after conversion. In total, our association data contained summary statistics for 61,947,369 variants. To evaluate the extent to which genomic inflation was driven by the polygenic nature of T1D or population stratification, we used LD score regression32 to compare the LDSC intercept to lambda genomic control (GC). We observed an intercept of 1.07 (SE=0.03) compared to a lambda GC of 1.20, suggesting that the majority of the observed inflation was driven by polygenicity rather than population stratification.
Stochastic search and fine-mapping of independent signals
We identified 59 loci (excluding the MHC locus) with T1D risk variants reported in previous genetic studies of T1D4–6,33, and considered a locus in our study known if the most associated variant mapped within 500 kb of a previously reported T1D variant. We defined 33 novel loci where a variant reached genome-wide significance (P<5×10⁻⁸), and both mapped at least 500 kb away and was not in LD (r2<0.01) with a previously reported T1D variant. At 92 (59 known and 33 novel) loci, we defined the ‘index’ variant as the variant with strongest T1D association at the locus.
For all 92 loci, we used a 1 Mb window around the index variant as the region for fine-mapping using FINEMAP34 (version 1.4). For each region, we first filtered for variants with MAF>0.0005 and constructed pairwise LD matrices with PLINK27 ( ‘--r --square --keep-allele-order’) using the TOPMed2-imputed cohorts with genome-wide coverage (DCCT-EDIC, GENIE-ROI, GENIE-UK, GoKinD, T1DGC, WTCCC1-T1D and their respective control cohorts). We then applied FINEMAP using these matrices to conduct shotgun stochastic search and Bayesian fine-mapping using the default prior (‘--sss --n-causal-snps 10 --prob-cred-set 0.99 --prior-std 0.05’). We selected the number of independent signals (causal variants) for each region based on the configuration with the highest FINEMAP posterior probability and used 99% credible sets from the FINEMAP output for the resulting signals. We calculated the effective sample size for all credible set variants, and no credible set variant with PPA>0.01 had <50% of the maximum effective sample size. We compared fine-mapping results to a previous fine-mapping dataset8. At 56 signals in common to both studies, we calculated the number of variants in the 99% credible set and the probability of the most likely causal variant.
GWAS correlation analyses
We used LD score regression32,35 (version 1.0.1) to estimate genome-wide genetic correlations between T1D and immune diseases36–44, other diseases45–55, and non-disease traits56–74, using European subsets of GWAS where applicable. For acute pancreatitis, chronic pancreatitis, and pancreatic cancer, we used inverse variance weighted meta-analysis to combine SAIGE analysis results from the UK biobank31 (PheCodes 577.1, 577.2, and 157) and FinnGen r3 (K11_ACUTPANC, K11_CHRONPANC, C3_PANCREAS_EXALLC). We used pre-computed European 1000 Genomes LD scores to calculate correlation estimates (rg) and standard errors. We then corrected p-values for multiple tests using FDR correction and considered FDR<0.1 as significant. We also performed genetic correlation analyses using a version of the T1D meta-analysis excluding the Immunochip cohorts and observed highly similar results.
Generation of snATAC-seq libraries
Combinatorial indexing single cell ATAC-seq (snATAC-seq/sci-ATAC-seq).
snATAC-seq was performed as described previously75–77 with several modifications as described below. For the islet samples, approximately 3,000 islet equivalents (IEQ, roughly 1,000 cells each) were resuspended in 1 mL nuclei permeabilization buffer (10mM Tris-HCL (pH 7.5), 10mM NaCl, 3mM MgCl2, 0.1% Tween-20 (Sigma), 0.1% IGEPAL-CA630 (Sigma) and 0.01% Digitonin (Promega) in water) and homogenized using 1mL glass dounce homogenizer with a tight-fitting pestle for 15 strokes. Homogenized islets were incubated for 10 min at 4°C and filtered with 30 μm filter (CellTrics). For the pancreas samples, frozen tissue was pulverized with a mortar and pestle while frozen and immersed in liquid nitrogen. Approximately 22 mg of pulverized tissue was then transferred to an Eppendorf tube and resuspended in 1 mL of cold permeabilization buffer for 10 minutes on a rotator at 4°C. Permeabilized sample was filtered with a 30μm filter (CellTrics), and the filter was washed with 300 μL of permeabilization buffer to increase nuclei recovery.
Once permeabilized and filtered, nuclei were pelleted with a swinging bucket centrifuge (500×g, 5 min, 4°C; 5920R, Eppendorf) and resuspended in 500 μL high salt tagmentation buffer (36.3 mM Tris-acetate (pH = 7.8), 72.6 mM potassium-acetate, 11 mM Mg-acetate, 17.6% DMF) and counted using a hemocytometer. Concentration was adjusted to 4500 nuclei/9 μL, and 4,500 nuclei were dispensed into each well of a 96-well plate. Glycerol was added to the leftover nuclei suspension for a final concentration of 25 % and nuclei were stored at −80°C. For tagmentation, 1 μL barcoded Tn5 transposomes were added using a BenchSmart™ 96 (Mettler Toledo), mixed five times and incubated for 60 min at 37°C with shaking (500 rpm). To inhibit the Tn5 reaction, 10 μL of 40 mM EDTA were added to each well with a BenchSmart™ 96 (Mettler Toledo) and the plate was incubated at 37°C for 15 min with shaking (500 rpm). Next, 20 μL 2 x sort buffer (2 % BSA, 2 mM EDTA in PBS) were added using a BenchSmart™ 96 (Mettler Toledo). All wells were combined into a FACS tube and stained with 3 μM Draq7 (Cell Signaling). Using a SH800 (Sony), 20 nuclei were sorted per well into eight 96-well plates (total of 768 wells) containing 10.5 μL EB (25 pmol primer i7, 25 pmol primer i5, 200 ng BSA (Sigma)). Preparation of sort plates and all downstream pipetting steps were performed on a Biomek i7 Automated Workstation (Beckman Coulter). After addition of 1 μL 0.2% SDS, samples were incubated at 55°C for 7 min with shaking (500 rpm). We added 1 μL 12.5% Triton-X to each well to quench the SDS and 12.5 μL NEBNext High-Fidelity 2× PCR Master Mix (NEB). Samples were PCR-amplified (72°C 5 min, 98°C 30 s, (98°C 10 s, 63°C 30 s, 72°C 60 s) × 12 cycles, held at 12°C). After PCR, all wells were combined. Libraries were purified according to the MinElute PCR Purification Kit manual (Qiagen) using a vacuum manifold (QIAvac 24 plus, Qiagen) and size selection was performed with SPRI Beads (Beckmann Coulter, 0.55x and 1.5x). Libraries were purified one more time with SPRI Beads (Beckmann Coulter, 1.5x). Libraries were quantified using a Qubit fluorimeter (Life technologies) and the nucleosomal pattern was verified using a TapeStation (High Sensitivity D1000, Agilent). The library was sequenced on a HiSeq2500 sequencer (Illumina) using custom sequencing primers, 25% spike-in library and following read lengths: 50+43+40+50 (Read1+Index1+Index2+Read2).
Droplet-based 10x single cell ATAC-seq (scATAC-seq).
10x scATAC-seq protocol from 10x Genomics was followed: Chromium SingleCell ATAC ReagentKits UserGuide (CG000209, Rev A). Cryopreserved PBMC samples were thawed in 37°C water bath for 2 min and followed ‘PBMC thawing protocol’ in the UserGuide. After thawing cells, the pellets were resuspended again in 1 mL chilled PBS (with 0.04% PBS) and filtered with 50 μm CellTrics (04–0042-2317, Sysmex). The cells were centrifuged (300×g, 5 min, 4°C) and permeabilized with 100 μl of chilled lysis buffer (10 mM Tris-HCl pH 7.4, 10 mM NaCl, 3 mM MgCl2, 0.1% Tween-20, 0.1% IGEPAL-CA630, 0.01% digitonin and 1% BSA). The samples were incubated on ice for 3 min and resuspended with 1mL chilled wash buffer (10 mM Tris-HCl pH 7.4, 10 mM NaCl, 3 mM MgCl2, 0.1% Tween-20 and 1% BSA). After centrifugation (500×g, 5 min, 4°C), the pellets were resuspended in 100 μL of chilled Nuclei buffer (2000153, 10x Genomics). The nuclei concentration was adjusted between 3,000 to 7,000 per μl and 15,300 nuclei which targets 10,000 nuclei was used for the experiment. For pancreas tissue (pulverized as described above), approximately 31.7 mg of pulverized tissue was transferred to a LoBind tube (Eppendorf) and resuspended in 1 mL of cold permeabilization buffer (10mM Tris-HCL (pH 7.5), 10mM NaCl, 3mM MgCl2, 0.1% Tween-20 (Sigma), 0.1% IGEPAL-CA630 (Sigma), 0.01% Digitonin (Promega) and 1% BSA (Proliant 7500804) in water) for 10 min on a rotator at 4°C. Permeabilized nuclei were filtered with 30 μm filter (CellTrics). Filtered nuclei were pelleted with a swinging bucket centrifuge (500×g, 5 min, 4°C; 5920R, Eppendorf) and resuspended in 1 mL Wash buffer (10mM Tris-HCL (pH 7.5), 10mM NaCl, 3mM MgCl2, 0.1% Tween-20, and 1% BSA (Proliant 7500804) in molecular biology-grade water). Nuclei wash was repeated once. Next, washed nuclei were resuspended in 30 μL of 1X Nuclei Buffer (10X Genomics). Nuclei were counted using a hemocytometer, and finally the nuclei concentration was adjusted to 3,000 nuclei/μL. 15,360 nuclei were used as input for tagmentation.
Nuclei were diluted to 5 μl with 1X Nuclei buffer (10x Genomics) and, mixed with ATAC buffer (10x Genomics) and ATAC enzyme (10x Genomics) for tagmentation (60 min, 37°C). Single cell ATAC-seq libraries were generated using the (Chromium Chip E Single Cell ATAC kit (10x Genomics, 1000086) and indexes (Chromium i7 Multiplex Kit N, Set A, 10x Genomics, 1000084) following manufacturer instructions. Final libraries were quantified using a Qubit fluorimeter (Life technologies) and the nucleosomal pattern was verified using a TapeStation (High Sensitivity D1000, Agilent). Libraries were sequenced on a NextSeq 500 and HiSeq 4000 sequencer (Illumina) with following read lengths: 50+8+16+50 (Read1+Index1+Index2+Read2).
Single cell chromatin accessibility data processing
Prior to read alignment, we used trim_galore (version 0.4.4) to remove adapter sequences from reads using default parameters. For combinatorial barcoding data, we aligned reads to the hg19 reference genome using bwa mem78 (version 0.7.17-r1188; ‘-M -C’) and removed low mapping quality (MAPQ<30), secondary, unmapped, and mitochondrial reads using samtools79 (version 1.10). To remove duplicate sequences on a per-barcode level, we used the MarkDuplicates tool from picard (‘BARCODE_TAG’). For droplet-based 10x data, we used Cell Ranger ATAC (version 1.1.0) to process, align, and remove duplicate reads. For each tissue and snATAC-seq technology, we used log-transformed read depth distributions from each experiment to determine a threshold separating real cell barcodes from background noise. We used >500 total reads for combinatorial barcoding snATAC-seq and >2,300–4,000 total reads, as well as >0.3 fraction of reads in peaks for 10x snATAC-seq experiments (Supplementary Figure 7a).
Single cell chromatin accessibility clustering
We identified snATAC-seq clusters using a previously described pipeline with a few modifications75. For each experiment, we first constructed a counts matrix consisting of read counts in 5 kb windows for each cell. Using scanpy80 (version 1.4.4.post1), we normalized cells to a uniform read depth and log-transformed counts. We extracted highly variable (hv) windows (‘min_mean=0.01, min_disp=0.25’) and regressed out the total log-transformed read depth within hv windows (usable counts). We then merged datasets from the same tissue and performed PCA to extract the top 50 PCs. We used Harmony81 (version 1.0) to correct the PCs for batch effects across experiments, using categorical covariates including donor-of-origin, biological sex, and snATAC-seq assay technology. We used the corrected components to construct a 30 nearest neighbor graph using the cosine metric, which we used for UMAP dimensionality reduction (‘min_dist=0.3’) and clustering with the Leiden algorithm82 (‘resolution=1.5’).
Prior to combining cells across all tissues, we performed iterative clustering to identify and remove cells with low fraction of reads in peaks (using preliminary peaks called from data in bulk) or low usable counts (islets: 948, pancreas: 2,588, PBMCs: 5,268 cells removed in total). Next, after removing low-quality cells and repeating the previous clustering steps, we sub-clustered the resulting main clusters at high resolution (‘resolution=3.0’) to identify sub-clusters containing potential doublets (islets: 886, pancreas: 4,495, PBMCs: 5,844 cells removed in total). We noted that these sub-clusters tended to have higher average usable counts, promoter usage, and accessibility at more than one marker gene promoter. After removing 20,029 low-quality or potential doublet cells, we performed a final round of clustering using experiments from all tissues, including tissue-of-origin as another covariate. We further removed 672 cells mapping to improbable cluster assignments (islet or pancreatic cells in PBMC clusters or vice versa). After all filters, we ended up with 131,554 cells mapping to 28 distinct clusters with consistent representation across samples from the same tissue (Supplementary Figure 7b). We cataloged known marker genes for each cell type using a combination of literature search and PanglaoDB83 (Supplementary Table 6) and assessed gene accessibility (sum of read counts across each gene body) to assign labels to each cluster.
Single cell gene expression clustering
We compiled publicly available scRNA-seq datasets of peripheral blood (10x Genomics; v1 Chemistry – 3k, 6k, and 33k; v2 Chemistry – 4k and 8k, v3 Chemistry – 5k and 10k, v3.1 Chemistry – 5k, 10k single indexed, and 10k dual indexed) and pancreatic islets84. We re-processed each dataset using Cell Ranger RNA (version 4.0.0) with the GRCh37 reference genome and removed cells with <500 genes expressed (non-zero counts). We extracted hv genes for PBMCs and pancreatic islets separately and merged both lists to obtain a single set of hv genes. For each sample, we used count matrices as input for scanpy80 (version 1.4.4.post1), normalized counts for each cell to uniform read depth, log-transformed the normalized counts, and regressed out the log total counts for hv genes. We then merged all datasets and extracted the top 100 PCs using PCA. We used Harmony81 (version 1.0) to correct PCs for covariates including the experiment, donor, tissue, and biological sex. We constructed a 30 nearest neighbor graph using the cosine metric, performed UMAP dimensionality reduction (‘min_dist=0.3’), and clustered with the Leiden algorithm82 (‘resolution=1.25’). We performed iterative clustering to remove 10,014 low quality and 5,286 potential doublet cells, leaving 90,495 cells for the cell type-resolved expression reference map. We used a combination of literature search and PanglaoDB83 (Supplementary Table 6) to assign labels to each cluster. For each cell type, we normalized aggregated reads from individual cells to derive TPM for each gene.
Cataloging cell type-resolved cCREs
We identified chromatin accessibility peaks with MACS285 (version 2.1.2) by calling peaks on aggregated reads from each cluster. In brief, we extracted reads from all cells within a given cluster, shifted reads aligned to the positive strand by +4 bp and reads aligned to the negative strand by −5 bp, and centered the reads. We then used MACS2 to call peaks (‘--nomodel --keep-dup-all’) and removed peaks overlapping ENCODE blacklisted regions2,86. We then merged peaks from all 28 clusters with bedtools87 (version 2.26.0) to create a consistent set of 448,142 cCREs for subsequent analyses.
To compare accessible chromatin profiles from snATAC-seq to those from bulk ATAC-seq on FACS purified cell types, we reprocessed published ATAC-seq data from sorted pancreatic88 and unstimulated immune cells89. We created pseudobulk profiles from the snATAC-seq data for each donor and cluster, retaining those that contained information from >50 cells. We then extracted read counts in the 448,142 cCREs for all sorted and pseudobulk profiles. We used PCA to extract the top 20 principal components and used UMAP for dimensionality reduction and visualization (‘min_dist=0.5, n_neighbors=80’).
Defining cell type-specific cCREs
To identify cCREs with accessibility levels most specific to each cluster, we used logistic regression models for each cCRE treating each cell as an individual data point. We performed separate regressions for each cluster, with binary cluster assignment and the covariates donor-of-origin and the log usable count as predictors and binary accessibility of the peak as the outcome, to calculate chromatin accessibility (CA) t-statistics. For a given cluster, we defined cCREs with activity most specific to that cluster by taking the top 1000 cCREs with the highest CA t-statistics, after first filtering out cCREs which also had high CA t-statistics for other clusters (cCRE cell type CA t-statistics>90th percentile in >2 other cell types). The cCREs were all significant after Bonferroni correction for the number of peaks (P<1.1×10⁻⁷) except for pancreatic CD8+ T (n=428 after correction), regulatory T (n=347) and memory CD8+ T (n=175). We then used GREAT90 (version 3) to annotate gene ontology terms enriched in each set of cell type-specific cCREs compared to a background of all cCREs.
To assess whether cell type-specific cCREs tended to be close in proximity to genes with cell type-specific expression, we defined 100 kb windows around the midpoint of each cell type-specific cCRE and annotated genes with overlapping TSS. For each cell type that had a corresponding cluster in scRNA-seq, we compared whether genes around cell type-specific cCREs for that cell type had higher gene expression specificity scores than the rest of the cell type-specific cCREs using two-sided Welch’s t-tests. We collapsed cell type-specific cCREs for cell types with more than one state in snATAC-seq but only one state in scRNA-seq.
Comparing single cell chromatin accessibility and gene expression clusters
To compare cell types from snATAC-seq and scRNA-seq, we first derived gene expression t-statistics for each gene using linear regression models separately for each cluster of log-transformed read count as a function of binary cluster assignment, donor-of-origin, and log sequencing depth, treating cells as individual data points. For each gene, we also used chromatin accessibility t-statistics for promoter cCREs (see “Defining cell type-specific cCREs”). For each scRNA-seq cluster, we extracted the top 100 most specific genes based on the gene expression t-statistic. Using a merged list of the most specific genes across all clusters, we compared gene expression and promoter accessibility t-statistics using Pearson correlation.
Single cell motif enrichment
We estimated TF motif enrichment z-scores for each cell using chromVAR91 (version 1.5.0) by following the steps outlined in the user manual. First, we constructed a sparse binary matrix encoding read overlap with merged peaks for each cell. For each merged peak, we estimated the GC content bias to obtain a set of matched background peaks. To ensure a motif enrichment value for each cell, we did not apply any additional filters based on total reads or the fraction of reads in peaks. Next, using 580 TF motifs within the JASPAR 2018 CORE vertebrate (non-redundant) set92, we computed GC bias-corrected enrichment z-scores (chromVAR deviation scores) for each cell. For each cell type, we considered a TF motif enriched if the average z-score across cells was greater than 2. We used the TFClass database93 (http://tfclass.bioinf.med.uni-goettingen.de/) to group enriched TF motifs into structural sub-families. We determined the expression of all TFs within the subfamily in each cell type identified in scRNA-seq and considered TFs expressed in a cell type with TPM>1.
Single cell co-accessibility
We used Cicero94 (version 1.3.3) to calculate co-accessibility scores between pairs of peaks for each cluster. As in the single cell motif enrichment analysis, we started from a sparse binary matrix. For each cluster, we only retained merged peaks that overlapped peaks from the cluster. Within each cluster, we aggregated cells based on the 50 nearest neighbors and used cicero to calculate co-accessibility scores, using a 1 Mb window size and a distance constraint of 500 kb. We then defined promoters as ±500 bp from the TSS of protein coding transcripts from GENCODE v1995 to annotate co-accessibility links between gene promoters and distal cCREs (non-promoter cCREs).
To assess whether genes with co-accessible links between the promoter and distal cCREs (co-accessible genes; co-accessibility score>0.05) were expressed more often than non-co-accessible genes (co-accessibility score<0) within each cell type, we separated co-accessible links into bins based on the distance between the gene promoter and distal cCRE. Within each bin, we then compared the fraction of genes expressed in the cell type (TPM>1 from scRNA-seq) between co-accessible and non-co-accessible genes using 2-sided Fisher’s exact tests. We collapsed co-accessible links for cell types with more than one state in snATAC-seq but only one state in scRNA-seq (alpha, beta, and delta cells). No comparison was made for pancreatic CD8+ T cells, which did not have a corresponding cluster in scRNA-seq.
GWAS enrichment analyses
We used LD score regression32,96,97 (version 1.0.1) to calculate genome-wide enrichment z-scores for 32 diseases and traits including T1D. We obtained GWAS summary statistics for autoimmune and inflammatory diseases (immune-related)36–44, other diseases45–53, and quantitative endophenotypes56–65, and where necessary, we filled in variant IDs and alleles. Using ‘munge_sumstats.py’, we converted summary statistics to the LD score regression standard format. For each cluster, we considered overlap with chromatin accessibility peaks as a binary annotation for variants. Then, we computed annotation-specific LD scores by following the instructions for creating partitioned LD scores. We estimated enrichment coefficient z-scores for each annotation relative to the background annotations in the baseline-LD model (version 2.2). Using the enrichment z-scores, we computed two-sided p-values to assess significance and corrected for multiple tests using the Benjamini-Hochberg procedure. We also calculated GWAS enrichment z-scores for T1D using a version of the meta-analysis excluding the Immunochip cohorts and observed highly similar enrichment results.
From the full GWAS summary statistics, we first extracted variants with MAF>0.05 and calculated approximate Bayes factors98 for each variant, assuming prior variance in allelic effects = 0.04. We then used fgwas99 (version 0.3.6) to estimate T1D enrichment for common variants (MAF>0.05) within cell type-specific cCREs using an average window size of 1 Mb also including annotations for coding exons, 3’/5’UTR regions and 1 kb upstream of the transcription start site (TSS) from GENCODE in each model. We considered cell type annotations enriched where ln(95% CI lower bound) >0 and depleted where ln(95% CI upper bound) <0.
Annotating cell type mechanisms of variants at fine mapped signals
We compared the proportion of credible set variants with PPA>0.50 overlapping a cCRE compared to other credible set variants using a two-sided Fisher’s exact test. Among credible set variants in cCREs, we further compared the proportion of credible set variants with PPA>0.50 in a cCRE co-accessible with a gene promoter compared to other credible set variants using a two-sided Fisher’s exact test.
For each T1D signal, we calculated the cumulative posterior probability of all credible set variants overlapping cCREs active in T cells, monocytes, plasmacytoid dendritic cells, beta cells, acinar cells and ductal cells. For each signal overlapping cCREs, we annotated genes within 1 Mb of the index variant that were (i) expressed in the same cell type(s) (TPM>1 from scRNA-seq) and (ii) co-accessible with a cCRE harboring a credible set variant with PPA>0.01.
Luciferase reporter assays
We tested for allelic differences in enhancer activity at rs7795896 using multiple constructs. First, we cloned a 180 bp sequence of human DNA (Coriell) containing the reference or alternate allele into the luciferase reporter vector pGL4.23 (Promega) in the forward direction using the restriction enzymes SacI and KpnI. Second, we cloned a larger 594 bp sequence of human DNA (Coriell) containing the rs7795896 reference allele corresponding to the coordinates of the ductal-specific cCRE into pGL4.23 in the forward direction using the restriction enzymes SacI and KpnI. We introduced the alternate allele via SDM using the NEB Q5 Site Directed Mutagenesis kit (New England Biolabs) on 1 ng plasmid containing the reference allele and primers designed using the NEBaseChanger v.1.2.8 software. Sequence identity for all plasmids was confirmed with Sanger sequencing using the RV3 primer. Cloning primers were designed using Primer3 version 0.4.0. Primer sequences for cloning and SDM are listed in Supplementary Table 11.
We obtained Capan-1 cells from ATCC, and cells were authenticated by ATCC using karyotyping, morphology and PCR-based approaches. Cells tested negative for mycoplasma contamination. We grew Capan-1 cells, a model for ductal cells100, to approximately 70% confluency according to ATCC culture recommendations in 6-well or 24-well plates and fed complete growth media the day before transfection. For the 180bp construct, 2500 ng experimental or empty (pGL4.23) vector was co-transfected with 50 ng pRL-SV40 per sample using Lipofectamine 3000 (Invitrogen) into Capan-1 cells grown in a 6-well plate. For the 594 bp construct, 500 ng experimental or empty vector was co-transfected with 10 ng pRL-TK per sample using Lipofectamine 3000 (Invitrogen) into Capan-1 cells grown in a 24-well plate. The experiment was also repeated using 50 ng pRL-TK per sample. For all experiments, 48 hours post-transfection samples were assayed using the Dual-Glo Luciferase Assay System (Promega). We normalized Firefly:Renilla ratios with respect to the empty vector and used either two-sided, two-way ANOVA or two-sided Student’s T-test to compare luciferase activity between the two alleles.
Electrophoretic mobility shift assay
We ordered double-stranded 5’ biotinylated and corresponding unlabeled (cold) oligonucleotides of 16 bp centered on rs7795896 with the reference and alternate alleles from Integrated DNA Technologies. Oligo sequences are listed in Supplementary Table 11. We performed EMSA using the LightShift Chemiluminescent EMSA kit (Thermo Fisher) according to manufacturer’s instructions with the following adjustments: 100 fmol of biotinylated duplex probe per reaction, and 20 pmol of the same-allele non-biotinylated duplex “cold” probe in competition reactions (200× molar excess of the biotin probe). We used the NE-PER Nuclear Protein and Cytoplasmic Extraction Reagents (Thermo Fisher) kit to extract nuclear protein from Capan-1 cells and used 2uL of nuclear extract per binding reaction, corresponding to approximately 5–15ug of nuclear protein per reaction. We quantified bound and free probe (unbound) band intensity using ImageJ (v.1.53) and calculated the ratio of bound to unbound intensity. We then averaged bound ratios for replicates of each allele and compared ratios between alleles.
CRISPR inactivation of enhancer element
We obtained HEK293T cells from ATCC, and cells were authenticated by ATCC using karyotyping, morphology and PCR-based approaches. Cells tested negative for mycoplasma contamination. We maintained HEK293T cells in DMEM containing 100 units/mL penicillin and 100 mg/mL streptomycin sulfate supplemented with 10% fetal bovine serum. To generate CRISPRi lentiviral expression vectors, we designed guide RNA sequences to target the enhancer containing rs7795896 or the CFTR promoter. These guide RNAs, as well as a non-targeting control guide RNA, were placed downstream of the human U6 promoter in the pLV hU6-sgRNA hUbC-dCas9-KRAB-T2a-Puro backbone (Addgene, plasmid #71236). Targeting guide RNAs were designed using Benchling and selected to maximize both on-target binding101 and guide specificity102. The non-targeting control guide RNA was selected from a previously validated genome-wide library103. Guide RNA sequences and targeted regions are listed in Supplementary Table 11. Higher scores indicate greater on-target binding and specificity.
We generated high-titer lentiviral supernatants by co-transfection of the resulting plasmid and lentiviral packaging constructs into HEK293T cells. Specifically, we co-transfected CRISPRi vectors with the pCMV-R8.74 (Addgene, #22036) and pMD2.G (Addgene, #12259) expression plasmids into HEK293T cells using a 1mg/ml PEI solution (Polysciences). We collected lentiviral supernatants at 48 and 72 hours after transfection and concentrated lentiviruses by ultracentrifugation for 120 min at 19,500 rpm using a Beckman SW28 ultracentrifuge rotor at 4°C. Lentiviral titers were subsequently determined using a qPCR Lentivirus Titer Kit (Abm Bio), and aliquots were stored at −80°C.
We obtained Capan-1 pancreatic ductal adenocarcinoma cell lines from ATCC and cultured using Iscove’s Modified Dulbecco’s Media with 20% fetal bovine serum, 100 units/mL penicillin, and 100 mg/mL streptomycin sulfate. 24 hours prior to transduction, we passaged cells into a 12-well plate at a density of 100,000 cells per well. The following day, we added fresh medium containing 8μg/mL polybrene and concentrated CRISPRi lentivirus at an MOI of 40 to each well. For each condition (1 non-targeting guide RNA, 3 enhancer-targeting guide RNAs, and 1 promoter-targeting guide RNA) we transduced 3 wells for a total of 15 wells. We additionally included 3 wells of mock-transduced cells without lentivirus. We incubated the cells at 37°C for 30 minutes and then spun them in a centrifuge for 1 hour at 30°C at 950×g. 6 hours later, we replaced viral medium with fresh base culture medium for cell recovery. After 48 hours, we replaced medium daily with the addition of 1μg/mL puromycin for an additional 72 hours, at which point all mock-transduced cells were killed. We reduced the concentration of puromycin to 0.5 μg/mL and cultured cells with daily medium changes for an additional week before passaging each cell line into a 48-well plate at a density of approximately 100,000 cells per well. The following morning, we harvested cells from each condition and isolated RNA using the RNeasy® Micro Kit (Qiagen) according to the manufacturer’s instructions.
For qRT-PCR, we performed cDNA synthesis using the iScript™ cDNA Synthesis Kit (Bio-Rad) and 250 ng of isolated RNA per reaction. We performed qRT-PCR reactions in triplicate with 5 ng of template cDNA per reaction using a CFX96™ Real-Time PCR Detection System and the iQ™ SYBR® Green Supermix (Bio-Rad). We used PCR of the TATA binding protein (TBP) coding sequence as an internal control, quantified relative expression via double delta CT analysis, and compared relative expression using two-sided ANOVA (enhancer inactivation versus non-targeting control) or a two-sided Student’s t-test (promoter inactivation versus non-targeting control). Genes with CT values greater than 34 were considered as not expressed. We also evaluated changes in expression of the puromycin resistance gene and the dCAS9 gene as additional controls. For eukaryotic genes, each primer pair was designed to span an exon-exon junction. Primers used for qPCR are listed in Supplementary Table 11.
Colocalization and deconvolution of the pancreas CFTR eQTL
We obtained GTEx v714 eQTL summary statistics for pancreas tissue from 220 samples and used effect size (beta) and standard error estimates from the regression model for CFTR expression to calculate approximate Bayes factors98 for each variant, assuming prior variance in allelic effects = 0.04. We considered all variants in a 500 kb window around the T1D index variant at CFTR (rs7795896) tested in both the GWAS and eQTL datasets and used coloc104 (version 4.0.4) to calculate the probability that the variants driving T1D and eQTL signals were shared, using prior probabilities PPT1D=1×10⁻⁴, PPeQTL=1×10⁻⁴, and PPshared=1×10⁻⁵. We considered the T1D and CFTR eQTL signals colocalized based on the probability that they were shared (PPshared) >0.9. We applied eCAVIAR105 (version 2.2) using variants in a 500 kb window tested for both T1D and eQTL association using LD calculated from EUR samples in 1000 Genomes29 and considered variants with CLPP>0.01 to be candidate causal variants for a shared signal.
We used MuSiC106 (version 0.1.1) to estimate the proportions of major pancreatic cell types (acinar, duct, stellate, alpha, beta, delta, gamma) in each GTEx v7 pancreas sample . As input, we used raw count matrices from scRNA-seq of pancreatic cell types with labels from the gene expression reference map and GTEx v7 pancreas samples. For each cell type, we used the proportion as an interaction term and constructed linear models of TMM-normalized CFTR expression as a function of the interaction between genotype dosage and cell type proportion, accounting for covariates used by GTEx including sex, sequencing platform, 3 genotype PCs, and 28 inferred PCs from the expression data. From the original 30 inferred PCs, we excluded inferred PCs 2 and 3 because they were highly correlated with acinar cell proportion (Spearman’s ρ>0.7). No remaining PCs were highly correlated (Spearman’s ρ<0.3) with the proportions of other cell types.
Phenotype associations at T1D signals
We tested association of the T1D index variant at CFTR (rs7795896) for pancreatic and autoimmune disease phenotypes. For acute pancreatitis, chronic pancreatitis, and pancreatic cancer, we used inverse variance weighted meta-analysis to combine SAIGE analysis results from the UK biobank31 (PheCodes 577.1, 577.2, and 157) and FinnGen (K11_ACUTPANC, K11_CHRONPANC, C3_PANCREAS_EXALLC). As mutations that cause cystic fibrosis (CF) map to this locus, which are risk factors for pancreatitis and pancreatic cancer, we determined the impact of the most common CF mutation F508del/rs199826652 on the association results for rs7795896. For T1D, we tested for association of rs7795896 conditional on F508del/rs199826652 in all cohorts except for FinnGen and observed no evidence for a difference in T1D association. For pancreatitis and pancreatic cancer, we identified F508del/rs199826652 carriers in UK Biobank and repeated the association analysis for these phenotypes in UK biobank data after removing these individuals and observed no evidence of a change in the effect of rs7795896.
We identified T1D signals where the risk allele had at least nominal association (P<0.05) with increased risk of acute pancreatitis, chronic pancreatitis, or pancreatic cancer. We then tested whether these T1D signals had a difference in cPPA in exocrine cell cCREs or T cell cCREs compared to other T1D signals using a two-sided Student’s T-test.
Human participant ethics
Genotype data obtained from dbGAP, WTCCC, and UK Biobank were used in accordance with approved research plans for these data as obtained from the respective data repositories. Tissue samples for pancreas and peripheral blood were obtained from external biorepositories nPOD and Hemacare, and all individuals gave consent for the use of tissue samples. All genotype data and tissue samples were de-identified prior to being obtained and all studies were approved by the Institutional Review Board of UCSD.
Extended Data
Extended Data Figure 1. Independent association signals at T1D risk loci.
Bayes factors (natural log-transformed) for independent association signals at the known PTPN2 locus (left) and the novel BCL11A locus (right). Variants are colored based on linkage disequilibrium (r2) with the index variant for each signal.
Extended Data Figure 2. Rare variants with large effects on T1D risk.
(a) The relationship between minor allele frequency and T1D odds ratios (OR) for index variants at 136 T1D signals. Signals with common index variants and larger effect size estimates (PTPN22 1:114377568:A:G and INS 11:2182224:A:T) or rare index variants (MAF<0.005) are labeled. Points and lines represent estimates for OR and 95% CI. (b) Comparison of OR across cohorts for rare variants. Missing values indicate that the variant was not tested in the cohort. Points and lines represent estimates for OR and 95% CI.
Extended Data Figure 3. Genetic correlations between T1D and other traits.
Genetic correlations between T1D and immune-related diseases (left), other diseases (middle), and non-disease traits (right), adj.=adjusted, circ.=circumference. Two-sided p-values are adjusted for multiple comparisons with false discovery rate (FDR). Colors indicate significance: red – correlation is significant after FDR correction (FDR<0.1), black – correlation is nominally significant (p<0.05) but not significant after FDR correction, and grey – correlation is not significant. Points and lines represent genetic correlation estimates and 95% CI.
Extended Data Figure 4. Annotations derived from single cell chromatin accessibility of T1D-relevant tissues.
(a) Relative gene accessibility (column-normalized chromatin accessibility reads in gene bodies) showing examples of marker genes used to identify cluster labels. Aggregated chromatin accessibility profiles in a 50 kb window around selected marker genes (bottom). (b) Single cell motif enrichment z-scores (left) and expression of motif subfamily members (right) for examples of TFs with lineage-, cell type-, or cell state-specific motif enrichment and expression. TFs with matching motif enrichment and expression are highlighted. (c) Co-accessibility between AQP1 and cCREs in ductal cells (left) and CEL and cCREs in acinar cells (right).
Extended Data Figure 5. Single cell RNA-seq reference map of PBMCs and pancreatic islets.
(a) Clustering of 90,495 expression profiles from single cell RNA-seq experiments of peripheral blood mononuclear cells and pancreatic islets from published studies. Cells are plotted on the first two UMAP components and colored based on cluster assignment. The number of cells in each cluster is shown next to its corresponding label. HSC, hematopoietic stem cell. γδ T, gamma delta T. pDC, plasmacytoid dendritic. (b) Relative gene expression (average expression for all cells within a cluster and scaled from 0–100 across clusters) showing examples of marker genes used to assign cluster labels. (c) Pearson correlation coefficient between gene expression and promoter accessibility specificity scores using a list containing the top 100 most specific genes for each scRNA-seq cluster found in snATAC-seq.
Extended Data Figure 6. GWAS enrichment for T1D compared to other diseases and traits.
Stratified LD score regression coefficient z-scores for autoimmune and inflammatory diseases (top), other diseases (middle), and non-disease quantitative endophenotypes (bottom) for cCREs active in immune and pancreatic cell types. Two sided p-values were calculated from z-scores and multiple test correction was performed using FDR. ***FDR<0.001 **FDR<0.01 *FDR<0.1.
Extended Data Figure 7. Fine mapped variants linked to exocrine-specific genes.
(a) The GP2 locus contains three variants in a distal cCRE co-accessible with the GP2 promoter in acinar cells which account for the majority of the causal probability (cPPA=0.98). Chromatin accessibility at both the distal cCRE and the GP2 promoter is highly specific to acinar cells. (b) Variant rs72802342 at the CTRB1/2/BCAR1 locus overlaps a distal cCRE co-accessible with the CTRB2 and CTRB1 promoters in acinar cells. Chromatin accessibility at the CTRB1 and CTRB2 promoters is highly specific to acinar cells. Variants contained in the 99% credible set are circled in black.
Extended Data Figure 8. rs7795896 has allelic effects on ductal enhancer activity.
(a) Relative luciferase units (RLU) for reporter containing 594 bp sequence surrounding rs7795896 in Capan 1 (n=6; 2 batches × 3 transfections). Center line, median; box limits, 25th and 75th percentiles; whiskers extend to 1.5× the IQR from the 25th and 75th percentiles. P-value by two-sided, two-way ANOVA. (b) Luciferase reporter assay in Capan-1 cells transfected with pGL4.23 minimal promoter plasmids containing rs7795896 in the forward orientation. Relative luciferase units (RLU) represent Firefly:Renilla ratios normalized to control cells transfected with the empty pGL4.23 vector. P-value by two-sided Student’s t-test. (c) Electrophoretic mobility shift assay with nuclear extract from Capan-1 using probes for rs7795896 alleles, with or without 200× unlabeled competitor probe (200× comp.). Quantification of the bound fraction (specific binding / free probe). Data are from n=1 experiment. (d) rs7795896 overlaps histone marks of active enhancers (H3K4me1, H3K27ac; region: chr7:117,050,000–117,125,000, hg19) but not promoters (H3K4me3) in pancreatic ductal adenocarcinoma cell lines (PDAC: Capan-1, Capan-2, and CFPAC-1). rs7795896 overlaps a ChIP-seq peak for the transcription factor HNF1B in CFPAC-1 cells and a predicted HNF1B motif. (e) Relative expression for genes in a 2 Mb window around rs7795896 with non-zero expression and the puromycin resistance and dCas9 genes. Ctrl n=3 biological replicates; Enh n=9, 3 sgRNAs × 3 biological replicates; Prom n=3 biological replicates. Data are mean ± 95% CI. P-values by two-sided Student’s t-test (Prom vs Ctrl) or two-sided ANOVA (Enh vs Ctrl); NS, not significant.
Extended Data Figure 9. rs7795896 affects CFTR expression levels in ductal cells.
(a) Bayesian colocalization of T1D signal and CFTR pancreas eQTL. Variants in the T1D credible set are circled. (b) Expression of pancreatic cell type marker genes from scRNA-seq. (c) Proportions of selected pancreatic cell types estimated by MuSiC for 220 bulk pancreas RNA-seq samples from the GTEx v7 release using single cell expression profiles. (d) -log10 transformed two-sided uncorrected p-values from linear regression interaction between dosage and cell type proportion for the CFTR pancreas eQTL.
Extended Data Figure 10. Relationship between T1D and other pancreatic diseases.
(a) rs7795896 GWAS association for T1D (from full meta-analysis), pancreatic disease, and autoimmune disease. Points and lines represent odds ratio estimates and 95% CI. Two-sided p-values from GWAS meta-analysis are unadjusted for multiple comparisons. (b) Variants regulating genes with specialized exocrine pancreas function influence T1D risk, and we hypothesize these effects are mediated through inflammation and immune infiltration.
Supplementary Material
ACKNOWLEDGEMENTS
This work was supported by NIH grants DK112155, DK120429 and DK122607 to K.J.G and M.S., and T32 GM008666 to R.G. We thank Samantha Kuan in the Ren Lab at the LICR for assistance with sequencing. Additional acknowledgements for each cohort are listed in the Supplementary Information.
Footnotes
CODE AVAILABILITY
Code used for processing snATAC-seq datasets and clustering cells is available at https://github.com/kjgaulton/pipelines/tree/master/T1D_snATAC_pipeline.
COMPETING INTERESTS
K.J.G is a consultant for Genentech and holds stock in Vertex Pharmaceuticals; neither is related to the work in this study. The other authors declare no competing interests.
ADDITIONAL INFORMATION
Supplementary Information is available for this paper.
DATA AVAILABILITY
Full summary statistics for the T1D GWAS have been deposited into the NHGRI-EBI GWAS catalog with accession number GCST90014023 and can be downloaded from http://ftp.ebi.ac.uk/pub/databases/gwas/summary_statistics/GCST90014001-GCST90015000/GCST90014023/. Sequencing data for snATAC-seq have been deposited into the NCBI Gene Expression Omnibus (GEO) with accession number GSE163160 and are available at https://www.ncbi.nlm.nih.gov/geo/query/acc.cgi?acc=GSE163160. Data obtained from the TFClass database are available at http://tfclass.bioinf.med.uni-goettingen.de/ and from the PanglaoDB database at https://panglaodb.se/.
REFERENCES
- 1.Claussnitzer M. et al. A brief history of human disease genetics. Nature 577, 179–189 (2020). [DOI] [PMC free article] [PubMed] [Google Scholar]
- 2.ENCODE Project Consortium. An integrated encyclopedia of DNA elements in the human genome. Nature 489, 57–74 (2012). [DOI] [PMC free article] [PubMed] [Google Scholar]
- 3.Katsarou A. et al. Type 1 diabetes mellitus. Nat. Rev. Dis. Primer 3, 17016 (2017). [DOI] [PubMed] [Google Scholar]
- 4.Onengut-Gumuscu S. et al. Fine mapping of type 1 diabetes susceptibility loci and evidence for colocalization of causal variants with lymphoid gene enhancers. Nat. Genet 47, 381–386 (2015). [DOI] [PMC free article] [PubMed] [Google Scholar]
- 5.Barrett JC et al. Genome-wide association study and meta-analysis find that over 40 loci affect risk of type 1 diabetes. Nat. Genet 41, 703–707 (2009). [DOI] [PMC free article] [PubMed] [Google Scholar]
- 6.Bradfield JP et al. A Genome-Wide Meta-Analysis of Six Type 1 Diabetes Cohorts Identifies Multiple Associated Loci. PLOS Genet. 7, e1002293 (2011). [DOI] [PMC free article] [PubMed] [Google Scholar]
- 7.Taliun D. et al. Sequencing of 53,831 diverse genomes from the NHLBI TOPMed Program. bioRxiv 563866 (2019) doi: 10.1101/563866. [DOI] [PMC free article] [PubMed] [Google Scholar]
- 8.Aylward A, Chiou J, Okino M-L, Kadakia N. & Gaulton KJ Shared genetic risk contributes to type 1 and type 2 diabetes etiology. Hum. Mol. Genet (2018) doi: 10.1093/hmg/ddy314. [DOI] [PubMed] [Google Scholar]
- 9.Raeder H. et al. Mutations in the CEL VNTR cause a syndrome of diabetes and pancreatic exocrine dysfunction. Nat. Genet 38, 54–62 (2006). [DOI] [PubMed] [Google Scholar]
- 10.Ramos PS et al. A comprehensive analysis of shared loci between systemic lupus erythematosus (SLE) and sixteen autoimmune diseases reveals limited genetic overlap. PLoS Genet. 7, e1002406 (2011). [DOI] [PMC free article] [PubMed] [Google Scholar]
- 11.Gibson-Corley KN, Meyerholz DK & Engelhardt JF Pancreatic Pathophysiology in Cystic Fibrosis. J. Pathol 238, 311–320 (2016). [DOI] [PMC free article] [PubMed] [Google Scholar]
- 12.Sharer N. et al. Mutations of the cystic fibrosis gene in patients with chronic pancreatitis. N. Engl. J. Med 339, 645–652 (1998). [DOI] [PubMed] [Google Scholar]
- 13.Diaferia GR et al. Dissection of transcriptional and cis-regulatory control of differentiation in human pancreatic cancer. EMBO J. 35, 595–617 (2016). [DOI] [PMC free article] [PubMed] [Google Scholar]
- 14.Consortium GTEx et al. Genetic effects on gene expression across human tissues. Nature 550, 204–213 (2017). [DOI] [PMC free article] [PubMed] [Google Scholar]
- 15.McWilliams RR et al. Cystic fibrosis transmembrane conductance regulator (CFTR) gene mutations and risk for pancreatic adenocarcinoma. Cancer 116, 203–209 (2010). [DOI] [PMC free article] [PubMed] [Google Scholar]
- 16.Noone PG et al. Cystic fibrosis gene mutations and pancreatitis risk: relation to epithelial ion transport and trypsin inhibitor gene mutations. Gastroenterology 121, 1310–1319 (2001). [DOI] [PubMed] [Google Scholar]
- 17.Virostko J. et al. Pancreas Volume Declines During the First Year After Diagnosis of Type 1 Diabetes and Exhibits Altered Diffusion at Disease Onset. Diabetes Care 42, 248–257 (2019). [DOI] [PMC free article] [PubMed] [Google Scholar]
- 18.Campbell-Thompson M, Rodriguez-Calvo T. & Battaglia M. Abnormalities of the Exocrine Pancreas in Type 1 Diabetes. Curr. Diab. Rep 15, 79 (2015). [DOI] [PMC free article] [PubMed] [Google Scholar]
- 19.Camunas-Soler J. et al. Patch-Seq Links Single-Cell Transcriptomes to Human Islet Dysfunction in Diabetes. Cell Metab. 31, 1017–1031.e4 (2020). [DOI] [PMC free article] [PubMed] [Google Scholar]
- 20.Fasolino M. et al. Multiomics single-cell analysis of human pancreatic islets reveals novel cellular states in health and type 1 diabetes. bioRxiv 2021.01.28.428598 (2021) doi: 10.1101/2021.01.28.428598. [DOI] [Google Scholar]
- 21.Hart NJ et al. Cystic fibrosis-related diabetes is caused by islet loss and inflammation. JCI Insight 3, (2018). [DOI] [PMC free article] [PubMed] [Google Scholar]
- 22.Valle A. et al. Reduction of circulating neutrophils precedes and accompanies type 1 diabetes. Diabetes 62, 2072–2077 (2013). [DOI] [PMC free article] [PubMed] [Google Scholar]
- 23.Navis A. & Bagnat M. Loss of cftr function leads to pancreatic destruction in larval zebrafish. Dev. Biol 399, 237–248 (2015). [DOI] [PMC free article] [PubMed] [Google Scholar]
- 24.Lin Y. et al. Genome-wide association meta-analysis identifies GP2 gene risk variants for pancreatic cancer. Nat. Commun 11, 3175 (2020). [DOI] [PMC free article] [PubMed] [Google Scholar]
- 25.Wolpin BM et al. Genome-wide association study identifies multiple susceptibility loci for pancreatic cancer. Nat. Genet 46, 994–1000 (2014). [DOI] [PMC free article] [PubMed] [Google Scholar]
- 26.Johansson BB et al. The role of the carboxyl ester lipase (CEL) gene in pancreatic disease. Pancreatol. Off. J. Int. Assoc. Pancreatol. IAP Al 18, 12–19 (2018). [DOI] [PubMed] [Google Scholar]
ADDITIONAL REFERENCES
- 27.Purcell S. et al. PLINK: a tool set for whole-genome association and population-based linkage analyses. Am. J. Hum. Genet 81, 559–575 (2007). [DOI] [PMC free article] [PubMed] [Google Scholar]
- 28.McCarthy S. et al. A reference panel of 64,976 haplotypes for genotype imputation. Nat. Genet 48, 1279–1283 (2016). [DOI] [PMC free article] [PubMed] [Google Scholar]
- 29.1000 Genomes Project Consortium et al. A global reference for human genetic variation. Nature 526, 68–74 (2015). [DOI] [PMC free article] [PubMed] [Google Scholar]
- 30.Das S. et al. Next-generation genotype imputation service and methods. Nat. Genet 48, 1284–1287 (2016). [DOI] [PMC free article] [PubMed] [Google Scholar]
- 31.Zhou W. et al. Efficiently controlling for case-control imbalance and sample relatedness in large-scale genetic association studies. Nat. Genet 50, 1335–1341 (2018). [DOI] [PMC free article] [PubMed] [Google Scholar]
- 32.Bulik-Sullivan BK et al. LD Score regression distinguishes confounding from polygenicity in genome-wide association studies. Nat. Genet 47, 291–295 (2015). [DOI] [PMC free article] [PubMed] [Google Scholar]
- 33.Evangelou M. et al. A method for gene-based pathway analysis using genomewide association study summary statistics reveals nine new type 1 diabetes associations. Genet. Epidemiol 38, 661–670 (2014). [DOI] [PMC free article] [PubMed] [Google Scholar]
- 34.Benner C. et al. FINEMAP: efficient variable selection using summary data from genome-wide association studies. Bioinforma. Oxf. Engl 32, 1493–1501 (2016). [DOI] [PMC free article] [PubMed] [Google Scholar]
- 35.Bulik-Sullivan B. et al. An atlas of genetic correlations across human diseases and traits. Nat. Genet 47, 1236–1241 (2015). [DOI] [PMC free article] [PubMed] [Google Scholar]
- 36.Ji S-G et al. Genome-wide association study of primary sclerosing cholangitis identifies new risk loci and quantifies the genetic relationship with inflammatory bowel disease. Nat. Genet 49, 269–273 (2017). [DOI] [PMC free article] [PubMed] [Google Scholar]
- 37.Bentham J. et al. Genetic association analyses implicate aberrant regulation of innate and adaptive immunity genes in the pathogenesis of systemic lupus erythematosus. Nat. Genet 47, 1457–1464 (2015). [DOI] [PMC free article] [PubMed] [Google Scholar]
- 38.Cordell HJ et al. International genome-wide meta-analysis identifies new primary biliary cirrhosis risk loci and targetable pathogenic pathways. Nat. Commun 6, 8019 (2015). [DOI] [PMC free article] [PubMed] [Google Scholar]
- 39.Okada Y. et al. Genetics of rheumatoid arthritis contributes to biology and drug discovery. Nature 506, 376–381 (2014). [DOI] [PMC free article] [PubMed] [Google Scholar]
- 40.de Lange KM et al. Genome-wide association study implicates immune activation of multiple integrin genes in inflammatory bowel disease. Nat. Genet 49, 256–261 (2017). [DOI] [PMC free article] [PubMed] [Google Scholar]
- 41.Dubois PCA et al. Multiple common variants for celiac disease influencing immune gene expression. Nat. Genet 42, 295–302 (2010). [DOI] [PMC free article] [PubMed] [Google Scholar]
- 42.Jin Y. et al. Genome-wide association studies of autoimmune vitiligo identify 23 new risk loci and highlight key pathways and regulatory variants. Nat. Genet 48, 1418–1424 (2016). [DOI] [PMC free article] [PubMed] [Google Scholar]
- 43.Paternoster L. et al. Multi-ancestry genome-wide association study of 21,000 cases and 95,000 controls identifies new risk loci for atopic dermatitis. Nat. Genet 47, 1449–1456 (2015). [DOI] [PMC free article] [PubMed] [Google Scholar]
- 44.López-Isac E. et al. GWAS for systemic sclerosis identifies multiple risk loci and highlights fibrotic and vasculopathy pathways. Nat. Commun 10, 4955 (2019). [DOI] [PMC free article] [PubMed] [Google Scholar]
- 45.Jansen IE et al. Genome-wide meta-analysis identifies new loci and functional pathways influencing Alzheimer’s disease risk. Nat. Genet 51, 404–413 (2019). [DOI] [PMC free article] [PubMed] [Google Scholar]
- 46.Mahajan A. et al. Fine-mapping type 2 diabetes loci to single-variant resolution using high-density imputation and islet-specific epigenome maps. Nat. Genet 50, 1505–1513 (2018). [DOI] [PMC free article] [PubMed] [Google Scholar]
- 47.Nelson CP et al. Association analyses based on false discovery rate implicate new loci for coronary artery disease. Nat. Genet 49, 1385–1391 (2017). [DOI] [PubMed] [Google Scholar]
- 48.Stahl EA et al. Genome-wide association study identifies 30 loci associated with bipolar disorder. Nat. Genet 51, 793–803 (2019). [DOI] [PMC free article] [PubMed] [Google Scholar]
- 49.Wray NR et al. Genome-wide association analyses identify 44 risk variants and refine the genetic architecture of major depression. Nat. Genet 50, 668–681 (2018). [DOI] [PMC free article] [PubMed] [Google Scholar]
- 50.Grove J. et al. Identification of common genetic risk variants for autism spectrum disorder. Nat. Genet 51, 431–444 (2019). [DOI] [PMC free article] [PubMed] [Google Scholar]
- 51.Watson HJ et al. Genome-wide association study identifies eight risk loci and implicates metabo-psychiatric origins for anorexia nervosa. Nat. Genet 51, 1207–1214 (2019). [DOI] [PMC free article] [PubMed] [Google Scholar]
- 52.Schizophrenia Working Group of the Psychiatric Genomics Consortium. Biological insights from 108 schizophrenia-associated genetic loci. Nature 511, 421–427 (2014). [DOI] [PMC free article] [PubMed] [Google Scholar]
- 53.Wuttke M. et al. A catalog of genetic loci associated with kidney function from analyses of a million individuals. Nat. Genet 51, 957–972 (2019). [DOI] [PMC free article] [PubMed] [Google Scholar]
- 54.Nielsen JB et al. Biobank-driven genomic discovery yields new insight into atrial fibrillation biology. Nat. Genet 50, 1234–1239 (2018). [DOI] [PMC free article] [PubMed] [Google Scholar]
- 55.Tachmazidou I. et al. Identification of new therapeutic targets for osteoarthritis through genome-wide analyses of UK Biobank data. Nat. Genet 51, 230–236 (2019). [DOI] [PMC free article] [PubMed] [Google Scholar]
- 56.Wheeler E. et al. Impact of common genetic determinants of Hemoglobin A1c on type 2 diabetes risk and diagnosis in ancestrally diverse populations: A transethnic genome-wide meta-analysis. PLoS Med. 14, e1002383 (2017). [DOI] [PMC free article] [PubMed] [Google Scholar]
- 57.Horikoshi M. et al. Genome-wide associations for birth weight and correlations with adult disease. Nature 538, 248–252 (2016). [DOI] [PMC free article] [PubMed] [Google Scholar]
- 58.Yengo L. et al. Meta-analysis of genome-wide association studies for height and body mass index in ∼700000 individuals of European ancestry. Hum. Mol. Genet 27, 3641–3649 (2018). [DOI] [PMC free article] [PubMed] [Google Scholar]
- 59.Jiang X. et al. Genome-wide association study in 79,366 European-ancestry individuals informs the genetic architecture of 25-hydroxyvitamin D levels. Nat. Commun 9, 260 (2018). [DOI] [PMC free article] [PubMed] [Google Scholar]
- 60.Manning AK et al. A genome-wide approach accounting for body mass index identifies genetic variants influencing fasting glycemic traits and insulin resistance. Nat. Genet 44, 659–669 (2012). [DOI] [PMC free article] [PubMed] [Google Scholar]
- 61.Day FR et al. Large-scale genomic analyses link reproductive aging to hypothalamic signaling, breast cancer susceptibility and BRCA1-mediated DNA repair. Nat. Genet 47, 1294–1303 (2015). [DOI] [PMC free article] [PubMed] [Google Scholar]
- 62.Day FR et al. Genomic analyses identify hundreds of variants associated with age at menarche and support a role for puberty timing in cancer risk. Nat. Genet 49, 834–841 (2017). [DOI] [PMC free article] [PubMed] [Google Scholar]
- 63.Savage JE et al. Genome-wide association meta-analysis in 269,867 individuals identifies new genetic and functional links to intelligence. Nat. Genet 50, 912–919 (2018). [DOI] [PMC free article] [PubMed] [Google Scholar]
- 64.Strawbridge RJ et al. Genome-wide association identifies nine common variants associated with fasting proinsulin levels and provides new insights into the pathophysiology of type 2 diabetes. Diabetes 60, 2624–2634 (2011). [DOI] [PMC free article] [PubMed] [Google Scholar]
- 65.Saxena R. et al. Genetic variation in GIPR influences the glucose and insulin responses to an oral glucose challenge. Nat. Genet 42, 142–148 (2010). [DOI] [PMC free article] [PubMed] [Google Scholar]
- 66.Tobacco and Genetics Consortium. Genome-wide meta-analyses identify multiple loci associated with smoking behavior. Nat. Genet 42, 441–447 (2010). [DOI] [PMC free article] [PubMed] [Google Scholar]
- 67.Shungin D. et al. New genetic loci link adipose and insulin biology to body fat distribution. Nature 518, 187–196 (2015). [DOI] [PMC free article] [PubMed] [Google Scholar]
- 68.Cousminer DL et al. Genome-wide association and longitudinal analyses reveal genetic loci linking pubertal height growth, pubertal timing and childhood adiposity. Hum. Mol. Genet 22, 2735–2747 (2013). [DOI] [PMC free article] [PubMed] [Google Scholar]
- 69.Taal HR et al. Common variants at 12q15 and 12q24 are associated with infant head circumference. Nat. Genet 44, 532–538 (2012). [DOI] [PMC free article] [PubMed] [Google Scholar]
- 70.Teumer A. et al. Genome-wide analyses identify a role for SLC17A4 and AADAT in thyroid hormone regulation. Nat. Commun 9, (2018). [DOI] [PMC free article] [PubMed] [Google Scholar]
- 71.Jansen PR et al. Genome-wide analysis of insomnia in 1,331,010 individuals identifies new risk loci and functional pathways. Nat. Genet 51, 394–403 (2019). [DOI] [PubMed] [Google Scholar]
- 72.van der Valk RJP et al. A novel common variant in DCST2 is associated with length in early life and height in adulthood. Hum. Mol. Genet 24, 1155–1168 (2015). [DOI] [PMC free article] [PubMed] [Google Scholar]
- 73.Willer CJ et al. Discovery and refinement of loci associated with lipid levels. Nat. Genet 45, 1274–1283 (2013). [DOI] [PMC free article] [PubMed] [Google Scholar]
- 74.Felix JF et al. Genome-wide association analysis identifies three new susceptibility loci for childhood body mass index. Hum. Mol. Genet 25, 389–403 (2016). [DOI] [PMC free article] [PubMed] [Google Scholar]
- 75.Chiou J. et al. Single cell chromatin accessibility reveals pancreatic islet cell type- and state-specific regulatory programs of diabetes risk. bioRxiv 693671 (2019) doi: 10.1101/693671. [DOI] [PMC free article] [PubMed] [Google Scholar]
- 76.Preissl S. et al. Single-nucleus analysis of accessible chromatin in developing mouse forebrain reveals cell-type-specific transcriptional regulation. Nat. Neurosci 21, 432–439 (2018). [DOI] [PMC free article] [PubMed] [Google Scholar]
- 77.Cusanovich DA et al. Multiplex Single Cell Profiling of Chromatin Accessibility by Combinatorial Cellular Indexing. Science 348, 910–914 (2015). [DOI] [PMC free article] [PubMed] [Google Scholar]
- 78.Li H. & Durbin R. Fast and accurate long-read alignment with Burrows-Wheeler transform. Bioinforma. Oxf. Engl 26, 589–595 (2010). [DOI] [PMC free article] [PubMed] [Google Scholar]
- 79.Li H. et al. The Sequence Alignment/Map format and SAMtools. Bioinforma. Oxf. Engl 25, 2078–2079 (2009). [DOI] [PMC free article] [PubMed] [Google Scholar]
- 80.Wolf FA, Angerer P. & Theis FJ SCANPY: large-scale single-cell gene expression data analysis. Genome Biol. 19, 15 (2018). [DOI] [PMC free article] [PubMed] [Google Scholar]
- 81.Korsunsky I. et al. Fast, sensitive and accurate integration of single-cell data with Harmony. Nat. Methods 16, 1289–1296 (2019). [DOI] [PMC free article] [PubMed] [Google Scholar]
- 82.Traag VA, Waltman L. & van Eck NJ From Louvain to Leiden: guaranteeing well-connected communities. Sci. Rep 9, 1–12 (2019). [DOI] [PMC free article] [PubMed] [Google Scholar]
- 83.Franzén O, Gan L-M & Björkegren JLM PanglaoDB: a web server for exploration of mouse and human single-cell RNA sequencing data. Database J. Biol. Databases Curation 2019, (2019). [DOI] [PMC free article] [PubMed] [Google Scholar]
- 84.Xin Y. et al. Pseudotime Ordering of Single Human β-Cells Reveals States of Insulin Production and Unfolded Protein Response. Diabetes db180365 (2018) doi: 10.2337/db18-0365. [DOI] [PubMed] [Google Scholar]
- 85.Zhang Y. et al. Model-based analysis of ChIP-Seq (MACS). Genome Biol. 9, R137 (2008). [DOI] [PMC free article] [PubMed] [Google Scholar]
- 86.Amemiya HM, Kundaje A. & Boyle AP The ENCODE Blacklist: Identification of Problematic Regions of the Genome. Sci. Rep 9, 1–5 (2019). [DOI] [PMC free article] [PubMed] [Google Scholar]
- 87.Quinlan AR & Hall IM BEDTools: a flexible suite of utilities for comparing genomic features. Bioinformatics 26, 841–842 (2010). [DOI] [PMC free article] [PubMed] [Google Scholar]
- 88.Arda HE et al. A Chromatin Basis for Cell Lineage and Disease Risk in the Human Pancreas. Cell Syst. 7, 310–322.e4 (2018). [DOI] [PMC free article] [PubMed] [Google Scholar]
- 89.Calderon D. et al. Landscape of stimulation-responsive chromatin across diverse human immune cells. Nat. Genet 51, 1494–1505 (2019). [DOI] [PMC free article] [PubMed] [Google Scholar]
- 90.McLean CY et al. GREAT improves functional interpretation of cis-regulatory regions. Nat. Biotechnol 28, 495–501 (2010). [DOI] [PMC free article] [PubMed] [Google Scholar]
- 91.Schep AN, Wu B, Buenrostro JD & Greenleaf WJ chromVAR: inferring transcription-factor-associated accessibility from single-cell epigenomic data. Nat. Methods 14, 975–978 (2017). [DOI] [PMC free article] [PubMed] [Google Scholar]
- 92.Khan A. et al. JASPAR 2018: update of the open-access database of transcription factor binding profiles and its web framework. Nucleic Acids Res. 46, D1284 (2018). [DOI] [PMC free article] [PubMed] [Google Scholar]
- 93.Wingender E, Schoeps T, Haubrock M. & Dönitz J. TFClass: a classification of human transcription factors and their rodent orthologs. Nucleic Acids Res. 43, D97–102 (2015). [DOI] [PMC free article] [PubMed] [Google Scholar]
- 94.Pliner HA et al. Cicero Predicts cis-Regulatory DNA Interactions from Single-Cell Chromatin Accessibility Data. Mol. Cell 71, 858–871.e8 (2018). [DOI] [PMC free article] [PubMed] [Google Scholar]
- 95.Harrow J. et al. GENCODE: the reference human genome annotation for The ENCODE Project. Genome Res. 22, 1760–1774 (2012). [DOI] [PMC free article] [PubMed] [Google Scholar]
- 96.Finucane HK et al. Partitioning heritability by functional annotation using genome-wide association summary statistics. Nat. Genet 47, 1228–1235 (2015). [DOI] [PMC free article] [PubMed] [Google Scholar]
- 97.Cusanovich DA et al. A Single-Cell Atlas of In Vivo Mammalian Chromatin Accessibility. Cell 174, 1309–1324.e18 (2018). [DOI] [PMC free article] [PubMed] [Google Scholar]
- 98.Wakefield J. Bayes factors for genome-wide association studies: comparison with P-values. Genet. Epidemiol 33, 79–86 (2009). [DOI] [PubMed] [Google Scholar]
- 99.Pickrell JK Joint analysis of functional genomic data and genome-wide association studies of 18 human traits. Am. J. Hum. Genet 94, 559–573 (2014). [DOI] [PMC free article] [PubMed] [Google Scholar]
- 100.Namkung W. et al. Ca2+ activates cystic fibrosis transmembrane conductance regulator- and Cl- -dependent HCO3 transport in pancreatic duct cells. J. Biol. Chem 278, 200–207 (2003). [DOI] [PubMed] [Google Scholar]
- 101.Doench JG et al. Optimized sgRNA design to maximize activity and minimize off-target effects of CRISPR-Cas9. Nat. Biotechnol 34, 184–191 (2016). [DOI] [PMC free article] [PubMed] [Google Scholar]
- 102.Hsu PD et al. DNA targeting specificity of RNA-guided Cas9 nucleases. Nat. Biotechnol 31, 827–832 (2013). [DOI] [PMC free article] [PubMed] [Google Scholar]
- 103.Horlbeck MA et al. Compact and highly active next-generation libraries for CRISPR-mediated gene repression and activation. eLife 5, (2016). [DOI] [PMC free article] [PubMed] [Google Scholar]
- 104.Giambartolomei C. et al. Bayesian test for colocalisation between pairs of genetic association studies using summary statistics. PLoS Genet. 10, e1004383 (2014). [DOI] [PMC free article] [PubMed] [Google Scholar]
- 105.Hormozdiari F. et al. Colocalization of GWAS and eQTL Signals Detects Target Genes. Am. J. Hum. Genet 99, 1245–1260 (2016). [DOI] [PMC free article] [PubMed] [Google Scholar]
- 106.Wang X, Park J, Susztak K, Zhang NR & Li M. Bulk tissue cell type deconvolution with multi-subject single-cell expression reference. Nat. Commun 10, 1–9 (2019). [DOI] [PMC free article] [PubMed] [Google Scholar]
Associated Data
This section collects any data citations, data availability statements, or supplementary materials included in this article.
Supplementary Materials
Data Availability Statement
Full summary statistics for the T1D GWAS have been deposited into the NHGRI-EBI GWAS catalog with accession number GCST90014023 and can be downloaded from http://ftp.ebi.ac.uk/pub/databases/gwas/summary_statistics/GCST90014001-GCST90015000/GCST90014023/. Sequencing data for snATAC-seq have been deposited into the NCBI Gene Expression Omnibus (GEO) with accession number GSE163160 and are available at https://www.ncbi.nlm.nih.gov/geo/query/acc.cgi?acc=GSE163160. Data obtained from the TFClass database are available at http://tfclass.bioinf.med.uni-goettingen.de/ and from the PanglaoDB database at https://panglaodb.se/.


