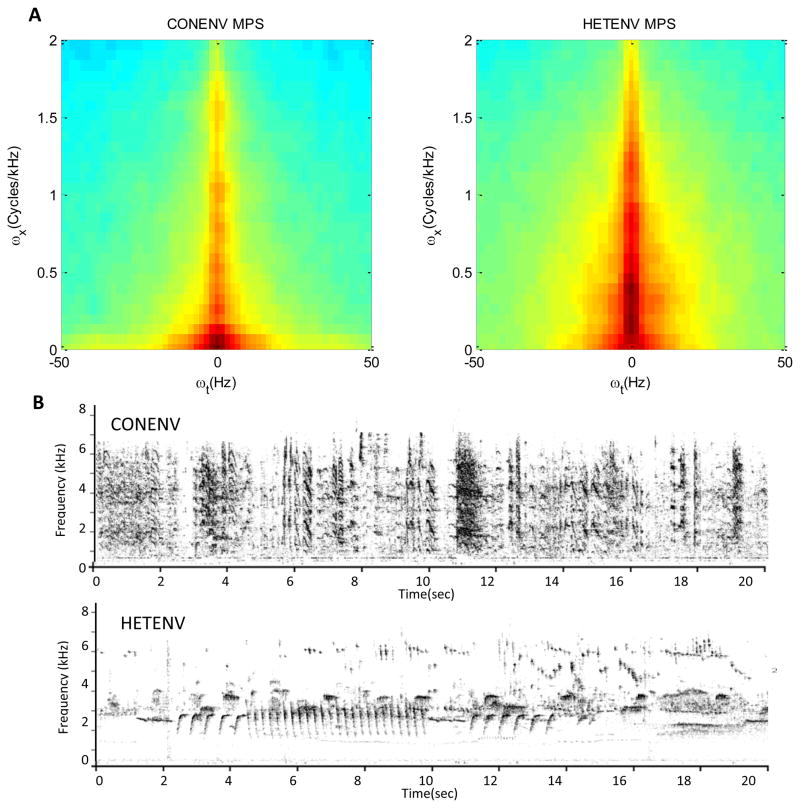
Figure 2.
A) Modulation Power Spectra (MPS) generated from zebra finch (CONENV) and canary (HETENV) playback tapes show the temporal and spectral modulations of vocalizations recorded in the two species environments. The X axis represents the temporal modulation as oscillations of power over time. The Y axis represents the spectral modulation as oscillations of power over a short-interval frequency spectrum. HETENV stimuli contain relatively more energy at higher frequencies and longer durations than CONENV stimuli. B) Spectrograms of CONENV and HETENV from a representative 20s sample of each environment.

