

Summary
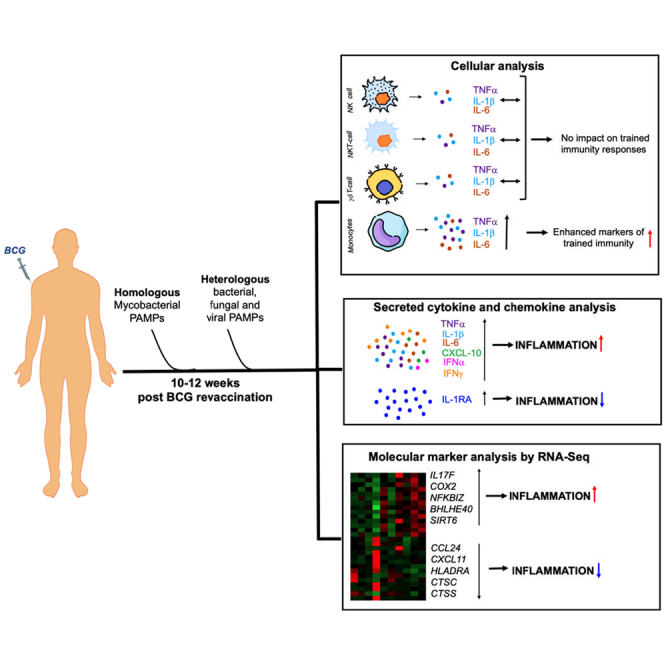
This study characterized mechanisms of Bacille Calmette-Guérin (BCG) revaccination-induced trained immunity (TI) in India. Adults, BCG vaccinated at birth, were sampled longitudinally before and after a second BCG dose. BCG revaccination significantly elevated tumor necrosis factor alpha (TNF-α), interleukin (IL)-1β, and IL-6 in HLA-DR+CD16−CD14hi monocytes, demonstrating induction of TI. Mycobacteria-specific CD4+ T cell interferon (IFN) γ, IL-2, and TNF-α were significantly higher in re-vaccinees and correlated positively with HLA-DR+CD16−CD14hi TI responses. This, however, did not translate into increased mycobacterial growth control, measured by mycobacterial growth inhibition assay (MGIA). Post revaccination, elevated secreted TNF-α, IL-1β, and IL-6 to “heterologous” fungal, bacterial, and enhanced CXCL-10 and IFNα to viral stimuli were also observed concomitant with increased anti-inflammatory cytokine, IL-1RA. RNA sequencing after revaccination highlighted a BCG and LPS induced signature which included upregulated IL17 and TNF pathway genes and downregulated key inflammatory genes: CXCL11, CCL24, HLADRA, CTSS, CTSC. Our data highlight a balanced immune response comprising pro- and anti-inflammatory mediators to be a feature of BCG revaccination-induced immunity.
Subject areas: Molecular biology, Immunology, Immune response, Immunity, Omics, Transcriptomics
Graphical abstract
Highlights
-
•
BCG revaccination boosts TI in HLA-DR+CD16−CD14+ monocytes to mycobacterial PAMPs
-
•
BCG revaccination boosts innate responses to heterologous PAMPs in HLA-DR+CD14+ monocytes
-
•
Revaccination leads to a balanced immune response, highlighted by increased IL-1RA
-
•
Revaccination-induced gene expression underpins generation of a balanced immune response
Molecular biology; Immunology; Immune response; Immunity; Omics; Transcriptomics
Introduction
Mycobacterium bovis Bacille Calmette-Guerin or BCG is the only licensed vaccine for tuberculosis (TB) prevention and has now been in use for more than 100 years. In addition to its effects on TB control and prevention, BCG has multiple heterologous off-target effects including protection against non-tuberculous infections, autoimmune disease, and cancer.1 Protection against neonatal sepsis,2 leprosy,3 respiratory syncytial virus,4 and non-tuberculous mycobacteria5 infection are a few examples of beneficial effects of BCG vaccination in children. In addition, administration of BCG reduces incidence of upper respiratory tract infections and pneumonia in elderly.6,7 BCG was also found to reduce viremia in an experimental yellow fever virus infection.8 Apart from infections, immunization with BCG has been shown to reduce risk of melanoma in children,9 diminish tumor progression in bladder cancer for which it became a standard therapy in the first stages of the disease,10 and lower disease severity in type 1 diabetes and multiple sclerosis.11,12
An important mechanism underpinning the heterologous effects of BCG especially in infections is “trained immunity”—a term coined to define the biological process by which the response of innate immune cells such as monocytes to stimulation is amplified due to their previous exposure to an unrelated immunological agent, e.g., BCG.13 Trained immunity in the context of BCG has been most well studied in terms of monocyte responses8,14 although effects on natural killer (NK) cell function have also been described.15 Long-term increased innate immune responses are dependent upon epigenetic reprogramming and changes in cellular metabolism. It is now well documented that, following BCG vaccination, there are epigenetic changes (e.g., H3K27ac, H3K4me3 histone marks, DNA methylation, etc) in specific genes linked to immune and metabolic pathways which mediate increased responsiveness of cells.16 Upon removal of the primary stimulus, the “trained monocyte” goes back to a resting transcriptional state while still retaining the epigenetic signatures for at least 3 months so that upon exposure to a secondary heterologous challenge they react with a more pronounced production of pro-inflammatory cytokines, chiefly interleukin (IL)-1β, IL-6, and tumor necrosis factor alpha (TNF-α): this eventually contributes to an immune response that is more protective than one that would be generated in absence of prior exposure to BCG.13,17 BCG-induced trained immunity has also been suggested to be vital for control of Mycobacterium tuberculosis infection.18 BCG vaccinees were shown to better control mycobacterial outgrowth in an in vitro mycobacterial growth inhibition assay (MGIA) through trained immunity mechanisms linked to enhanced expression of CXCL-9, CXCL-10, and CXCL-11 compared to unvaccinated controls.19
Most studies for characterization of BCG-induced trained immunity responses and heterologous benefits have been carried out in individuals receiving their first BCG vaccination. While we and others have shown BCG revaccination to significantly boost mycobacteria-specific T cell responses20,21 as well as adaptive T cell responses to a heterologous COVID-19 vaccine,22 there is a dearth of studies exploring the impact of BCG revaccination on innate immune mechanisms especially in a TB endemic region, such as India. The present manuscript aims to provide a comprehensive functional and molecular analysis of trained immunity after BCG revaccination in a cohort in India which has a policy of mandatory BCG vaccination at birth, is a TB endemic country,23 and has high incidence of non-tuberculous mycobacteria (NTM) infection and exposure.24,25
Results
Potency of BCG revaccination confirmed by enhanced mycobacteria-specific adaptive CD4+ T cell responses in BCG re-vaccinees
Healthcare workers, BCG vaccinated at birth, at St. John’s Medical College, Bangalore, were enrolled upon consent and revaccinated with BCG. Brief clinical summary is shown in Figure 1A, and detailed clinical information is summarized in File S1. All volunteers were sampled longitudinally according to study design shown in Figure 1B. Briefly, blood was taken at baseline before BCG revaccination (T0) and 10–12 weeks later (T2). All immunological experiments were performed with samples collected at these two time points after random selection. The details of recruitment and enrollment of volunteers in the study are shown in the flow diagram in Figure 1C, and for further details please see STAR Methods section on study participants and study overview.
Figure 1.

Study participant details and study design
(A) A summary of total N, sex and age distribution.
(B) A diagrammatic representation of study design where blood was collected from volunteers at baseline (T0) at which time they were also vaccinated with BCG. Blood samples were also collected 56–70 days later at T2.
(C) CONSORT flow diagram to explain recruitment and enrollment of study participants and randomized selection for immune assays.
Previous data from our laboratory on BCG revaccination in an independent cohort had shown boosting of mycobacterium-specific CD4+ interferon (IFN) γ OR IL-2 responses in BCG re-vaccinees at 34-week after revaccination.20 In the present study where T cell responses were measured earlier at 10–12 weeks after revaccination (based on optimal time to track in vivo BCG vaccination impact on innate immunity), we were able to replicate some of our previous findings, with significant enhancement of mycobacteria-specific CD4+ effector responses (Figure 2). We tested CD4 and CD8 responses to Ag85A, BCG, and ESAT-6:CFP-10 (E/C) at T0 and T2 measured by expression of IFNγ, IL-2, and TNF-α (representative gating strategy shown in Figure S1). While Ag85A is expressed by BCG,26,27,28 E/C is not and is specific to Mycobacterium tuberculosis.29 E/C therefore serves as a specificity control for stimulation. The most significant changes were observed in the CD4 compartment (Figure 2A). CD8 responses remained unchanged after BCG revaccination (Figure S2). Baseline pre-BCG revaccination (T0) responses above assay cutoff (frequency = 0.01) to E/C stimulation were noted, most likely reflecting natural exposure, and did not change significantly after BCG revaccination in both CD4 and CD8 T cells (Figures 2A and S2). Ag85A responses were also noted at baseline and were not enhanced after BCG revaccination in both CD4 and CD8 T cells (Figures 2A and S2); this is in line with our previous data20 showing a transient boost of Ag85A-specific responses 4 weeks after BCG revaccination. Responses to BCG stimulation, on the other hand, revealed significantly higher frequencies of specific IFNγ OR IL-2, IFNγ, IL-2, and TNF-α expressing cells at T2 after BCG revaccination relative to matched baseline, highlighting the capacity of BCG revaccination to boost mycobacteria-specific CD4+ T cell responses (Figure 2A). The median fold change (FC) for IFNγ (median frequency at T0 = 0.1090, T2 = 0.2250) and TNF- α (median frequency at T0 = 0.07350, T2 = 0.1560) was almost 2-fold while for IL-2 (median frequency at T0 = 0.0330, T2 = 0.0510) it was almost 1.5-fold (Figure 2A). BCG-specific CD8+ T cell responses were not boosted by revaccination (Figure S2).
Figure 2.

BCG revaccination boosts mycobacteria-specific CD4 T cell responses
(A) Whole blood collected from N = 20 (male = 9, female = 11) BCG re-vaccinees at T0 and T2 was stimulated or not with Ag85A, BCG, or ESAT-6:CFP-10 (E/C) for 12 h and stained with a panel of antibodies against cell surface and intracellular markers. Samples were acquired on a flow cytometer and data analysis was performed using FlowJo to estimate frequencies of cytokine specific CD4+ T cells which were graphed after subtraction of background values from matched unstimulated controls.
(B) Boolean gates for different combinations of cytokine secreting cells generated were input in the SPICE platform to assess polyfunctionality. Wilcoxon matched-pairs signed rank test was used to determine p values which are shown for each comparison. p < 0.05 was considered significant.
Presence of polyfunctional CD4+ T cells producing various combinations of IFNγ, IL-2, and TNF-α in response to BCG restimulation was estimated using Simplified Presentation of Incredibly Complex Evaluations (SPICE) (Figure 2B). This analysis revealed that cells secreting IFNγ + IL-2, IL-2 + TNF-α, and IFNγ + IL-2 +TNF-α were significantly higher at T2 compared to T0 demonstrating that BCG revaccination leads to the generation of polyfunctional cells which have been previously reported to be correlates of protection against TB in human and mice studies.30
BCG revaccination boosts HLA-DR+CD14hi monocyte effector responses to mycobacterial pathogen-associated molecular pattern (PAMP) stimulation but does not alter peripheral monocyte frequencies
Alongside measurement of mycobacteria-specific CD4+ and CD8+ T cell cytokine expression, monocyte responses to the same set of mycobacterial antigens Ag85A, BCG, and E/C were studied in the same samples using a 16-color flow cytometry staining panel (Table 1). Monocyte responses measured in terms of expression of TNF-α, IL-1β, and IL-6, classical markers of trained immunity,8,31,32 were highest after in vitro BCG and E/C stimulation, two recognized PAMPs.31,33,34 Low responses in Ag85A T cell epitope peptide pool-stimulated cultures served as a negative control in this assay (Figure 3A). Expression of TNF-α, IL-1β, IL-6, and IL-8 was monitored in 3 monocyte populations: CD16−CD14lo/hi total monocytes, HLA-DR+CD14lo/hi, and HLA-DR+CD14hi (representative gating shown Figure S3). TNF-α, IL-1β, and IL-6 expression was increased at T2 compared to T0 to varying degrees in different monocyte populations (Figures 3A, S4A, and S4B). In contrast, IL-8 responses remained unchanged across all monocyte populations studied under all stimulation conditions (Figures 3A, S4A, and S4B).
Table 1.
Antibody panel for whole blood flow cytometry staining
| Sl. No. | Antibody | Cat. No. | Manufacturer | Clone | RRID |
|---|---|---|---|---|---|
| 1. | CD3 BV570 | 300436 | Biolegend | UCHT1 | AB_2562124 |
| 2. | CD4 BUV395 | 563550 | BD Biosciences | SK3 | AB_2738273 |
| 3. | CD8 BV711 | 563677 | BD Biosciences | RPAT8 | AB_2744463 |
| 4. | CD14 BV510 | 301842 | Biolegend | M5E2 | AB_2561946 |
| 5. | CD16 APCH7 | 560195 | BD Biosciences | 3G8 | AB_1645466 |
| 6. | CD56 BUV737 | 612766 | BD Biosciences | NCAM16.2 | AB_2813880 |
| 7. | γδ TCR PECF594 | 562511 | BD Biosciences | B1 | AB_2737631 |
| 8. | HLA-DR PECy5 | 555813 | BD Biosciences | G46-6 | AB_396147 |
| 9. | IFNγ V450 | 560371 | BD Biosciences | B27 | AB_1645594 |
| 10. | IL2 APC | 554567 | BD Biosciences | MQ1-17H12 | AB_398571 |
| 11. | TNFα BV650 | 502938 | Biolegend | MAb11 | AB_2562741 |
| 12. | IL1β FITC | 340515 | BD Biosciences | AS10 | AB_400438 |
| 13. | IL6 PE-Cy7 | 25-7069-42 | Thermo Fisher Scientific | MQ2-13A5 | AB_2573522 |
| 14. | IL8 PerCP-eFluor710 | 46-8088-42 | Thermo Fisher Scientific | 8CH | AB_10805748 |
| 15. | IL10 BV786 | 564049 | BD Biosciences | JES39D7 | AB_2738563 |
| 16. | GzB Alx700 | 560213 | BD Biosciences | GB11 | AB_1645453 |
Figure 3.

BCG revaccination boosts HLA-DR+CD16−CD14hi monocyte effector responses
Whole blood collected from N = 20 (male = 9, female = 11) BCG re-vaccinees at T0 and T2 was stimulated or not with Ag85A, BCG, or ESAT-6:CFP-10 (E/C) for 12 h and stained with a panel of antibodies against cell surface and intracellular markers. Samples were acquired on a flow cytometer and data analysis was performed using FlowJo to estimate (A) frequencies of TNF-α+, IL-1β+, IL-6+, and IL-8+ cells in the HLA-DR+CD16−CD14hi monocytes which were graphed after subtraction of background values from matched unstimulated controls.
(B) Median fluorescence intensity (MFI) were estimated for TNF-α, IL-1β, IL-6, and IL-8 expression in HLA-DR+CD16−CD14hi monocytes under different stimulation conditions and plotted as fold changes above the matched unstimulated control. Wilcoxon matched-pairs signed rank test was used to determine p values which are shown for each comparison. p < 0.05 was considered significant.
CD16−CD14lo/hi total monocyte responses did not increase significantly after BCG revaccination except for BCG-induced TNF-α production and E/C-induced IL-6 (Figure S4A). However, an increase at T2 ‘vs.’ T0 was observed in BCG-induced TNF-α, IL-1β, and IL-6 production in HLA-DR+ monocytes. The most significant changes were seen in the HLA-DR+CD14hi monocyte compartment (Figure 3), providing evidence for induction of trained immunity responses after BCG revaccination. E/C-stimulated TNF-α and IL-6, but not IL-1β, increased significantly at T2 ‘vs.’ T0 in HLA-DR+CD14hi/lo (Figure S4B) and HLA-DR+CD14hi monocytes (Figure 3A). The pattern of increase in TNF-α, IL-1β, and IL-6 at T2 ‘vs.’ T0 to BCG and E/C stimulation was similar in HLA-DR+CD14hi/lo (Figure S4B) and HLA-DR+CD14hi cells (Figure 3A), suggesting that BCG revaccination-induced trained immunity changes occur primarily in the HLA-DR+CD14hi compartment. Apart from the boost in TNF-α and IL-1β frequencies in the HLA-DR+CD14hi cells, there was also significant increase in median fluorescence intensity (MFI) of these cytokines at T2 compared to T0 in response to BCG and E/C stimulation, suggesting that at T2 there is increase in both frequency of TNF-α- and IL-1β-producing cells as well as cytokine expression per cell (Figure 3B). Even though IL-6 frequencies were boosted in response to BCG and E/C stimulation at T2 (Figure 3A), IL-6 MFI remained unchanged across T0 and T2 (Figure 3B). The changes observed in innate effector responses in HLA-DR+CD14hi monocytes were not due to changes in monocyte and adaptive T cell frequencies from T0 to T2 (Figures S5A and S5B).
In addition to studying TI markers in monocyte subsets, our flow cytometry panel (Table 1) allowed us to probe changes in the CD56+ natural killer (NK) cell, Natural Killer T cells (NKT), and γδ T cell populations (representative gating strategy shown in Figure S6A) to Ag85A, BCG, and ESAT-6:CFP-10 (EC) stimulation. No significant changes were observed in TNF-α, IL-1β, IL-6, and IL-8 responses in CD56int NK, CD56hi NK, NKT, and γδ T cell populations from T0 to T2 (Figure S6B). Also, to be noted is that the cytokine levels in several donors in these cellular subsets were below assay cutoff. These data suggest that innate TI changes 10–12 weeks after BCG revaccination are predominantly observed in the CD16−HLA-DR+CD14hi monocyte compartment.
Adaptive CD4+ T cell and innate monocyte responses correlate positively
Trained Immunity generated in monocytes and other innate immune cells can influence adaptive immune responses.32 Since we had measured mycobacteria-induced adaptive T cell and innate monocyte responses at baseline and after BCG revaccination simultaneously in the same samples using a single staining panel (Table 1), the data could be correlated. Fold changes (FCs) at T2 compared to T0 in CD4+ T cell cytokine (IFNγ OR IL-2, IFNγ, IL-2, and TNF-α) and HLA-DR+CD14hi TNF-α, IL-1β, and IL-6 responses to BCG stimulation were correlated (Figure 4). The most significant and robust increase in cytokine expression at T2 compared to T0 was observed in the CD4+ T cell and HLA-DR+CD14hi monocyte cellular compartments after BCG restimulation, and hence these cellular populations and stimulation condition were selected for correlation. The FC in BCG-induced monocyte TNF-α had the most significant and strongest positive correlation with CD4+ cytokine responses in the order IFNγ>IFNγ OR IL-2>TNF-α>IL-2 (Figure 4). Monocyte IL-1β and IL-6 responses were found to positively correlate with CD4+ T cell cytokine responses to varying degrees (Figure 4). However, both IL-1β and IL-6 were also found to positively and significantly correlate with BCG revaccination-induced CD4+IFNγ (Figure 4). These data demonstrate that boosting of innate and adaptive responses after BCG revaccination happens concurrently.
Figure 4.

BCG-specific CD4+ T cell responses positively correlate with BCG-induced monocyte responses
Fold changes in BCG-specific cytokine+ (IFNγ OR IL-2, IFNγ, IL-2, and TNF-α) CD4+ T cells and BCG-induced cytokine+ (TNF-α+, IL-1β+, IL-6+) HLA-DR+CD16−CD14hi monocyte frequencies at T2 compared to T0 in N = 20 vaccinees (data from Figures 2 and 3A) were correlated. The Spearman’s correlation coefficients (r) and p values (p) are shown for each correlation. p < 0.05 was considered significant.
BCG revaccination has variable impact on mycobacterial growth inhibition despite boosting innate effector secretion in cultured PBMC from re-vaccinees
We next performed BCG stimulation assays to probe effector cytokine and chemokine secretion in cultured peripheral blood mononuclear cells (PBMCs) from re-vaccinees at baseline (T0) and T2 (Figure 5A). Similar to observations of BCG stimulatory effects on whole blood cells, both CD4+ T cells and HLA-DR+CD14+ monocytes (Figures 2 and 3), there was an increase in TNF-α, IL-1β, and IL-6 production after revaccination (T2 samples) compared to matched pre-revaccination T0 PBMC samples (Figure 5A). Significant concentrations of IFNγ were also detected upon BCG stimulation of PBMC, and these were higher after revaccination relative to baseline (Figure 5A), likely reflecting secretion from a mixture of IFNγ-secreting innate (NK, γδ) and adaptive T cells and consistent with higher BCG-specific IFNγ+ CD4+ T cell frequencies after revaccination, as measured by flow cytometry (Figure 2). The production of other cytokines and chemokines such as granulocyte-macrophage colony-stimulating factor (GM-CSF), CXCL-9, IL-12p70, CXCL-10, and IFNα did not change significantly at T2, after revaccination (Figure 5A). Also, there was no significant change in production of IL-10 (Figure 5A). However, IL-1RA, a regulator of the IL-1 family cytokines including IL-1β,35 was significantly higher at T2 compared to T0 (Figure 5A) suggesting that after revaccination, an inflammatory response to BCG stimulation is accompanied by elevation in anti-inflammatory mediators.
Figure 5.

BCG revaccination boosts PBMC cytokine responses but does not significantly impact mycobacterial outgrowth in an MGIA
(A) PBMC at T0 and T2 from N = 13 (male = 6, female = 7) vaccinees were stimulated or not with BCG and culture supernatants were collected after 24 h. TNF-α, IL-1β, IL-6, CXCL-10, IFN- α, IFN-γ, CXCL-9, GM-CSF, IL-12p70, IL-10, and IL-1RA were measured and analyte concentrations after matched unstimulated background subtraction were plotted.
(B) PBMCs from T0 and T2 (N = 11; male = 6, female = 5) were tested in the mycobacterial growth inhibition assay and plotted according to their capacity to control BCG growth. Dotted lines represent the inoculum at 1.025 log CFU and the 50% reduction at 0.513 log CFU. Each line represents an individual vaccinee.
(C) Vaccinees were classified into good control at T0, increased control at T2 or no control at T0 and T2 according to their ability to control BCG at T0 or T2. N = 1 vaccinee exhibited good mycobacterial growth control at T2 and were classified as ‘good control at T0’; N = 4 vaccinees acquired mycobacterial growth after BCG at T2 and were classified as ‘increased control at T2’ and finally N = 6 vaccinees did not exhibit mycobacterial growth control at either T0 or T2 and were classified as no control at T0 or T2.
(D) Fold changes in cytokines/chemokines calculated as T2/T0 (shown in A) were grouped and compared according to MGIA results between ‘increased control’ and ‘no control’. Wilcoxon matched-pairs signed rank test was used to determine p values which are shown for each comparisons in (A) and (B). Mann-Whitney test was used for comparisons shown in (D) p < 0.05 was considered significant.
To assess whether boosted innate CD14 and adaptive CD4 T cell responses at T2 (Figures 2 and 3) influence the capacity to control BCG growth, an in vitro MGIA using archived PBMC was employed (Figure 5B). We performed BCG growth inhibition analysis in N = 11 BCG re-vaccinees at T0 and T2 (Figure 5B). There was no significant change in control of BCG outgrowth after revaccination (Figure 5B). According to the classification criteria described in the STAR Methods section, of the total number (11) of individuals tested in the MGIA, one individual (9.09%) already controlled BCG outgrowth at T0; N = 6 (54.54%) did not control BCG outgrowth even after revaccination at T2; and N = 4 (36.36%) acquired control at T2 compared to T0 (Figure 5C). As can be seen in Figure 5B, variability was noted in the MGIA assay, between donors studied. This can potentially be a consequence of inherent assay variability and/or heterogeneity between subjects recruited to the study.
We further grouped individuals according to their MGIA response, increased control ‘vs.’ no control at T2, and compared the FCs (T2/T0) in the cytokine/chemokine mediators measured for BCG-stimulated PBMC as shown in Figure 5A. There was no significant difference in FC in any of the inflammatory mediators between the two groups (Figure 5D). IL-10 and IL-1RA were the only mediators where there was a significant difference between the two MGIA groups; the FC (T2/T0) was higher in the “increased control” compared to the “no control” group (Figure 5D).
BCG revaccination boosts cytokine responses to heterologous PAMP stimulation in monocytes
We next investigated if BCG revaccination has the capacity to boost cytokine expression to heterologous PAMPs at the PBMC level. Responses to a panel of fungal, bacterial, and viral PAMPs were studied: heat-killed Candida albicans (fungal), LPS (Gram-negative bacteria, TLR-2/TLR-4-MD-2 agonist), Pam-3-CSK (TLR-2 agonist), and viral RNA mimic poly I:C (TLR-3 agonist). A panel of nine effectors was measured in culture supernatant harvested at 24 h after stimulation, including TNF-α, IL-1β, IL-6, CXCL-10, IFNα, IFNγ, CXCL-9, GM-CSF, and IL-12p70, all recognized markers of trained immunity or crucial for monocyte/macrophage function. Several differences were observed in the levels of cytokines/chemokines induced by the different PAMPs above background (no PAMP culture control samples) (Figure 6). TNF-α, IL-1β, IL-6, CXCL-9, GM-CSF, and IL-12p70 were induced by most PAMPs except poly I:C, which was a good inducer of type-I IFN response mediators, CXCL-10 and IFNα, consistent with its function of a viral mimic (Figure 6). C. albicans, LPS, and Pam-3-CSK were not potent inducers of CXCL-10 and IFNα (Figure 6). There was no difference in levels of CXCL-9, GM-CSF, and IL-12p70 between T0 and T2 across all PAMPs tested (Figure 6). The most significant changes induced by BCG revaccination were observed in C. albicans-, LPS-, and Pam-3-CSK-induced TNF-α, IL-1β, and IL-6 which were higher at T2 compared to T0 (Figure 6). The highest FC at T2 compared to T0 was observed for TNF-α (median FC for all stimuli combined = 1.9) followed by IL-1β (median FC for all stimuli combined = 1.8). FCs in IL-6, though significant, were small (median FC for all stimuli combined = 1.2) and not as robust as changes in TNF-α and IL-1β. Poly I:C-induced CXCL-10 and IFNα were significantly higher at T2 compared to T0 (Figure 6). These data strongly indicate that BCG revaccination boosts signatures of trained immunity to not only mycobacterial stimuli (Figures 3 and 5) but also other heterologous fungal (C. albicans), bacterial (LPS, Pam-3-CSK), and viral (poly I:C) PAMPs (Figure 6). Importantly, changes observed in cytokine and chemokine levels at T2 compared to T0 were not due to changes in levels of major adaptive and innate cell populations (Figure S7).
Figure 6.

PBMC innate effector cytokine/chemokine expression in responses to bacterial, fungal, and viral PAMPs increases after BCG revaccination
PBMC at T0 and T2 from N = 13 (male = 6, female = 7) vaccinees were stimulated or not with Candida albicans, LPS, Pam-3-CSK, and poly I:C and culture supernatants were collected after 24 h. TNF-α, IL-1β, IL-6, CXCL-10, IFN- α, IFNγ, CXCL-9, GM-CSF, and IL-12p70 were measured and analyte concentrations after matched unstimulated background subtraction were plotted as heat-maps. Unstimulated control for all mediators at T0 and T2 are shown as a separate heatmap. p values for differences between T0 and T2 are shown next to the heat-maps and significant differences of p < 0.05 are highlighted by blue stars. Wilcoxon matched-pairs signed rank test was used to determine p values which are shown for each comparison. p < 0.05 was considered significant.
In addition to measuring secreted cytokines in culture supernatants, we performed flow cytometry analysis in 6 h LPS-stimulated PBMC cultures (from a subset of donors used for PBMC PAMP stimulation, data shown in Figure 6) to investigate if similar to mycobacterial stimuli (BCG and EC), TI changes to a heterologous non-mycobacterial stimulus, e.g., LPS, also occur in the monocyte compartment. The expression of major pro-inflammatory TI markers TNF-α, IL-1β, IL-6, and IL-8 were measured in CD3−CD56−CD16−HLA-DR+CD14+ monocytes (representative gating strategy shown in Figure S8A). Similar to our observations in culture supernatants, TNF-α, IL-1β, and IL-6 were significantly increased at T2 compared to T0 in CD16−HLA-DR+CD14+ monocytes (Figure S8B). IL-8 responses remained unchanged from T0 to T2. Also, no significant changes from T0 to T2 in TNF-α, IL-1β, IL-6, and IL-8 were observed in NKT, CD56int, and CD56hi NK cells demonstrating again that BCG revaccination-induced TI changes occur predominantly in monocytes (Figure S8B).
Next, we performed in vitro training experiments in purified monocytes with the same BCG that was used for revaccination. The donors used for this experiment had been BCG vaccinated at birth but had subsequently not received a second dose of BCG, hence un-revaccinated. In vitro training with BCG resulted in significantly increased LPS-induced TNF-α, IL-1β, and IL-6 in purified monocyte cultures (Figure S9) recapitulating effects observed upon in vivo BCG revaccination and suggesting that monocytes are sites for BCG-induced TI changes.
BCG revaccination boosts expression of anti-inflammatory immune-regulatory markers in response to heterologous stimuli
Concomitant with the induction of pro-inflammatory mediators, we probed the capacity of BCG revaccination to boost immune-regulatory factors IL-10 and IL-1RA (Figure 7), which can be secreted by a variety of immune cells including monocytes35,36 as a measure of the known anti-inflammatory effects of BCG.37,38
Figure 7.

PBMC IL-1RA expression in response to bacterial, fungal, and viral PAMPs are increased after BCG revaccination
(A–D) PBMC at T0 and T2 from N = 13 (male = 6, female = 7) vaccinees were stimulated with Candida albicans, BCG, LPS, Pam-3-CSK, and Poly I:C and culture supernatants were collected after 24 h. Unstimulated control for IL-10 and IL-1RA at T0 and T2 are shown separately (A). PAMP-induced IL-10 (B) and IL-1RA (C) were measured and analyte concentrations after matched unstimulated background subtraction were plotted as heat-maps. p values for differences between T0 and T2 are shown next to the heat-maps and significant differences of p < 0.05 are highlighted by blue stars. IL-1β/IL-1RA ratios were calculated at T0 and T2 for each stimulation condition and all stimulations combined were plotted (D). Wilcoxon matched-pairs signed rank test was used to determine p values. p < 0.05 was considered significant.
Most PAMPs except poly I:C induced effective production of IL-10 at both T0 and T2 (Figure 7B). Concentrations of IL-10 induced by poly I:C were very low compared to other stimuli but still above assay cutoff (1.4 pg/mL) for majority of samples (Figure 7B).
IL-1RA production was induced by all stimuli (Figure 7C) and was higher in T2 vs. T0 with significance reached for LPS, Pam-3-CSK, and poly I:C (Figure 7C). IL-1β/IL-1RA ratio, which is used as a marker for the balance between pro- and anti-inflammatory responses,39 was also calculated (Figure 7D). A significant increase in IL-1β (Figure 6A) was counterbalanced by a strong elevation of IL-1RA at T2 ensuring that there was no significant change in the IL-1β/IL-1RA ratio between baseline and post-vaccination for any of the stimuli tested (Figure 7D). Data presented suggest the generation of a balanced immune response upon BCG revaccination.
BCG revaccination-associated unique molecular signature comprises predominantly downregulated genes in BCG- and LPS-stimulated PBMC
In order to identify a molecular signature of BCG revaccination, RNA sequencing analysis of PBMC stimulated ex vivo with BCG or LPS for 24 h was performed. After subtraction of the unstimulated control and applying a cutoff of adjusted p < 0.05 and FC > 1.5 (upregulated) and FC < 1.5 (downregulated); differentially expressed genes (DEGs) were identified (Figure 8A). The total DEGs in BCG stimulation were 330 at T0 ‘vs.’ 252 at T2, and those in LPS stimulation were 411 at T0 ‘vs.’ 302 at T2, further broken down into up- and downregulated genes (Figure 8B). In both stimulation conditions; a large proportion of genes (34.7% in BCG and 38.2% in LPS stimulation) were common between T0 and T2 (Figure 8B). These commonly upregulated genes included several cytokine/chemokine mediators; for which we had already measured protein levels (Figures 5, 6, and 7). The expression of LPS-stimulated IL1B at T2 (log FC = 3.9) was marginally higher compared to T0 (log FC = 3.43) (File S2). Similarly, IL1RA/IL1RN expression at T2 (log FC = 3.32) was marginally higher than T0 (log FC = 2.93) in LPS-stimulated cells (please refer File S2). In addition, BCG-stimulated IFNG at T2 (log FC = 3.69) was higher than T0 (log FC = 2.59). These differences in transcript expression levels corroborate the pattern of changes from T0 to T2 observed in secreted cytokine levels (Figures 5, 6, and 7). However, transcript expression of other pro-inflammatory mediators including IL-6, GMCSF/CSF2, and CXCL8/IL8 was lower at T2 compared to T0 (please refer to File S2). The pathways derived from transcript expression were largely similar at T2 and T0 in both BCG- and LPS-stimulated cells (Figure S10). Some of the upregulated immune pathways common to T0 and T2 in both LPS- and BCG-stimulated cells were Toll-like receptor (TLR) signaling, nucleotide-binding and oligomerisation domain (NOD)-like receptor signaling, and chemokine signaling (Figure S10). Downregulated pathways were more in number compared to upregulated pathways at both T0 and T2 in LPS- and BCG-stimulation conditions and grouped primarily into the categories of metabolism, immune disease, immune function, and viral immune responses (Figure S10).
Figure 8.

BCG revaccination causes several changes in transcriptome of in vitro BCG- and LPS-stimulated cells
PBMC from N = 11 (male = 5, female = 6) donors at T0 and T2 were stimulated with either BCG or LPS. Unstimulated cells were used as control. RNA was extracted from stimulated cell pellets at 24 h and subjected to sequencing.
(A) Volcano plots showing down- and upregulated genes (adjusted p < 0.05 and absolute fold change >1.5) at T0 and T2 for the unstimulated control along with BCG and LPS stimulation conditions after subtraction of unstimulated control.
(B) DEGs (adjusted p < 0.05 and absolute fold change > <1.5) at T0 and T2 were compared using Venn diagrams for BCG and LPS stimulation to identify unique and common DEGs. Venns for total, up and downregulated genes are shown separately.
(C) Over-represented pathways (p < 0.05) derived from uniquely up- and downregulated genes at T2 for both BCG and LPS stimulation are depicted on a bubble plot with size and color gradient of the bubble depicting DEGs proportion and pathway enrichment p-value, respectively.
(D) Unique DEGs common to LPS and BCG at T2 were identified and their fold change relative to unstimulated was plotted. The yellow shaded area shows upregulated and the blue shaded area shows downregulated genes.
Next, an analysis of uniquely upregulated genes at T2 was done to understand the impact of BCG revaccination (Figure 8C). The number of uniquely upregulated genes at T2 in BCG-stimulated cells was 29, and in LPS-stimulated cells it was 42 (Figure 8B). A pathway analysis of these genes revealed more uniquely upregulated pathways in LPS compared to BCG owing perhaps to the differences in signaling cascades downstream of the two stimuli. Uniquely upregulated pathways at T2 in BCG-stimulated cells primarily comprised immune related pathways, e.g., cytokine-cytokine receptor interaction, TNF signaling, and IL17 signaling (Figure 8C). Some of these were common to LPS, e.g., TNF and IL-17 signaling. Additional immune-related pathways uniquely upregulated in LPS at T2 were TLR signaling, C-type lectin receptor, and Vascular and Endothelial Growth factor (VEGF) signaling pathways. Apart from immune-related pathways, LPS-stimulated cells also uniquely upregulated metabolic pathways: glycosaminoglycan and O-glycan biosynthesis (Figure 8C). The number of uniquely downregulated genes in BCG-stimulated cells was 73, and in LPS it was 63 (Figure 8B). The seemingly dominant downregulated pathway signature included (1) immune-related pathways: immunoglobulin A (IgA) production, Th17/Th1/Th2 differentiation, hematopoietic cell lineage, etc; (2) inflammatory disease pathways: graft-versus-host disease (GVHD), asthma, systemic lupus erythromatosus (SLE), inflammatory bowel disease, type 1 diabetes mellitus, etc; (3) metabolism pathways: glycolysis/gluconeogenesis, riboflavin/pyruvate metabolism, amino acid biosynthesis, etc; (4) virus response-associated pathways specially in LPS (Figure 8C).
A further analysis helped in identification of upregulated genes that were unique for T2 and common to both BCG and LPS and could be labeled as a signature induced by BCG revaccination: CCL4L2, PTGS2, TNFRSF1B, BHLHE40, NFKBIZ, BIRC3, CPD, and SIRT6, some of which are part of the TNF and IL-17 signaling pathways uniquely upregulated at T2 in both LPS- and BCG-stimulated cells (Figure 8D). There were 38 unique downregulated genes common to LPS and BCG stimulation: LAMP2, KMO, IGSF6, AKR1A1, ARPC4, UBXN11, TBC1D14, CLEC12A, PCSK7, LPCAT2, MPP1, HLA-DRA, HLA-DMA, GAPT, DDAH2, PARP9, CTSC, HSD11B1, ZNF385A, FOS, UTRN, BLVRBB, SDHB, IST1, SEMA4A, CDC42EP1, SDS, CXCL11, ACE, CTSS, RIPOR2, TCN2, PLD3, LGALS9, LGALS2, LSP1, FUCA1, and CCL24. Some of the pathways that these genes grouped into were tuberculosis, lysosome, phagosome, antigen processing and presentation, T-helper differentiation.
Discussion
This study provides an in-depth longitudinal analysis and characterization of innate/trained immune responses upon BCG revaccination in an Indian population. Firstly, we demonstrate that BCG revaccination significantly boosts anti-mycobacterial CD4 T cell adaptive immune responses including frequencies of polyfunctional CD4 T cells which recapitulates previously reported observations in other BCG revaccination studies.20,21,40 Secondly, we report the increased production of hallmark trained immunity cytokines TNF-α, IL-1β, and IL-6 in HLA-DR+CD14+CD16− monocytes and after revaccination in response to mycobacterial PAMP (BCG and E/C) stimulation in whole blood. Moreover, the anti-mycobacterial CD4 T cell and monocyte responses correlated positively, and the simultaneous stimulation of both arms of the immune system perhaps contributed toward mycobacterial growth control in about 36% of vaccinees. Thirdly, we demonstrate that the sites for BCG revaccination-induced TI changes in context of homologous (BCG) and heterologous (E/C, LPS) PAMPs are HLA-DR+CD14+ monocytes and not CD56int NK, CD56hi NK, NKT, and γδ T cells. Fourthly, BCG revaccination boosted PBMC innate responses to heterologous bacterial and fungal PAMPs and type I IFN responses to viral PAMPs. Importantly, this increase in pro-inflammatory markers of trained immunity as a consequence of BCG revaccination was counterbalanced by enhanced expression of regulatory cytokines, mainly IL-1RA. Finally, BCG revaccination resulted in abundant changes in transcriptome of BCG- and LPS-stimulated cells; some of these changes recapitulated our cytokine expression data; e.g., IL-1β and IL-1RA were strongly upregulated at T2 compared to T0 at both RNA and protein levels.
BCG vaccination provides partial protection against TB in adulthood41 especially in India, where despite mandatory childhood vaccination there are approximately 1.9 million active TB cases annually.23 Moreover, the prevalence of latent TB (40%)42 and exposure to non-tuberculous mycobacteria (up to 8.6%) is also high in India.43 Immunity generated as a result of childhood BCG vaccination wanes with age,44,45 and hence evaluation of BCG revaccination for boosting declining anti-mycobacterial immunity has been proposed.40,44 Indeed, BCG revaccination boosted mycobacteria-specific CD4+ T cell cytokine responses20,21,40, an observation that we successfully reproduced in this study. The impact of BCG revaccination on a clinical endpoint, e.g., Interfero gamma release assay (IGRA) conversion or incidence of TB disease, has however been found to be variable40,46,47 and needs to be investigated further. In addition to induction of adaptive immunity, it is vital to also consider the role of BCG-induced innate trained immune responses in anti-mycobacterial defense.18 The generation of an innate trained immune response can contribute to early clearance of M. tuberculosis.18,48 Ex vivo BCG exposure as well as in vivo BCG vaccination have been shown to increase anti-mycobacterial activity in macrophages and monocytes through mechanisms involving enhanced reactive oxygen species (ROS),49 elevated expression of CD11 and TLR4 indicative of higher phagocytic activity,31,50 and higher expression of pro-inflammatory cytokines such as TNF-α, IL-1β, and IFNγ.31 In our study as well, BCG revaccination led to enhanced expression of mycobacteria (BCG and E/C)-induced TNF-α, IL-1β, and IL-6 both at the PBMC and whole blood level. The cellular source of these changes was identified as being the HLA-DR+CD16−CD14hi monocytes providing evidence for the generation of a response-ready trained monocyte population. The increase in trained immunity cytokines was accompanied by boosting of adaptive IFNγ, TNF-α, and IL-2 and polyfunctional CD4+ T cell responses adding to existing evidence that BCG-induced trained immunity can synergize with adaptive responses in infants and adults.51,52 However, the simultaneous increment in anti-mycobacterial innate and adaptive capacities translated into enhanced mycobacterial growth control in only a proportion of vaccinees suggesting that factors controlling mycobacterial growth control as measured by an in vitro PBMC MGIA in the present cohort may extend beyond generation of elevated TNF-α, IL-1β, and IL-6 innate and IFNγ, TNF-α, and IL-2 adaptive responses after BCG revaccination as has been suggested previously.53 The time at which the MGIA was performed, i.e., 10–12 weeks after BCG revaccination could also have an influence on the outcome; the peak growth control can vary between vaccinees.19 Also, as previously demonstrated, primary BCG vaccination leads to better mycobacterial growth control compared to revaccination.54 However, from our study, it is evident that a considerable proportion of vaccinees did not acquire mycobacterial growth control after BCG revaccination (no control), and the causes for this are an area of active investigation with future studies designed to better understand inherent MGIA assay variation.
Apart from anti-mycobacterial immunity, enhanced innate responses against non-mycobacterial PAMPs is a key feature of BCG immunization. We observed augmented TNF-α, IL-1β, and IL-6 to bacterial and fungal PAMPs after revaccination demonstrating the generation of a cellular TI phenotype. Also, viral PAMP induced type-I IFN response markers; i.e., IFNα and CXCL-10 were enhanced at T2 suggesting that revaccination-induced TI impacts responses downstream of diverse TLRs/pattern recognition receptors (PRRs). The effects of BCG-induced TI were observed in a PAMP-specific manner. Bacterial and fungal, but not viral, PAMP-stimulated TNF-α, IL-1β, and IL-6 were boosted by BCG revaccination. On the other hand only viral, and not bacterial or fungal, PAMP-induced CXCL-10 and IFNα increased after revaccination. Therefore, revaccination did not convert poor responses into strong ones suggesting that it has the capacity to only amplify existing potent cytokine/chemokine expression.
It is important to note that experiments performed in whole blood and PBMC cannot negate the impact of counterregulatory mediators from multiple cellular sources on the TI effectors measured; for example, T cell-derived IFNγ can impact macrophage-trained immunity responses against fungal and bacterial pathogens in mice and human studies;55,56 this may also be relevant in our experimental system as we report increased CD4+ T cell IFNγ expression at T2 relative to T0 to in vitro BCG stimulation (Figure 2). Therefore, while crosstalk cannot be ruled out, the following two observations indicate this may be unlikely in our system: firstly, analysis of our flow cytometry data (Figure S6) showed that no significant TI changes in TNF-α, IL-1β, and IL-6 occurred in other innate subsets tested; the only significant changes took place in monocytes (Figure 3); and secondly, no significant difference in IFNγ between T2 and T0 time points was observed in cultures with several PAMPs: C. albicans, LPS, Pam-3-CSK, and Poly I:C (Figure 6).
A prominent feature of the immune response after BCG revaccination was the significant increment in IL-1RA at the protein as well as at transcription level. IL-1RA is a member of the IL-1 family of cytokines that binds non-productively to IL-1R1 and prevents binding of IL-1α and IL-1β to the receptor for induction of an intracellular signal.57 Recombinant IL-1RA has been shown to dampen trained immunity responses.58,59 In zymosan-trained mice, administration of anakinra increases disease severity after infection with L. monocytogenes.59 Pulmonary bacterial burden upon M. tuberculosis infection was higher in β-glucan-trained mice that were treated with IL-1RA.60 Addition of IL-1RA to oxLDL-trained human monocyte cultures causes reduction in TNF-α and IL-6 upon LPS restimulation.61 On the other hand, correcting the balance between IL-1β and IL-1RA by administration of the clinical preparation of recombinant IL-1RA (anakinra) was beneficial in reducing symptoms of inflammatory gouty arthritis.62 In our study the elevation of pro-inflammatory TI markers, e.g., TNF-a, IL-1β, and IL-6, was paralleled by an increase in IL-1RA production. Interestingly, enhanced BCG growth control in re-vaccinees was associated with higher IL-1RA production. These data suggest that the amounts of IL-1RA induced after BCG revaccination do not interfere or dampen classical TI-associated processes/functions but rather contribute toward generation of a balanced immune response which might be protective in scenarios of excessive inflammation induced by exposure to a heterologous PAMP/pathogen.
The study of a molecular signature 10–12 weeks after BCG revaccination in 24 h BCG- and LPS-stimulated culture identified a set of 8 upregulated genes which are either involved in IL-17 or TNF signaling or regulators of inflammation. PTGS2/COX2 and NFKBIZ are well-characterized mediators of Th17 differentiation.63,64 In addition, IL17F was also significantly upregulated at T2 in BCG-stimulated PBMC. The induction of mycobacteria-specific IL-17+ CD4+ T cells has been previously demonstrated to be a feature of BCG revaccination,20 and the identification of an IL-17 molecular signature in the present study reinforces this observation. The 8-gene signature also included TNFRSF1B/TNFR2 and BIRC3/cIAP2 which are important for TNF-α-mediated signaling.65,66 BIRC3/cIAP2 is also vital for NOD-1- and NOD-2-mediated effects.67 BHLHE40, a transcriptional regulator which drives inflammation by boosting IFNγ and GM-CSF and downregulating IL-10,68 was also part of the 8-gene signature. An interesting component of the same gene signature is SIRT6, a histone deacetylase that is both a modulator of immune cell metabolism and a negative regulator of inflammatory innate immune responses,69 underpinning the fact that BCG revaccination perhaps leads to the generation of a balanced immune response.
The signature of downregulated genes after BCG revaccination comprised several known markers of inflammation, e.g., CCL24/Eotaxin,70 CXCL1171, HLADRA,72 and cysteine peptidases CTSC and CTSS.73 Fos proto-oncogene, AP-1 transcription factor subunit (FOS), which is part of several pathways and is a component of the AP-1 transcription factor, was also downregulated. FOS has been shown to be a negative regulator of iNOS, TNF-α, IL-6, and other inflammatory genes.74 Interestingly, ACE or angiotensin converting enzyme which is expressed on the cell surface of a wide variety of cells75 was also downregulated. An increase in ACE/ACE2 ratio is a predisposing cause of severe COVID-19, and a decrease in ACE levels can improve disease outcomes.75
In conclusion, we demonstrate that BCG revaccination in a population with a high infectious burden induces trained immunity and thus has the potential to influence susceptibility to infections. These changes have been demonstrated at both functional and transcriptional level. Transcriptomic changes induced by BCG at 10–12 weeks after revaccination impact both pro- and anti-inflammatory mediators thus contributing to a balanced immune response which influences innate and subsequently adaptive immunity to not just mycobacteria but heterologous PAMPs, antigens, and vaccines.22 Taken together, our data provide mechanistic insight to how BCG revaccination can potentially promote basal host immunity.
Limitations of the study
One of the limitations of the current study is the small sample size imposed by funding. Nevertheless, we have successfully demonstrated major characteristics of trained immunity induced by BCG revaccination, a first from India, a TB endemic region. It is important to note that this study was performed in samples collected just before the COVID-19 pandemic; therefore, a strength of this study is that the characteristics of BCG revaccination-induced immunity is independent of any potential impact of severe acute respiratory syndrome coronavirus 2 (SARS-CoV-2) infection and vaccination. Also, efforts were made to avoid sex bias, but the specific impact of sex on BCG revaccination-induced TI was not studied. Further, we acknowledge that this study does not address the mechanisms that underpin inherent heterogeneity observed in our samples in the mycobacterial growth control assay.
STAR★Methods
Key resources table
| REAGENT or RESOURCE | SOURCE | IDENTIFIER |
|---|---|---|
| Antibodies | ||
| CD3 BV570 | Biolegend | Cat No. 300436, Clone: UCHT1, AB_2562124 |
| CD4 BUV395 | BD Biosciences | Cat No. 563550, Clone: SK3, AB_2738273 |
| CD8 BV711 | BD Biosciences | Cat No. 563677, Clone: RPAT8, AB_2744463 |
| CD14 BV510 | Biolegend | Cat No. 301842, Clone: M5E2 AB_2744463 |
| CD16 APCH7 | BD Biosciences | Cat No. 560195, Clone: 3G8 AB_1645466 |
| CD56 BUV737 | BD Biosciences | Cat No. 612766, Clone: NCAM16.2 AB_1645466 |
| γδ TCR PECF594 | BD Biosciences | Cat No. 562511, Clone: B1 AB_2737631 |
| HLA-DR PECy5 | BD Biosciences | Cat No. 555813, Clone: G46-6 AB_396147 |
| IFNγ V450 | BD Biosciences | Cat No. 560371, Clone: B27, AB_1645594 |
| IL2 APC | BD Biosciences | Cat No. 554567, Clone: MQ1-17H12, AB_398571 |
| TNFα BV650 | Biolegend | Cat No. 502938, Clone: MAb11, AB_2562741 |
| IL1β FITC | Thermo Fisher Scientific | Cat No. 340515, Clone: AS10, AB_400438 |
| IL6 PE-Cy7 | Thermo Fisher Scientific | Cat No. 25-7069-42, Clone: MQ2-13A5, AB_2573522 |
| IL8 PerCP-eFluor710 | Thermo Fisher Scientific | Cat No. 46-8088-42, Clone: 8CH, AB_10805748 |
| IL10 BV786 | BD Biosciences | Cat No. 564049, Clone: JES39D7, AB_2738563 |
| GzB Alx700 | BD Biosciences | Cat No. 560213, Clone: GB11, AB_1645453 |
| CD14 BV421 | BD Biosciences | Cat No. 565283, Clone: M5E2, AB_2739154 |
| IFNγ APC | Biolegend | Cat No., 506510, Clone: B27, AB_315443 |
| TNFα BV605 | Biolegend | Cat No., 502936Clone: MAb11, AB_2563884 |
| Biological samples | ||
| Whole blood and PBMC samples from volunteers pre and post BCG revaccination | St. John’s Medical College Hospital, Bangalore, India | NA |
| Chemicals, peptides, and recombinant proteins | ||
| Histopaque 1077 | Sigma Aldrich | Cat# 10771 |
| Live/Dead Fixable Aqua Dead Cell Stain Kit | Thermofisher | Cat# L34966 |
| UltraComp eBeads | Invitrogen | Cat# 01-2222-42 |
| ESAT6/CFP10 fusion protein | Department of Infectious Diseases, Leiden University Medical Center | NA |
| BCG vaccine (Tubervac) | Serum Institute of India | NA |
| Ag85A peptide pools | Kind gift from Vaccine and Infectious Disease Division, Fred Hutchinson Cancer Research Center, Seattle, Washington, USA20 | NA |
| LPS | Sigma | Cat# L2630-10MG |
| C. albicans (heat killed) | Dr. David Moyes, King’s College London, UK | NA |
| Pam-3-CSK | Sigma | Cat# 506350-2MG |
| Poly I:C | Invivogen | Cat# tlrl-pic |
| Brefeldin A Solution (1,000X) | Biolegend | Cat# 420601 |
| Monensin Solution (1,000X) | Biolegend | Cat# 420701 |
| BD FACS Lysing Solution 10X Concentrate | BD Biosciences | Cat# 349202 |
| Paraformaldehyde | Electron Microscopy Sciences | Cat# 15712-S |
| BD Phosflow Perm/Wash Buffer I | BD Biosciences | Cat# 557885 |
| TRI Reagent | Zymo Research | Cat# R2050-1-200 |
| RPMI | Gibco | Cat# 72400-047 |
| Penicillin-Streptomycin-Glutamine | Gibco | Cat# 10378-016 |
| FBS | Gibco | Cat# 10270-106 |
| Human AB Serum | Sigma | Cat# H4522-100mL |
| PBS | Gibco | Cat# 14190-136 |
| DMSO | Sigma | Cat# D2650 |
| EDTA Solution | Sigma | Cat# E8008 |
| Benzonase | Merck | Cat# 101697 |
| Chloroform | Merck | Cat# 107024 |
| Isopropanol | Merck | Cat# 109634 |
| Glycogen | Invitrogen (Thermofisher) | Cat# AM9510 |
| Nuclease free water | Ambion (Fisher Scientific) | Cat# AM9932 |
| BD BACTEC™ MGIT™ barcoded 7-mL tube | BD | Cat# 245122 |
| BD BACTEC™ MGIT™ 960 supplement kit | BD | Cat# 245124 |
| Middlebrook 7H10 Agar | BD | Cat# PA-254520.07 |
| OADC | BD | Cat# 212240 |
| QuantiFERON-TB Gold Plus Blood Collection Tubes | Qiagen | Cat# 622536 |
| QuantiFERON-TB Gold Plus Reference Lab Pack ELISA Kit | Qiagen | Cat# 622832 |
| Critical commercial assays | ||
| TNFα ELISA | BD | Cat# 555212 |
| IL-1β ELISA | Biolegend | Cat# 437004 |
| IL-6 ELISA | Biolegend | Cat# 430501 |
| Customized multi-plex bead array kit | R & D | NA |
| CD14 monocyte isolation kit | Thermofisher | Cat# 11350D |
| NEB Low Input RNA Kit | NEB | Cat# E6420 |
| QIASeq FX DNA Library Preparation kit | Qiagen | Cat# 180475 |
| JetSeq Magnetic Beads | Bioline | Cat# 68031 |
| Deposited data | ||
| RNA Seq data from PBMC pre and post BCG revaccination deposited in NCBI database: BioProject Accession: PRJNA950559 | https://www.ncbi.nlm.nih.gov/bioproject/950559 | |
| Software and algorithms | ||
| GraphPad Prism 9.2 | GraphPad Software by Dotmatics | https://www.graphpad.com |
| FlowJo 10.8.0 | BD Biosciences | https://www.flowjo.com |
| BD FACSDiva™ version 8.0.1 | BD Biosciences | http://www.bdbiosciences.com/en-us |
| Pestle version 1.8 | Roederer et al.76 | https://niaid.github.io/spice |
| SPICE version 6.1 | Roederer et al.76 | https://niaid.github.io/spice/ |
| OMIQ analysis for flow cytometry data | Dotmatics | www.omiq.ai |
| fastqc_v0.11.9 | Babraham Bioinformatics | https://www.bioinformatics.babraham.ac.uk/projects/fastqc/ |
| fastp-0.23.2 | Chen et al.77 | https://github.com/OpenGene/fastp |
| hisat2-2.2.1 | Kim et al,78 | http://daehwankimlab.github.io/hisat2/download/ |
| stringtie-2.2.1 | Pertea et al,79 | https://ccb.jhu.edu/software/stringtie/ |
| limma-3.52.1 | Ritchie et al,80 | https://bioconductor.org/packages/release/bioc/html/limma.html |
| R-4.2 | R Core Team (2021) | https://www.R-project.org/ |
Resource availability
Lead contact
Requests for additional information and resources should be directed to the lead contact, Annapurna Vyakarnam (anna.vyakarnam@kcl.ac.uk; annapurna.v@sjri.res.in)
Materials availability
This study did not generate new unique reagents.
Experimental model and study participant details
Recruitment of study participants
This study was performed according to guidelines of the Helsinki Declaration and was approved by the Institutional Ethics Review Committee of St. John Medical College Hospital, Bangalore, IEC Ref no: (IEC/1/896/2018). Informed and written consent was taken from all study participants. Healthcare workers aged 18-23 of St. John’s Medical College-Hospital (SJMCH), Bangalore, India were enrolled in the study from October 2019 to June 2021.22 As shown in Figures 1C total of 277 adult individuals (of Indian ethnicity), were contacted of which N=103 (N=47 male and N=56 female, median age 20) volunteers were enrolled. All enrolled volunteers were confirmed as having received BCG vaccination at birth and did not have any chronic illness such as hypertension, diabetes mellitus, heart disease, cancer, kidney / thyroid illness, asthma, epilepsy, jaundice, history of clinical tuberculosis disease. Individuals on medication were also excluded. Participants were screened for latent Mycobacterium tuberculosis (Mtb) infection by the standard QFT TB Gold In-tube test (Qiagen) performed at Department of Microbiology, SJMCH, India, and N=66 (N=33 male; N=33 female, median age 20) were confirmed as IGRA-. A total of N=35 (N=18 female, N=17 male, median age 20) consented for BCG revaccination. Summarised information regarding revaccinated individuals is shown in Figure 1A and detailed information is included in File S1.
Study design
A prospective observational study was conducted to evaluate the effect of BCG revaccination on subsequent innate and adaptive immunity to mycobacteria and other heterologous pathogen associated molecular patterns (PAMPs). N=35 volunteers who gave their consent were revaccinated with BCG. BCG vaccine (TUBERVAC™, Russian BCG strain manufactured at Serum Institute of India, Pune, India), used widely in the Indian national immunization program, was administered intradermally at day 0 at an adult dose of 2 × 10⁵ to 8 × 10⁵ CFU in participants. Blood was collected from participants at days 0 (T0) and 10-12 weeks (T2), (Figure 1B). Some BCG re-vaccinees reported minor side effects including itching, rash, or pain at the site of vaccination; mild fever; cough; and headache. Information regarding this is summarised in File S1. As shown in Figures 1C random selection of donors was made for performing immune-assays: N=20 for whole blood stimulation assays and a sub-set of that (N=13) were used for the PBMC PAMP stimulation assay (Figure 1C).
Method details
Peripheral blood mononuclear cell isolation
Blood (16-20 ml) was collected in Na-Heparin tubes (BD, Franklin Lakes NJ, USA) and peripheral blood mononuclear cells (PBMCs) were isolated using 15ml ACCUSPIN (Sigma-Aldrich) tubes by density centrifugation as described previously.20 Briefly, blood was diluted two-fold with PBS (Gibco by Life Technologies, Washington, DC, USA) + 2% FBS (Gibco), pipetted into ACCUSPIN tubes pre-filled with Histopaque 1077 (Sigma) and centrifuged at 1000g for 15 minutes at room temperature without deceleration. PBMCs from the buffy coat were washed twice with PBS + 2% FBS, then re-suspended at 10 x 106 cells/mL in cryopreservation medium (90% FBS and 10% DMSO-Sigma) and incubated overnight at -80°C (in Mr. Frosty™ freezing container; Nalgene, Rochester, New York, U.S.) and were stored in liquid nitrogen until further analyses.
Whole blood ICS assay to track mycobacteria induced/specific innate and adaptive responses
Heparinized whole blood was collected from participants and processed within 30-45 min of phlebotomy, as previously described.20,22 Briefly, 400μl of blood was pipetted into 5ml polypropylene tubes (Sarstedt, Germany) and stimulated with Ag85A peptide pools (1 μg/ml per peptide), BCG (0.2 x 10⁶ CFU/ml) or purified recombinant protein ESAT-6:CFP-10 (10μg/ml) together with anti-CD28/CD49d costimulatory mAbs at 0.5 μg/ml. Culture medium with anti-CD28/CD49d was used as unstimulated negative control. Blood was incubated at 37°C for a total of 12 h, and Brefeldin A + Monensin (Biolegend) diluted to a final concentration of 1X from a 1000X stock was added in the final 10 h of stimulation. After stimulation, blood was treated with 2 μM EDTA (Sigma), RBCs were lysed with 4.5 ml 1X FACS Lysing solution (BD), and fixed white blood cells were transferred to liquid nitrogen in freezing medium containing 10% DMSO, 40% FCS, and 50% RPMI 1640. On the day of staining, cryopreserved whole-blood samples were thawed in a water bath at 37°C for 2 min. Thawed cells were transferred to labelled tubes containing 2 mL of PBS and were centrifuged at 800g for 5 min. Cells were then stained with a 50 μl cell surface staining cocktail (details in Table 1) prepared in PBS + 2% FBS for 30 min at room temperature (RT) in the dark. Next, the cells were washed with PBS, permeabilized by adding 200 μl 1X Perm/Wash solution (BD Biosciences) and incubated at RT for 20 min. Pelleted cells were immediately stained with a 50 μl cocktail containing antibodies against intracellular markers (details in Table 2) for 30 min at RT. Cells were washed and re-suspended in 100μl of 1% paraformaldehyde (Electron Microscopy Sciences, Hatfield, PA, USA) for flow cytometry analysis.
Mycobacterial growth inhibition assay (MGIA)
A previously optimized ‘in tube’ MGIA Euripred protocol was used for the MGIA.19 Cryopreserved PBMCs were thawed and rested in RPMI (Gibco life sciences, ThermoFisher Scientific Inc., Bleiswijk, the Netherlands) supplemented with glutamax (Gibco) and 10% FBS (Hyclone, ThermoFisher Scientific Inc.) (=R10 medium) at a concentration of 2x10⁶ cells/mL for 2 hours in the presence of benzonase (20U/mL, Merck, Amsterdam, the Netherlands). After resting, cells were washed with R10 medium and counted with a Casy Cellcounter (Roche, Woerden, the Netherlands). 1x10⁶ PBMCs were co-cultured for 4 days in RPMI supplemented with glutamax and 10% autologous human serum with 2.38 log CFU (+/- 0.17 SD) BCG P3 on a rotator in a 37°C humidified CO2 incubator in a final volume of 600 μl. All samples were run in duplicates. After 4 days, the sample was transferred to a PANTA/Enrichment supplemented MGIT tube (Becton Dickinson, Erembodegem, Belgium) and placed in a BACTEC MGIT 960 system (BD) until time to positivity (TTP) was reached. All tubes included in the analysis were checked visually for mycobacterial growth. Samples reaching positivity within 100 hours were considered contaminated and thus deleted as false positive, since the inoculum of 2.38 log CFU BCG is expected to reach TTP after more than 250 hours. As a control for the BCG inoculum all experiments included a serial dilution (107 to 102) of the BCG stock for time to positivity in PANTA/Enrichment supplemented MGIT tubes and plating on Middlebrook 7H10 agar plates, supplemented with 10% OADC (BD) for CFU determination. When all dilutions showed colonies on the 7H10 plates, plates were scanned on a Canon Scanner 9000F and colonies were counted using ImageJ software. CFUs were converted to log CFU and plotted against TTP. Linear regression analysis was applied (GraphpadPrism software v 8.1), all samples were transposed and data was plotted as log CFU. Δlogcfu (T2-T0) was calculated and a Δ < -0.17 (SD mean inoculum) in a sample was considered as acquired control at T2; Δ > 0 was considered as no control. A sample having 50% or less of the inoculum i.e. 0.513 log cfu at T0 was considered as already controlling.
Flow cytometry analysis for delineating major immune sub-sets in PBMC
A minimum of 1x10⁶ rested cells were incubated with cell viability dye in PBS, washed in PBS/0.1% BSA (Sigma, Merck Life Science NV, Amsterdam, the Netherlands) followed by blocking Fc receptors with 5% human serum in PBS for 10 minutes, washed and incubated with an antibody cocktail for surface markers at 4°C for 30 minutes as described previously.81 Cells were washed twice and fixed for 10 minutes at room temp with 1% paraformaldehyde (Pharmacy LUMC, Leiden, The Netherlands). Cells were washed once more and stored at 4°C for acquisition on a 5L Cytek®Aurora (Cytek Biosciences, Fremont, CA, USA) the following day the LUMC flow core facility (https://www.lumc.nl/research/facilities/fcf/). Analysis was performed using OMIQ analysis software (www.omiq.ai).
PAMP stimulation of PBMC
Cryopreserved PBMC samples were rapidly thawed in a 37°C water bath, transferred to 15ml tubes containing ∼ 3ml RPMI+10% FBS and centrifuged at 800g for 5min at RT. A total of 200,000 cells resuspended in 200μL culture medium [RPMI-1640 (GIBCO, Invitrogen) supplemented with 10% FBS (GIBCO), 100U/ml penicillin and 100μg/ml streptomycin, (SIGMA)] were seeded per well in 96-well flat-bottom plates (Eppendorf) and stimulated with either 106 cfu/ml of heat-killed Candida albicans strain SC5314 (kind gift from David Moyes; King’s College London), 0.2 x 10⁶ cfu/ml of BCG (TUBERVAC™, Serum Institute of India), 50μg/ml Pam3CSK4 (Sigma), 1ng/ml LPS (Sigma) or 100μg/ml Poly I:C (Invivogen). Cells cultured with medium alone were used as negative control. 24hr later plates were centrifuged at 800g for 3 min and culture supernatants collected and frozen at -20°C till ELISA was performed. For measurement of effector responses by flow-cytometry, PBMC were thawed as described above. Cells were seeded at 1 x 10⁶ cells/well in a 96-well flat-bottom plate (BD) and stimulated with 1ng/ml LPS, unstimulated cells were used as controls. Cells were stimulated for a total of 6hrs, Brefeldin A + Monensin (Biolegend) diluted to a final concentration of 1X from a 1000X stock was added in the final 4h of stimulation. After 6hrs cells were stained with a panel of antibodies against cell surface and intracellular cytokine markers (Table S1).
Intracellular cytokine staining of LPS stimulated PBMC
At the end of stimulation PBMC were washed after incubation with 2μM EDTA (Sigma) and first stained with 5 μl Live/Dead Aqua (Invitrogen) followed by a 50 μl cell surface staining cocktail (Table S1) for 30 min at RT in the dark. Cells were then fixed for 20 min with 100 μl 1X FACS lysis buffer and permeabilized with 200μl 1X BD Perm/Wash buffer for 20 min. PBMCs were washed and incubated for 30 min at RT in the dark with a 50 μl intracellular staining cocktail (Table S1). Finally, cells were washed with 150 μl Perm/Wash buffer and resuspended in ∼100μl of 1% paraformaldehyde for flow cytometry analysis. Please see Table S1 for details of antibodies used for staining.
ELISA measurements for TNF-α, IL-1β and IL-6
Supernatants from PAMP stimulation cultures were used for measuring concentrations of TNF-α, IL-1β and IL-6 exactly as per manufacturer’s instructions (TNFα-BD; IL-1β-Biolegend and IL-6-Biolegend). For each ELISA, assay background was subtracted from absorbance values. Also, the spontaneous cytokine release in cells cultured with medium alone was subtracted from all PAMP stimulation conditions.
Multiplex bead array
A customised multiplex bead array panel (R & D Systems) was used for measuring levels of CXCL-10, IFN-α, CXCL-9, GM-CSF, IL-12p70, IL-10, IL-1RA and IFN-γ according to manufacturer’s instructions. Briefly, 50μl of culture supernatant was incubated with 50μl of capture magnetic beads for 2 hrs on a plate shaker. The magnetic beads were washed thrice. Next, beads were incubated for 1 hr with biotin conjugated detection antibody cocktail, washed 3X and finally incubated with Streptavidin-PE for 30min. At the end of incubation, beads were washed thoroughly 3X, resuspended, and the samples were run on a Luminex MAGPIX xMAP plate reader. A nine point standard curve was included in each run and cytokine/chemokine concentrations were calculated using the xPONENT software. The spontaneous cytokine release in cells cultured with medium alone was subtracted from all PAMP stimulation conditions.
In vitro training of monocytes
Monocytes were isolated from N=7 healthy volunteers (female=4 and male=3; median age = 25), BCG vaccinated at birth, IGRA-ve and having no previous history of TB. PBMC were first isolated from heparinised blood collected and subsequently monocytes were isolated from PBMC using a CD14 negative selection kit (Dynabeads, Thermo-fisher) according to manufacturer’s instructions. Purified monocytes were resuspended in RPMI + Glutamax + 10% human AB serum (Sigma) and seeded at 0.1 x 10⁶/well in 96-well flat-bottom plates. Monocytes were trained with 100,000 cfu/ml of BCG (TUBERVAC, Serum Institute of India) for 24hrs, washed with warm PBS and rested for 5 days in RPMI+Glutamax+10% FBS. Monocytes not trained with BCG were used as negative controls. Medium was changed once at 3 days. On the 6th day, monocytes were washed with warm PBS and restimulated with 1ng/ml LPS. After 24hrs of restimulation, supernatants were collected and concentrations of TNFα, IL-1β and IL-6 were measured by ELISA. A diagrammatic representation of the protocol for in vitro training is shown in Figure S9A.
RNA isolation and sequencing
The PAMP stimulated PBMC pellet post-harvesting of culture supernatant was resuspended in 200μl of TRIZOL (Zymo Research) and stored in -80°C. For RNA isolation, the samples were thawed and the volume of TRIZOL was increased to 1ml. Phase separation was performed by addition of 200μl of chloroform (Merck) and centrifugation at 13200 rpm for 15 min at 4°C. Aqueous phase was transferred to a fresh tube and RNA was precipitated overnight at -80°C by addition of isopropanol (Merck) and glycogen (Invtirogen). RNA pellet was recovered by centrifugation, air-dried and re-suspended in nuclease-free water (Ambion). The RNA was quantified and its integrity was measured using TapeStation System (Agilent). Samples with a RIN below 6 were not taken forward for sequencing. cDNA synthesis was carried out using NEB Low Input RNA Kit (NEB, Catalogue No. E6420), the final product thereby was used as template for library preparation using QIASeq FX DNA Library Preparation kit (Catalogue No.180475) at Genotypic Technology Pvt. Ltd., Bangalore, India. Briefly, RNA was subjected to first-strand cDNA synthesis using NEB Low Input RNA Kit (NEB, Catalogue No.E6420) whereby priming was carried out with the help of NEBNext RT primer mix and NEBNext oligonucleotide for template switching at the 5′ end of the transcript. The first strand synthesis was followed by cDNA amplification using PCR. The double stranded cDNA was purified using JetSeq Magnetic Beads (Bioline, Catalogue No. 68031). The cDNA was quantified by Qubit fluorometer (Thermo Fisher Scientific, MA, USA). 1-10 ng of Qubit quantified cDNA was enzymatically fragmented, end-repaired and A-tailed in a one-tube reaction using the FX Enzyme Mix provided in the QIASeq FX DNA kit. The end-repaired and adenylated fragments were subjected to adapter ligation, whereby index-incorporated Illumina adapter was ligated, to generate sequencing libraries. These libraries were subjected to 10 cycles of Indexing-PCR (initial Denaturation at 98°C for 20 sec, cycling (98°C for 20sec, 60°C for 30sec, 72°C for 30sec) and final extension at 72°C for 1min) to enrich the adapter-tagged fragments. Finally, the amplified libraries were purified using JetSeq clean up beads (Bioline, Catalogue No. 68031) and quantified by Qubit fluorometer (Thermo Fisher Scientific, MA, USA) and the fragment size distribution analyzed on Agilent 2200 TapeStation. The libraries were pooled in equimolar quantities and sequenced on Illumina NovaSeq 6000 sequencer (Illumina, San Diego, USA) using 150 bp paired-end chemistry and NovaSeq 6000 SBS reagents.
Quantification and statistical analysis
Flow cytometry data analysis
Cell fluorescence was acquired on the 5-laser, 18-parameter BD FACSAria™ Fusion flow cytometer (BD Biosciences, San Jose, CA) using BD FACSDiva™ version 8.0.1 software, as previously described.20,22 Samples were analysed using FlowJo 10.8.0 (BD Biosciences). All cytokine frequencies are reported after background subtraction of identical gates applied on matched negative controls. Background subtractions were performed in Pestle version 1.8. Polyfunctionality of CD4+ cells expressing combinations of IFN-γ, IL-2, TNF-α was analysed with SPICE version 6.1 software.76
RNA-Seq data analysis
Quality of reads was checked by FastQC and fastp was used to trim adapters and remove low-quality sequences. Then, reads were aligned to the GRCh38 human reference genome using HISAT2 with default parameters. We obtained FPKM (fragments per kilobase of transcript per million fragments mapped) values of Ensembl (release 106) annotated genes across all the samples using Stringtie. We also performed Principal Component Analysis (PCA) for detection of outlier sample(s). Subsequently, differentially expressed genes (DEGs) were identified using linear model implemented in limma package of R with adjusted P-value < 0.05 (Benjamini-Hochberg method to control expected false discovery rate (FDR) and absolute fold change of 1.5. Identified DEGs were subjected to KEGG pathway over-representation analysis applying kegga function of limma.
Statistical analysis
Statistical analyses were performed in GraphPad Prism 9.2, unless otherwise stated. The statistical details of the experiments are provided in the respective figure legends. Mann-Whitney U or Wilcoxon signed-rank t tests were applied for unpaired or paired comparisons, respectively.
Additional resources
This study was approved Institutional Ethics Review Committee of St. John Medical College Hospital, Bangalore, IEC Ref no: (IEC/1/896/2018).
Acknowledgments
We thank the volunteers for participating in this study and acknowledge the contributions of clinical research workers at St John’s Research Institute. We thank the Indian Institute of Science (IISc), Bangalore, Central FACS facility for help with flow cytometry. We thank Dr. David Moyes, King’s College London, for the kind gift of heat-inactivated Candida albicans. This work was supported by funding from DBT-BIRAC (BT/COVID0073/02/20) to AV and funds for sample collection and processing from DBT (No.BT/PR30219/MED/15/189/2018) as part of a DBT-NIH award to AV.
Author contributions
The manuscript was read and approved by all authors. AV, SAJ, MGN, and THMO conceived the project. AA, AV, SAJ, and KEM designed the experiments. AA performed the immunology experiments and analyzed the data. SAJ and KEM performed the MGIA experiments and spectral flow analysis. HT performed RNA-seq data analysis and wrote methodology for RNA-seq data analysis. NCK, VA, SR, CP, and AA processed and archived samples. VA and SEJ helped with flow cytometer instrument set up, acquisition, and data analysis. GD and MD were clinical investigators. AA wrote the manuscript. AV, THMO, MGN, SAJ, and KEM edited the manuscript.
Declaration of interests
The authors declare no competing interests.
Published: September 9, 2023
Footnotes
Supplemental information can be found online at https://doi.org/10.1016/j.isci.2023.107889.
Supplemental information
Data and code availability
-
•
This paper does not report original code.
-
•
RNA-seq data have been deposited at NCBI database. and are publicly available as of the date of publication. The accession number is PRJNA950559 [https://www.ncbi.nlm.nih.gov/search/all/?term=PRJNA950559]
-
•
Any additional information required to reanalyse data reported in this paper is available from the lead contact upon request.
References
- 1.Ahmed A., Rakshit S., Adiga V., Dias M., Dwarkanath P., D’Souza G., Vyakarnam A. A century of BCG: Impact on tuberculosis control and beyond. Immunol. Rev. 2021;301:98–121. doi: 10.1111/imr.12968. [DOI] [PubMed] [Google Scholar]
- 2.Brook B., Harbeson D.J., Shannon C.P., Cai B., He D., Ben-Othman R., Francis F., Huang J., Varankovich N., Liu A., et al. BCG vaccination-induced emergency granulopoiesis provides rapid protection from neonatal sepsis. Sci. Transl. Med. 2020;12:eaax4517. doi: 10.1126/scitranslmed.aax4517. [DOI] [PMC free article] [PubMed] [Google Scholar]
- 3.Setia M.S., Steinmaus C., Ho C.S., Rutherford G.W. The role of BCG in prevention of leprosy: a meta-analysis. Lancet Infect. Dis. 2006;6:162–170. doi: 10.1016/S1473-3099(06)70412-1. [DOI] [PubMed] [Google Scholar]
- 4.Stensballe L.G., Nante E., Jensen I.P., Kofoed P.-E., Poulsen A., Jensen H., Newport M., Marchant A., Aaby P. Acute lower respiratory tract infections and respiratory syncytial virus in infants in Guinea-Bissau: a beneficial effect of BCG vaccination for girls community based case-control study. Vaccine. 2005;23:1251–1257. doi: 10.1016/j.vaccine.2004.09.006. [DOI] [PubMed] [Google Scholar]
- 5.Zimmermann P., Finn A., Curtis N. Does BCG Vaccination Protect Against Nontuberculous Mycobacterial Infection? A Systematic Review and Meta-Analysis. J. Infect. Dis. 2018;218:679–687. doi: 10.1093/infdis/jiy207. [DOI] [PubMed] [Google Scholar]
- 6.Ohrui T., Nakayama K., Fukushima T., Chiba H., Sasaki H. [Prevention of elderly pneumonia by pneumococcal, influenza and BCG vaccinations] Jpn. j. geriat. 2005;42:34–36. doi: 10.3143/geriatrics.42.34. [DOI] [PubMed] [Google Scholar]
- 7.Giamarellos-Bourboulis E.J., Tsilika M., Moorlag S., Antonakos N., Kotsaki A., Domínguez-Andrés J., Kyriazopoulou E., Gkavogianni T., Adami M.-E., Damoraki G., et al. Activate: randomized clinical trial of bcg vaccination against infection in the elderly. Cell. 2020;183:315–323.e9. doi: 10.1016/j.cell.2020.08.051. [DOI] [PMC free article] [PubMed] [Google Scholar]
- 8.Arts R.J.W., Moorlag S.J.C.F.M., Novakovic B., Li Y., Wang S.-Y., Oosting M., Kumar V., Xavier R.J., Wijmenga C., Joosten L.A.B., et al. BCG vaccination protects against experimental viral infection in humans through the induction of cytokines associated with trained immunity. Cell Host Microbe. 2018;23:89–100.e5. doi: 10.1016/j.chom.2017.12.010. [DOI] [PubMed] [Google Scholar]
- 9.Pfahlberg A., Kölmel K.F., Grange J.M., Mastrangelo G., Krone B., Botev I.N., Niin M., Seebacher C., Lambert D., Shafir R., et al. Inverse association between melanoma and previous vaccinations against tuberculosis and smallpox: results of the FEBIM study. J. Invest. Dermatol. 2002;119:570–575. doi: 10.1046/j.1523-1747.2002.00643.x. [DOI] [PubMed] [Google Scholar]
- 10.Lardone R.D., Chan A.A., Lee A.F., Foshag L.J., Faries M.B., Sieling P.A., Lee D.J. Mycobacterium bovis Bacillus Calmette-Guérin Alters melanoma microenvironment favoring antitumor T cell responses and improving M2 macrophage function. Front. Immunol. 2017;8:965. doi: 10.3389/fimmu.2017.00965. [DOI] [PMC free article] [PubMed] [Google Scholar]
- 11.Ristori G., Romano S., Cannoni S., Visconti A., Tinelli E., Mendozzi L., Cecconi P., Lanzillo R., Quarantelli M., Buttinelli C., et al. Effects of Bacille Calmette-Guerin after the first demyelinating event in the CNS. Neurology. 2014;82:41–48. doi: 10.1212/01.wnl.0000438216.93319.ab. [DOI] [PMC free article] [PubMed] [Google Scholar]
- 12.Faustman D.L. Benefits of BCG-induced metabolic switch from oxidative phosphorylation to aerobic glycolysis in autoimmune and nervous system diseases. J. Intern. Med. 2020;288:641–650. doi: 10.1111/joim.13050. [DOI] [PubMed] [Google Scholar]
- 13.Netea M.G., Domínguez-Andrés J., Barreiro L.B., Chavakis T., Divangahi M., Fuchs E., Joosten L.A.B., van der Meer J.W.M., Mhlanga M.M., Mulder W.J.M., et al. Defining trained immunity and its role in health and disease. Nat. Rev. Immunol. 2020;20:375–388. doi: 10.1038/s41577-020-0285-6. [DOI] [PMC free article] [PubMed] [Google Scholar]
- 14.Arts R.J.W., Netea M.G. Adaptive characteristics of innate immune responses in macrophages. Microbiol. Spectr. 2016;4 doi: 10.1128/microbiolspec.MCHD-0023-2015. [DOI] [PubMed] [Google Scholar]
- 15.Kleinnijenhuis J., Quintin J., Preijers F., Joosten L.A.B., Jacobs C., Xavier R.J., van der Meer J.W.M., van Crevel R., Netea M.G. BCG-induced trained immunity in NK cells: Role for non-specific protection to infection. Clin. Immunol. 2014;155:213–219. doi: 10.1016/j.clim.2014.10.005. [DOI] [PMC free article] [PubMed] [Google Scholar]
- 16.Arts R.J.W., Carvalho A., La Rocca C., Palma C., Rodrigues F., Silvestre R., Kleinnijenhuis J., Lachmandas E., Gonçalves L.G., Belinha A., et al. Immunometabolic pathways in BCG-induced trained immunity. Cell Rep. 2016;17:2562–2571. doi: 10.1016/j.celrep.2016.11.011. [DOI] [PMC free article] [PubMed] [Google Scholar]
- 17.Netea M.G., Quintin J., van der Meer J.W.M. Trained immunity: a memory for innate host defense. Cell Host Microbe. 2011;9:355–361. doi: 10.1016/j.chom.2011.04.006. [DOI] [PubMed] [Google Scholar]
- 18.Koeken V.a.C.M., Verrall A.J., Netea M.G., Hill P.C., van Crevel R. Trained innate immunity and resistance to Mycobacterium tuberculosis infection. Clin. Microbiol. Infect. 2019;25:1468–1472. doi: 10.1016/j.cmi.2019.02.015. [DOI] [PubMed] [Google Scholar]
- 19.Joosten S.A., van Meijgaarden K.E., Arend S.M., Prins C., Oftung F., Korsvold G.E., Kik S.V., Arts R.J., van Crevel R., Netea M.G., Ottenhoff T.H. Mycobacterial growth inhibition is associated with trained innate immunity. J. Clin. Invest. 2018;128:1837–1851. doi: 10.1172/JCI97508. [DOI] [PMC free article] [PubMed] [Google Scholar]
- 20.Rakshit S., Ahmed A., Adiga V., Sundararaj B.K., Sahoo P.N., Kenneth J., D’Souza G., Bonam W., Johnson C., Franken K.L., et al. BCG revaccination boosts adaptive polyfunctional Th1/Th17 and innate effectors in IGRA+ and IGRA- Indian adults. JCI Insight. 2019;4:e130540. doi: 10.1172/jci.insight.130540. [DOI] [PMC free article] [PubMed] [Google Scholar]
- 21.Suliman S., Geldenhuys H., Johnson J.L., Hughes J.E., Smit E., Murphy M., Toefy A., Lerumo L., Hopley C., Pienaar B., et al. Bacillus Calmette-Guérin (BCG) Revaccination of adults with latent Mycobacterium tuberculosis infection induces long-lived BCG-reactive NK cell responses. J. Immunol. 2016;197:1100–1110. doi: 10.4049/jimmunol.1501996. [DOI] [PMC free article] [PubMed] [Google Scholar]
- 22.Rakshit S., Adiga V., Ahmed A., Parthiban C., Chetan Kumar N., Dwarkanath P., Shivalingaiah S., Rao S., D’Souza G., Dias M., et al. Evidence for the heterologous benefits of prior BCG vaccination on COVISHIELD™ vaccine-induced immune responses in SARS-CoV-2 seronegative young Indian adults. Front. Immunol. 2022;13:985938. doi: 10.3389/fimmu.2022.985938. [DOI] [PMC free article] [PubMed] [Google Scholar]
- 23.India TB Report Ministry of Health and Family Welfare. Govt. of India. 2023 https://tbcindia.gov.in/showfile.php?lid=3680 [Google Scholar]
- 24.Maurya A.K., Nag V.L., Kant S., Kushwaha R.a.S., Kumar M., Singh A.K., Dhole T.N. Prevalence of nontuberculous mycobacteria among extrapulmonary tuberculosis cases in tertiary care centers in Northern India. BioMed Res. Int. 2015;2015:465403. doi: 10.1155/2015/465403. [DOI] [PMC free article] [PubMed] [Google Scholar]
- 25.Sharma S.K., Upadhyay V. Non-tuberculous mycobacteria: a disease beyond TB and preparedness in India. Expet Rev. Respir. Med. 2021;15:949–958. doi: 10.1080/17476348.2021.1925545. [DOI] [PubMed] [Google Scholar]
- 26.Wiker H.G., Harboe M. The antigen 85 complex: a major secretion product of Mycobacterium tuberculosis. Microbiol. Rev. 1992;56:648–661. doi: 10.1128/mr.56.4.648-661.1992. [DOI] [PMC free article] [PubMed] [Google Scholar]
- 27.Belisle J.T., Vissa V.D., Sievert T., Takayama K., Brennan P.J., Besra G.S. Role of the major antigen of Mycobacterium tuberculosis in cell wall biogenesis. Science. 1997;276:1420–1422. doi: 10.1126/science.276.5317.1420. [DOI] [PubMed] [Google Scholar]
- 28.Coppola M., van Meijgaarden K.E., Franken K.L.M.C., Commandeur S., Dolganov G., Kramnik I., Schoolnik G.K., Comas I., Lund O., Prins C., et al. New genome-wide algorithm identifies novel in-vivo expressed Mycobacterium tuberculosis antigens inducing human t-cell responses with classical and unconventional cytokine profiles. Sci. Rep. 2016;6:37793. doi: 10.1038/srep37793. [DOI] [PMC free article] [PubMed] [Google Scholar]
- 29.Lewis K.N., Liao R., Guinn K.M., Hickey M.J., Smith S., Behr M.A., Sherman D.R. Deletion of RD1 from Mycobacterium tuberculosis mimics bacille Calmette-Guérin attenuation. J. Infect. Dis. 2003;187:117–123. doi: 10.1086/345862. [DOI] [PMC free article] [PubMed] [Google Scholar]
- 30.Lewinsohn D.A., Lewinsohn D.M., Scriba T.J. Polyfunctional CD4+ T cells as targets for tuberculosis vaccination. Front. Immunol. 2017;8:1262. doi: 10.3389/fimmu.2017.01262. [DOI] [PMC free article] [PubMed] [Google Scholar]
- 31.Kleinnijenhuis J., Quintin J., Preijers F., Joosten L.A.B., Ifrim D.C., Saeed S., Jacobs C., van Loenhout J., de Jong D., Stunnenberg H.G., et al. Bacille Calmette-Guerin induces NOD2-dependent nonspecific protection from reinfection via epigenetic reprogramming of monocytes. Proc. Natl. Acad. Sci. USA. 2012;109:17537–17542. doi: 10.1073/pnas.1202870109. [DOI] [PMC free article] [PubMed] [Google Scholar]
- 32.Murphy D.M., Mills K.H.G., Basdeo S.A. The effects of trained innate immunity on T cell responses; clinical implications and knowledge gaps for future research. Front. Immunol. 2021;12:706583. doi: 10.3389/fimmu.2021.706583. [DOI] [PMC free article] [PubMed] [Google Scholar]
- 33.Jung B.-G., Wang X., Yi N., Ma J., Turner J., Samten B. Early secreted antigenic target of 6-kda of Mycobacterium tuberculosis stimulates IL-6 production by macrophages through activation of stat3. Sci. Rep. 2017;7:40984. doi: 10.1038/srep40984. [DOI] [PMC free article] [PubMed] [Google Scholar]
- 34.Refai A., Gritli S., Barbouche M.-R., Essafi M. Mycobacterium tuberculosis virulent factor ESAT-6 drives macrophage differentiation toward the pro-inflammatory M1 Phenotype and subsequently switches it to the anti-inflammatory M2 phenotype. Front. Cell. Infect. Microbiol. 2018;8:327. doi: 10.3389/fcimb.2018.00327. [DOI] [PMC free article] [PubMed] [Google Scholar]
- 35.Dinarello C.A. Anti-inflammatory agents: present and future. Cell. 2010;140:935–950. doi: 10.1016/j.cell.2010.02.043. [DOI] [PMC free article] [PubMed] [Google Scholar]
- 36.Saraiva M., Vieira P., O’Garra A. Biology and therapeutic potential of interleukin-10. J. Exp. Med. 2020;217:e20190418. doi: 10.1084/jem.20190418. [DOI] [PMC free article] [PubMed] [Google Scholar]
- 37.Pavan Kumar N., Padmapriyadarsini C., Rajamanickam A., Marinaik S.B., Nancy A., Padmanaban S., Akbar N., Murhekar M., Babu S. Effect of BCG vaccination on proinflammatory responses in elderly individuals. Sci. Adv. 2021;7:eabg7181. doi: 10.1126/sciadv.abg7181. [DOI] [PMC free article] [PubMed] [Google Scholar]
- 38.Koeken V.A., de Bree L.C.J., Mourits V.P., Moorlag S.J., Walk J., Cirovic B., Arts R.J., Jaeger M., Dijkstra H., Lemmers H., et al. BCG vaccination in humans inhibits systemic inflammation in a sex-dependent manner. J. Clin. Invest. 2020;130:5591–5602. doi: 10.1172/JCI133935. [DOI] [PMC free article] [PubMed] [Google Scholar]
- 39.Arend W.P. The balance between IL-1 and IL-1Ra in disease. Cytokine Growth Factor Rev. 2002;13:323–340. doi: 10.1016/s1359-6101(02)00020-5. [DOI] [PubMed] [Google Scholar]
- 40.Nemes E., Geldenhuys H., Rozot V., Rutkowski K.T., Ratangee F., Bilek N., Mabwe S., Makhethe L., Erasmus M., Toefy A., et al. C-040-404 Study Team, 2018. Prevention of M. tuberculosis Infection with H4:IC31 Vaccine or BCG Revaccination. N. Engl. J. Med. 2018;379:138–149. doi: 10.1056/NEJMoa1714021. [DOI] [PMC free article] [PubMed] [Google Scholar]
- 41.Martinez L., Cords O., Liu Q., Acuna-Villaorduna C., Bonnet M., Fox G.J., Carvalho A.C.C., Chan P.-C., Croda J., Hill P.C., et al. Infant BCG vaccination and risk of pulmonary and extrapulmonary tuberculosis throughout the life course: a systematic review and individual participant data meta-analysis. Lancet Global Health. 2022;10:e1307–e1316. doi: 10.1016/S2214-109X(22)00283-2. [DOI] [PMC free article] [PubMed] [Google Scholar]
- 42.Chadha V.K., Kumar P., Jagannatha P.S., Vaidyanathan P.S., Unnikrishnan K.P. Average annual risk of tuberculous infection in India. Int. J. Tubercul. Lung Dis. 2005;9:116–118. [PubMed] [Google Scholar]
- 43.Jain S., Sankar M.M., Sharma N., Singh S., Chugh T.D. High prevalence of non-tuberculous mycobacterial disease among non-HIV infected individuals in a TB endemic country--experience from a tertiary centre in Delhi, India. Pathog. Glob. Health. 2014;108:118–122. doi: 10.1179/2047773214Y.0000000133. [DOI] [PMC free article] [PubMed] [Google Scholar]
- 44.Whittaker E., Nicol M.P., Zar H.J., Tena-Coki N.G., Kampmann B. Age-related waning of immune responses to BCG in healthy children supports the need for a booster dose of BCG in TB endemic countries. Sci. Rep. 2018;8:15309. doi: 10.1038/s41598-018-33499-4. [DOI] [PMC free article] [PubMed] [Google Scholar]
- 45.Weir R.E., Gorak-Stolinska P., Floyd S., Lalor M.K., Stenson S., Branson K., Blitz R., Ben-Smith A., Fine P.E.M., Dockrell H.M. Persistence of the immune response induced by BCG vaccination. BMC Infect. Dis. 2008;8:9. doi: 10.1186/1471-2334-8-9. [DOI] [PMC free article] [PubMed] [Google Scholar]
- 46.Glynn J.R., Fielding K., Mzembe T., Sichali L., Banda L., McLean E., Kanjala C., Crampin A.C., Ponnighaus J.M., Warndorff D.K., et al. BCG re-vaccination in Malawi: 30-year follow-up of a large, randomised, double-blind, placebo-controlled trial. Lancet Global Health. 2021;9:e1451–e1459. doi: 10.1016/S2214-109X(21)00309-0. [DOI] [PMC free article] [PubMed] [Google Scholar]
- 47.Rodrigues L.C., Pereira S.M., Cunha S.S., Genser B., Ichihara M.Y., de Brito S.C., Hijjar M.A., Dourado I., Cruz A.A., Sant’Anna C., et al. Effect of BCG revaccination on incidence of tuberculosis in school-aged children in Brazil: the BCG-REVAC cluster-randomised trial. Lancet. 2005;366:1290–1295. doi: 10.1016/S0140-6736(05)67145-0. [DOI] [PubMed] [Google Scholar]
- 48.Verrall A.J., Schneider M., Alisjahbana B., Apriani L., van Laarhoven A., Koeken V.A.C.M., van Dorp S., Diadani E., Utama F., Hannaway R.F., et al. Early Clearance of Mycobacterium tuberculosis Is Associated With Increased Innate Immune Responses. J. Infect. Dis. 2020;221:1342–1350. doi: 10.1093/infdis/jiz147. [DOI] [PubMed] [Google Scholar]
- 49.van ’t Wout J.W., Poell R., van Furth R. The role of BCG/PPD-activated macrophages in resistance against systemic candidiasis in mice. Scand. J. Immunol. 1992;36:713–719. doi: 10.1111/j.1365-3083.1992.tb03132.x. [DOI] [PubMed] [Google Scholar]
- 50.Lv J., He X., Wang H., Wang Z., Kelly G.T., Wang X., Chen Y., Wang T., Qian Z. TLR4-NOX2 axis regulates the phagocytosis and killing of Mycobacterium tuberculosis by macrophages. BMC Pulm. Med. 2017;17:194. doi: 10.1186/s12890-017-0517-0. [DOI] [PMC free article] [PubMed] [Google Scholar]
- 51.Zimmermann P., Donath S., Perrett K.P., Messina N.L., Ritz N., Netea M.G., Flanagan K.L., van der Klis F.R.M., Curtis N., MIS BAIR group The influence of neonatal Bacille Calmette-Guérin (BCG) immunisation on heterologous vaccine responses in infants. Vaccine. 2019;37:3735–3744. doi: 10.1016/j.vaccine.2019.03.016. [DOI] [PubMed] [Google Scholar]
- 52.Leentjens J., Kox M., Stokman R., Gerretsen J., Diavatopoulos D.A., van Crevel R., Rimmelzwaan G.F., Pickkers P., Netea M.G. BCG vaccination enhances the immunogenicity of subsequent influenza vaccination in healthy volunteers: A randomized, placebo-controlled pilot study. J. Infect. Dis. 2015;212:1930–1938. doi: 10.1093/infdis/jiv332. [DOI] [PubMed] [Google Scholar]
- 53.Prabowo S.A., Smith S.G., Seifert K., Fletcher H.A. Impact of individual-level factors on Ex vivo mycobacterial growth inhibition: Associations of immune cell phenotype, cytomegalovirus-specific response and sex with immunity following BCG vaccination in humans. Tuberculosis. 2019;119:101876. doi: 10.1016/j.tube.2019.101876. [DOI] [PubMed] [Google Scholar]
- 54.Fletcher H.A., Tanner R., Wallis R.S., Meyer J., Manjaly Z.-R., Harris S., Satti I., Silver R.F., Hoft D., Kampmann B., et al. Inhibition of mycobacterial growth in vitro following primary but not secondary vaccination with Mycobacterium bovis BCG. Clin. Vaccine Immunol. 2013;20:1683–1689. doi: 10.1128/CVI.00427-13. [DOI] [PMC free article] [PubMed] [Google Scholar]
- 55.Leopold Wager C.M., Hole C.R., Campuzano A., Castro-Lopez N., Cai H., Caballero Van Dyke M.C., Wozniak K.L., Wang Y., Wormley F.L., Jr. IFN-γ immune priming of macrophages in vivo induces prolonged STAT1 binding and protection against Cryptococcus neoformans. PLoS Pathog. 2018;14:e1007358. doi: 10.1371/journal.ppat.1007358. [DOI] [PMC free article] [PubMed] [Google Scholar]
- 56.Yao Y., Jeyanathan M., Haddadi S., Barra N.G., Vaseghi-Shanjani M., Damjanovic D., Lai R., Afkhami S., Chen Y., Dvorkin-Gheva A., et al. Induction of Autonomous Memory Alveolar Macrophages Requires T Cell Help and Is Critical to Trained Immunity. Cell. 2018;175:1634–1650.e17. doi: 10.1016/j.cell.2018.09.042. [DOI] [PubMed] [Google Scholar]
- 57.Mantovani A., Dinarello C.A., Molgora M., Garlanda C. Interleukin-1 and Related Cytokines in the Regulation of Inflammation and Immunity. Immunity. 2019;50:778–795. doi: 10.1016/j.immuni.2019.03.012. [DOI] [PMC free article] [PubMed] [Google Scholar]
- 58.Dos Santos J.C., Barroso de Figueiredo A.M., Teodoro Silva M.V., Cirovic B., de Bree L.C.J., Damen M.S.M.A., Moorlag S.J.C.F.M., Gomes R.S., Helsen M.M., Oosting M., et al. β-Glucan-induced trained immunity protects against Leishmania braziliensis infection: a crucial role for IL-32. Cell Rep. 2019;28:2659–2672.e6. doi: 10.1016/j.celrep.2019.08.004. [DOI] [PubMed] [Google Scholar]
- 59.Ciarlo E., Heinonen T., Théroude C., Asgari F., Le Roy D., Netea M.G., Roger T. Trained immunity confers broad-spectrum protection against bacterial infections. J. Infect. Dis. 2020;222:1869–1881. doi: 10.1093/infdis/jiz692. [DOI] [PMC free article] [PubMed] [Google Scholar]
- 60.Moorlag S.J.C.F.M., Khan N., Novakovic B., Kaufmann E., Jansen T., van Crevel R., Divangahi M., Netea M.G. β-Glucan induces protective trained immunity against Mycobacterium tuberculosis infection: A key role for il-1. Cell Rep. 2020;31:107634. doi: 10.1016/j.celrep.2020.107634. [DOI] [PMC free article] [PubMed] [Google Scholar]
- 61.Christ A., Günther P., Lauterbach M.A.R., Duewell P., Biswas D., Pelka K., Scholz C.J., Oosting M., Haendler K., Baßler K., et al. Western diet triggers nlrp3-dependent innate immune reprogramming. Cell. 2018;172:162–175.e14. doi: 10.1016/j.cell.2017.12.013. [DOI] [PMC free article] [PubMed] [Google Scholar]
- 62.Ottaviani S., Moltó A., Ea H.-K., Neveu S., Gill G., Brunier L., Palazzo E., Meyer O., Richette P., Bardin T., et al. Efficacy of anakinra in gouty arthritis: a retrospective study of 40 cases. Arthritis Res. Ther. 2013;15:R123. doi: 10.1186/ar4303. [DOI] [PMC free article] [PubMed] [Google Scholar]
- 63.Li H., Bradbury J.A., Dackor R.T., Edin M.L., Graves J.P., DeGraff L.M., Wang P.M., Bortner C.D., Maruoka S., Lih F.B., et al. Cyclooxygenase-2 regulates Th17 cell differentiation during allergic lung inflammation. Am. J. Respir. Crit. Care Med. 2011;184:37–49. doi: 10.1164/rccm.201010-1637OC. [DOI] [PMC free article] [PubMed] [Google Scholar]
- 64.Okamoto K., Iwai Y., Oh-Hora M., Yamamoto M., Morio T., Aoki K., Ohya K., Jetten A.M., Akira S., Muta T., Takayanagi H. IkappaBzeta regulates T(H)17 development by cooperating with ROR nuclear receptors. Nature. 2010;464:1381–1385. doi: 10.1038/nature08922. [DOI] [PubMed] [Google Scholar]
- 65.Wajant H., Siegmund D. TNFR1 and TNFR2 in the Control of the Life and Death Balance of Macrophages. Front. Cell Dev. Biol. 2019;7:91. doi: 10.3389/fcell.2019.00091. [DOI] [PMC free article] [PubMed] [Google Scholar]
- 66.Dagenais M., Dupaul-Chicoine J., Champagne C., Skeldon A., Morizot A., Saleh M. A critical role for cellular inhibitor of protein 2 (cIAP2) in colitis-associated colorectal cancer and intestinal homeostasis mediated by the inflammasome and survival pathways. Mucosal Immunol. 2016;9:146–158. doi: 10.1038/mi.2015.46. [DOI] [PubMed] [Google Scholar]
- 67.Bertrand M.J.M., Doiron K., Labbé K., Korneluk R.G., Barker P.A., Saleh M. Cellular inhibitors of apoptosis cIAP1 and cIAP2 are required for innate immunity signalling by the pattern recognition receptors NOD1 and NOD2. Immunity. 2009;30:789–801. doi: 10.1016/j.immuni.2009.04.011. [DOI] [PubMed] [Google Scholar]
- 68.Lin C.-C., Bradstreet T.R., Schwarzkopf E.A., Sim J., Carrero J.A., Chou C., Cook L.E., Egawa T., Taneja R., Murphy T.L., et al. Bhlhe40 controls cytokine production by T cells and is essential for pathogenicity in autoimmune neuroinflammation. Nat. Commun. 2014;5:3551. doi: 10.1038/ncomms4551. [DOI] [PMC free article] [PubMed] [Google Scholar]
- 69.Li Y., Jin J., Wang Y. SIRT6 Widely Regulates Aging, Immunity, and Cancer. Front. Oncol. 2022;12:861334. doi: 10.3389/fonc.2022.861334. [DOI] [PMC free article] [PubMed] [Google Scholar]
- 70.Isgrò M., Bianchetti L., Marini M.A., Bellini A., Schmidt M., Mattoli S. The C-C motif chemokine ligands CCL5, CCL11, and CCL24 induce the migration of circulating fibrocytes from patients with severe asthma. Mucosal Immunol. 2013;6:718–727. doi: 10.1038/mi.2012.109. [DOI] [PubMed] [Google Scholar]
- 71.Metzemaekers M., Vanheule V., Janssens R., Struyf S., Proost P. Overview of the mechanisms that may contribute to the non-redundant activities of interferon-inducible CXC chemokine receptor 3 ligands. Front. Immunol. 2017;8:1970. doi: 10.3389/fimmu.2017.01970. [DOI] [PMC free article] [PubMed] [Google Scholar]
- 72.Ahmed A., Adiga V., Nayak S., Uday Kumar J.A.J., Dhar C., Sahoo P.N., Sundararaj B.K., Souza G.D., Vyakarnam A. Circulating HLA-DR+CD4+ effector memory T cells resistant to CCR5 and PD-L1 mediated suppression compromise regulatory T cell function in tuberculosis. PLoS Pathog. 2018;14:e1007289. doi: 10.1371/journal.ppat.1007289. [DOI] [PMC free article] [PubMed] [Google Scholar]
- 73.Jakoš T., Pišlar A., Jewett A., Kos J. Cysteine cathepsins in tumor-associated immune cells. Front. Immunol. 2019;10:2037. doi: 10.3389/fimmu.2019.02037. [DOI] [PMC free article] [PubMed] [Google Scholar]
- 74.Ray N., Kuwahara M., Takada Y., Maruyama K., Kawaguchi T., Tsubone H., Ishikawa H., Matsuo K. c-Fos suppresses systemic inflammatory response to endotoxin. Int. Immunol. 2006;18:671–677. doi: 10.1093/intimm/dxl004. [DOI] [PubMed] [Google Scholar]
- 75.Pagliaro P., Penna C. ACE/ACE2 Ratio: A Key Also in 2019 Coronavirus Disease (Covid-19)? Front. Med. 2020;7:335. doi: 10.3389/fmed.2020.00335. [DOI] [PMC free article] [PubMed] [Google Scholar]
- 76.Roederer M., Nozzi J.L., Nason M.C. SPICE: exploration and analysis of post-cytometric complex multivariate datasets. Cytometry A. 2011;79:167–174. doi: 10.1002/cyto.a.21015. [DOI] [PMC free article] [PubMed] [Google Scholar]
- 77.Chen S., Zhou Y., Chen Y., Gu J. fastp: an ultra-fast all-in-one FASTQ preprocessor. Bioinformatics. 2018;34:884–i890. doi: 10.1093/bioinformatics/bty560. [DOI] [PMC free article] [PubMed] [Google Scholar]
- 78.Kim D., Paggi J.M., Park C., Bennett C., Salzberg S.L. Graph-based genome alignment and genotyping with HISAT2 and HISAT-genotype. Nat. Biotechnol. 2019;37:907–915. doi: 10.1038/s41587-019-0201-4. [DOI] [PMC free article] [PubMed] [Google Scholar]
- 79.Pertea M., Pertea G.M., Antonescu C.M., Chang T.C., Mendell J.T., Salzberg S.L. StringTie enables improved reconstruction of a transcriptome from RNA-seq reads. Nat. Biotechnol. 2015;33:290–295. doi: 10.1038/nbt.3122. [DOI] [PMC free article] [PubMed] [Google Scholar]
- 80.Ritchie M.E., Phipson B., Wu D., Hu Y., Law C.W., Shi W., Smyth G.K. limma powers differential expression analyses for RNA-sequencing and microarray studies. Nucleic Acids Res. 2015;43:e47. doi: 10.1093/nar/gkv007. [DOI] [PMC free article] [PubMed] [Google Scholar]
- 81.van Wolfswinkel M., van Meijgaarden K.E., Ottenhoff T.H.M., Niewold P., Joosten S.A. Extensive flow cytometric immunophenotyping of human PBMC incorporating detection of chemokine receptors, cytokines and tetramers. Cytometry A. 2023;103:600–610. doi: 10.1002/cyto.a.24727. [DOI] [PubMed] [Google Scholar]
Associated Data
This section collects any data citations, data availability statements, or supplementary materials included in this article.
Supplementary Materials
Data Availability Statement
-
•
This paper does not report original code.
-
•
RNA-seq data have been deposited at NCBI database. and are publicly available as of the date of publication. The accession number is PRJNA950559 [https://www.ncbi.nlm.nih.gov/search/all/?term=PRJNA950559]
-
•
Any additional information required to reanalyse data reported in this paper is available from the lead contact upon request.