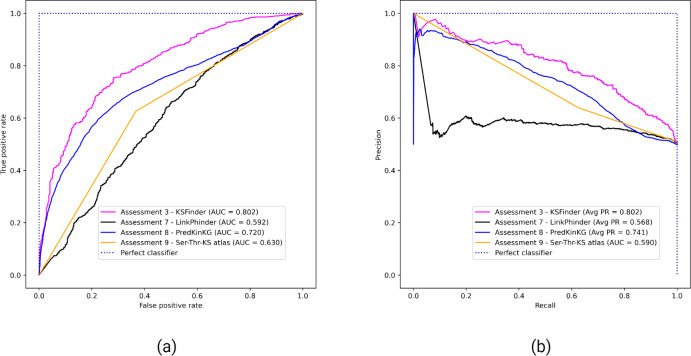
Figure 4. Performance of KSFinder, LinkPhinder, PredKinKG, and Ser-Thr-KS atlas on KSFinder dataset.
Each curve indicates the performance of the four models in terms of (A) ROC-AUC and (B) PR-AUC on the KSFinder dataset at different thresholds from 0 through 1. The label denotes the assessment number, the model, and the corresponding curve.

