

Abstract
Background:
Cardiac conduction is understood to occur through gap junctions. Recent evidence supports ephaptic coupling as another mechanism of electrical communication in heart. Conduction via gap junctions predicts a direct relationship between conduction velocity (CV) and bulk extracellular resistance. By contrast, ephaptic theory is premised on the existence of a biphasic relationship between CV and the volume of specialized extracellular clefts within intercalated discs such as the perinexus. Our objective was to determine the relationship between ventricular CV and structural changes to micro- and nano-scale extracellular spaces.
Methods:
Conduction and connexin43 (Cx43) protein expression were quantified from optically mapped guinea pig whole-heart preparations perfused with the osmotic agents albumin, mannitol, dextran 70kDa, or dextran 2MDa. Peak sodium current was quantified in isolated guinea pig ventricular myocytes. Extracellular resistance was quantified by impedance spectroscopy. Intercellular communication was assessed in a heterologous expression system with fluorescence recovery after photobleaching. Perinexal width was quantified from transmission electron micrographs.
Results:
CV primarily in the transverse direction of propagation was significantly reduced by mannitol, and increased by albumin and both dextrans. The combination of albumin and dextran 70kDa decreased CV relative to albumin alone. Extracellular resistance was reduced by mannitol, unchanged by albumin, and increased by both dextrans. Cx43 expression and conductance, and peak sodium currents were not significantly altered by the osmotic agents. In response to osmotic agents, perinexal width, in order of narrowest to widest, was: albumin with dextran 70kDa, albumin or dextran 2MDa, dextran 70kDa or no osmotic agent, and mannitol. When compared in the same order, CV was biphasically related to perinexal width.
Conclusions:
Cardiac conduction does not correlate with extracellular resistance, but is biphasically related to perinexal separation, providing evidence that the relationship between CV and extracellular volume is determined by ephaptic mechanisms under conditions of normal gap junctional coupling.
Keywords: Arrhythmias, Electrophysiology, Mechanisms, Basic Science Research, Perinexus, Intercalated Disc, Cardiac Conduction, Ephaptic Coupling
Graphical Abstract

INTRODUCTION
Understanding cardiac conduction is critical to the diagnosis, treatment, and prevention of arrhythmogenic diseases of the heart. Cardiac conduction is traditionally understood to follow a cable-like model of electrical conduction.1–4 In this paradigm, electrical current is envisaged as flowing into myocytes, through gap junction (GJ) channels at the intercalated discs (ID), back across cell membranes through outward potassium channels, and returning via the extracellular space. Importantly, experimental evidence has provided support for this long-established theoretical conception by demonstrating decreasing extracellular resistance can increase conduction velocity (CV).2,5,6
Since electrical propagation occurs in the hearts of lower vertebrate animals in which GJs are scarce,7–9 and persists in mammalian hearts with the principal GJ protein connexin43 (Cx43) knocked out,10 computational models of conduction were revised to propose an additional method of electrical intercellular communication.11–16 In these models of ephaptic coupling (EpC: non-GJ, non-synaptic coupling), strongly depolarizing inward currents facing a 10–30 nm cleft separating adjacent cardiomoycytes significantly decrease the extracellular potential to depolarize nearby membranes. In the case of dense sodium channel localization to the ID between cardiomyocytes, and more specifically in the GJ adjacent perinexus,17 sodium channels self-activate in a positive feedback process that rapidly decreases the extracellular potential and activates more sodium channels18 while simultaneously increasing intracellular potentials. Importantly, the rapid decrease of extracellular potentials, increase in intracellular potentials, and depletion of extracellular sodium in the cleft13,19 decrease the driving force during intercellular propagation in a process known as self-attenuation.12 All computational models with EpC reveal that starting from a very narrow cleft, widening clefts between cardiomyocytes will first increase CV by reducing self-attenuation and then decrease CV by reducing self-activation. Importantly, the relationship between CV and cleft width is biphasic when GJ conductance is closer to experimentally measured values of gap junctional coupling (GJC).20–27
In order for conduction to occur, current must return to depolarizing myocytes through the bulk extracellular space, and cardiac CV should be directly proportional to extracellular volume if conduction were only dependent on cable-like propagation through GJs without EpC. However, we previously demonstrated that cardiac CV can be inversely correlated to extracellular volume.28 Subsequent studies revealed that the osmotic agent mannitol, which increases bulk extracellular volume, also increases perinexal volume and reduces CV.29 Since we found that ventricular conduction slowed with perinexal expansion,30,31 we concluded that EpC is a significant determinant of CV. However, the relative contributions of cable-like propagation through bulk interstitial volume and ephaptic-like conduction through perinexal domains remain unresolved. The purpose of this study was to determine the relationship between ventricular CV and structural changes to bulk extracellular volume and perinexal nanodomains. Results demonstrate osmotic agents alter CV primarily via an ephaptic mechanism.
METHODS
Data Availability
Data supporting the findings of this study are available from the corresponding author upon reasonable request. An expanded Materials and Methods section can be found in the Data Supplement.
RESULTS
Whole-Heart Electrophysiology
We quantified ventricular conduction velocity (CV) by optical mapping during perfusion with our historical lab standard solution31 (baseline) and after 15 minutes perfusion with the addition of one of the osmotic agents. In Figure 1A, representative optical maps demonstrate how CV is affected by time and osmotic agents. After 15 minutes, CV may modestly increase in time control optical maps, is decreased with mannitol (as evidenced by crowding of isochrones), is increased by albumin (as evidenced by enhanced isochrone spacing), is modestly increased by dextran 70kDa, and increased by dextran 2MDa. Summary data in Figure 1B demonstrate the effect of the osmotic agents relative to baseline measures in the same heart, as well as a comparison of the paired change in conduction to time controls. In short, CV in the transverse direction (CVT) was not significantly different after 15 minutes of time control perfusion (Diff: 1.1 cm/sec, 95%CI: ±1.3). Mannitol significantly decreased CVT relative to baseline measurements (Diff: −2.7 cm/s, 95%CI: ±1.8), and the change in CVT was significantly lower (Diff: −3.7 cm/s, 95%CI: ±3.0) than the change in CVT observed in the 15-minute time control measurement. Albumin, on the other hand, significantly increased CVT (Diff: 7.2 cm/s, 95%CI: ± 2.4) relative to baseline, and the change was significantly greater (Diff: 6.1 cm/s, 95%CI: ± 2.8) than the change found for the time control. Interestingly, both dextran 70kDa and dextran 2MDa increased CVT in paired comparison (Diff: 1.0 cm/sec, 95%CI: ±0.9 and Diff: 2.7 cm/sec, 95%CI: ±1.6), but the change in CVT was not significantly different (Diff: −0.1 cm/s, 95%CI: ±3.0 and Diff: 1.7 cm/sec, 95%CI: ±3.0) from the time control. CV in the longitudinal direction (CVL) significantly increased after 15 minutes of time control perfusion (Diff: 4.1 cm/sec, 95%CI: ±3.9). Mannitol did not significantly change CVL (Diff: −2.1 cm/sec, 95%CI: ±3.5). Albumin (Diff: 8.7 cm/sec, 95%CI: ±4.1) and dextran 70kDa (Diff: 4.5 cm/sec, 95%CI: ±4.4) significantly increased CVL. Dextran 2MDa did not significantly change CVL (Diff: 1.9 cm/sec, 95%CI: ±2.9). However, none of the magnitudes of change in CVL were significantly different from time control. In general, CV changes induced by the osmotic agents in this study measurably changed transverse conduction. In summary, mannitol decreased, while albumin and both dextrans increased epicardial conduction measured by optical mapping relative to their paired pre-treatment baseline.
Figure 1. Osmotic agents modulate transverse conduction velocity (CV).
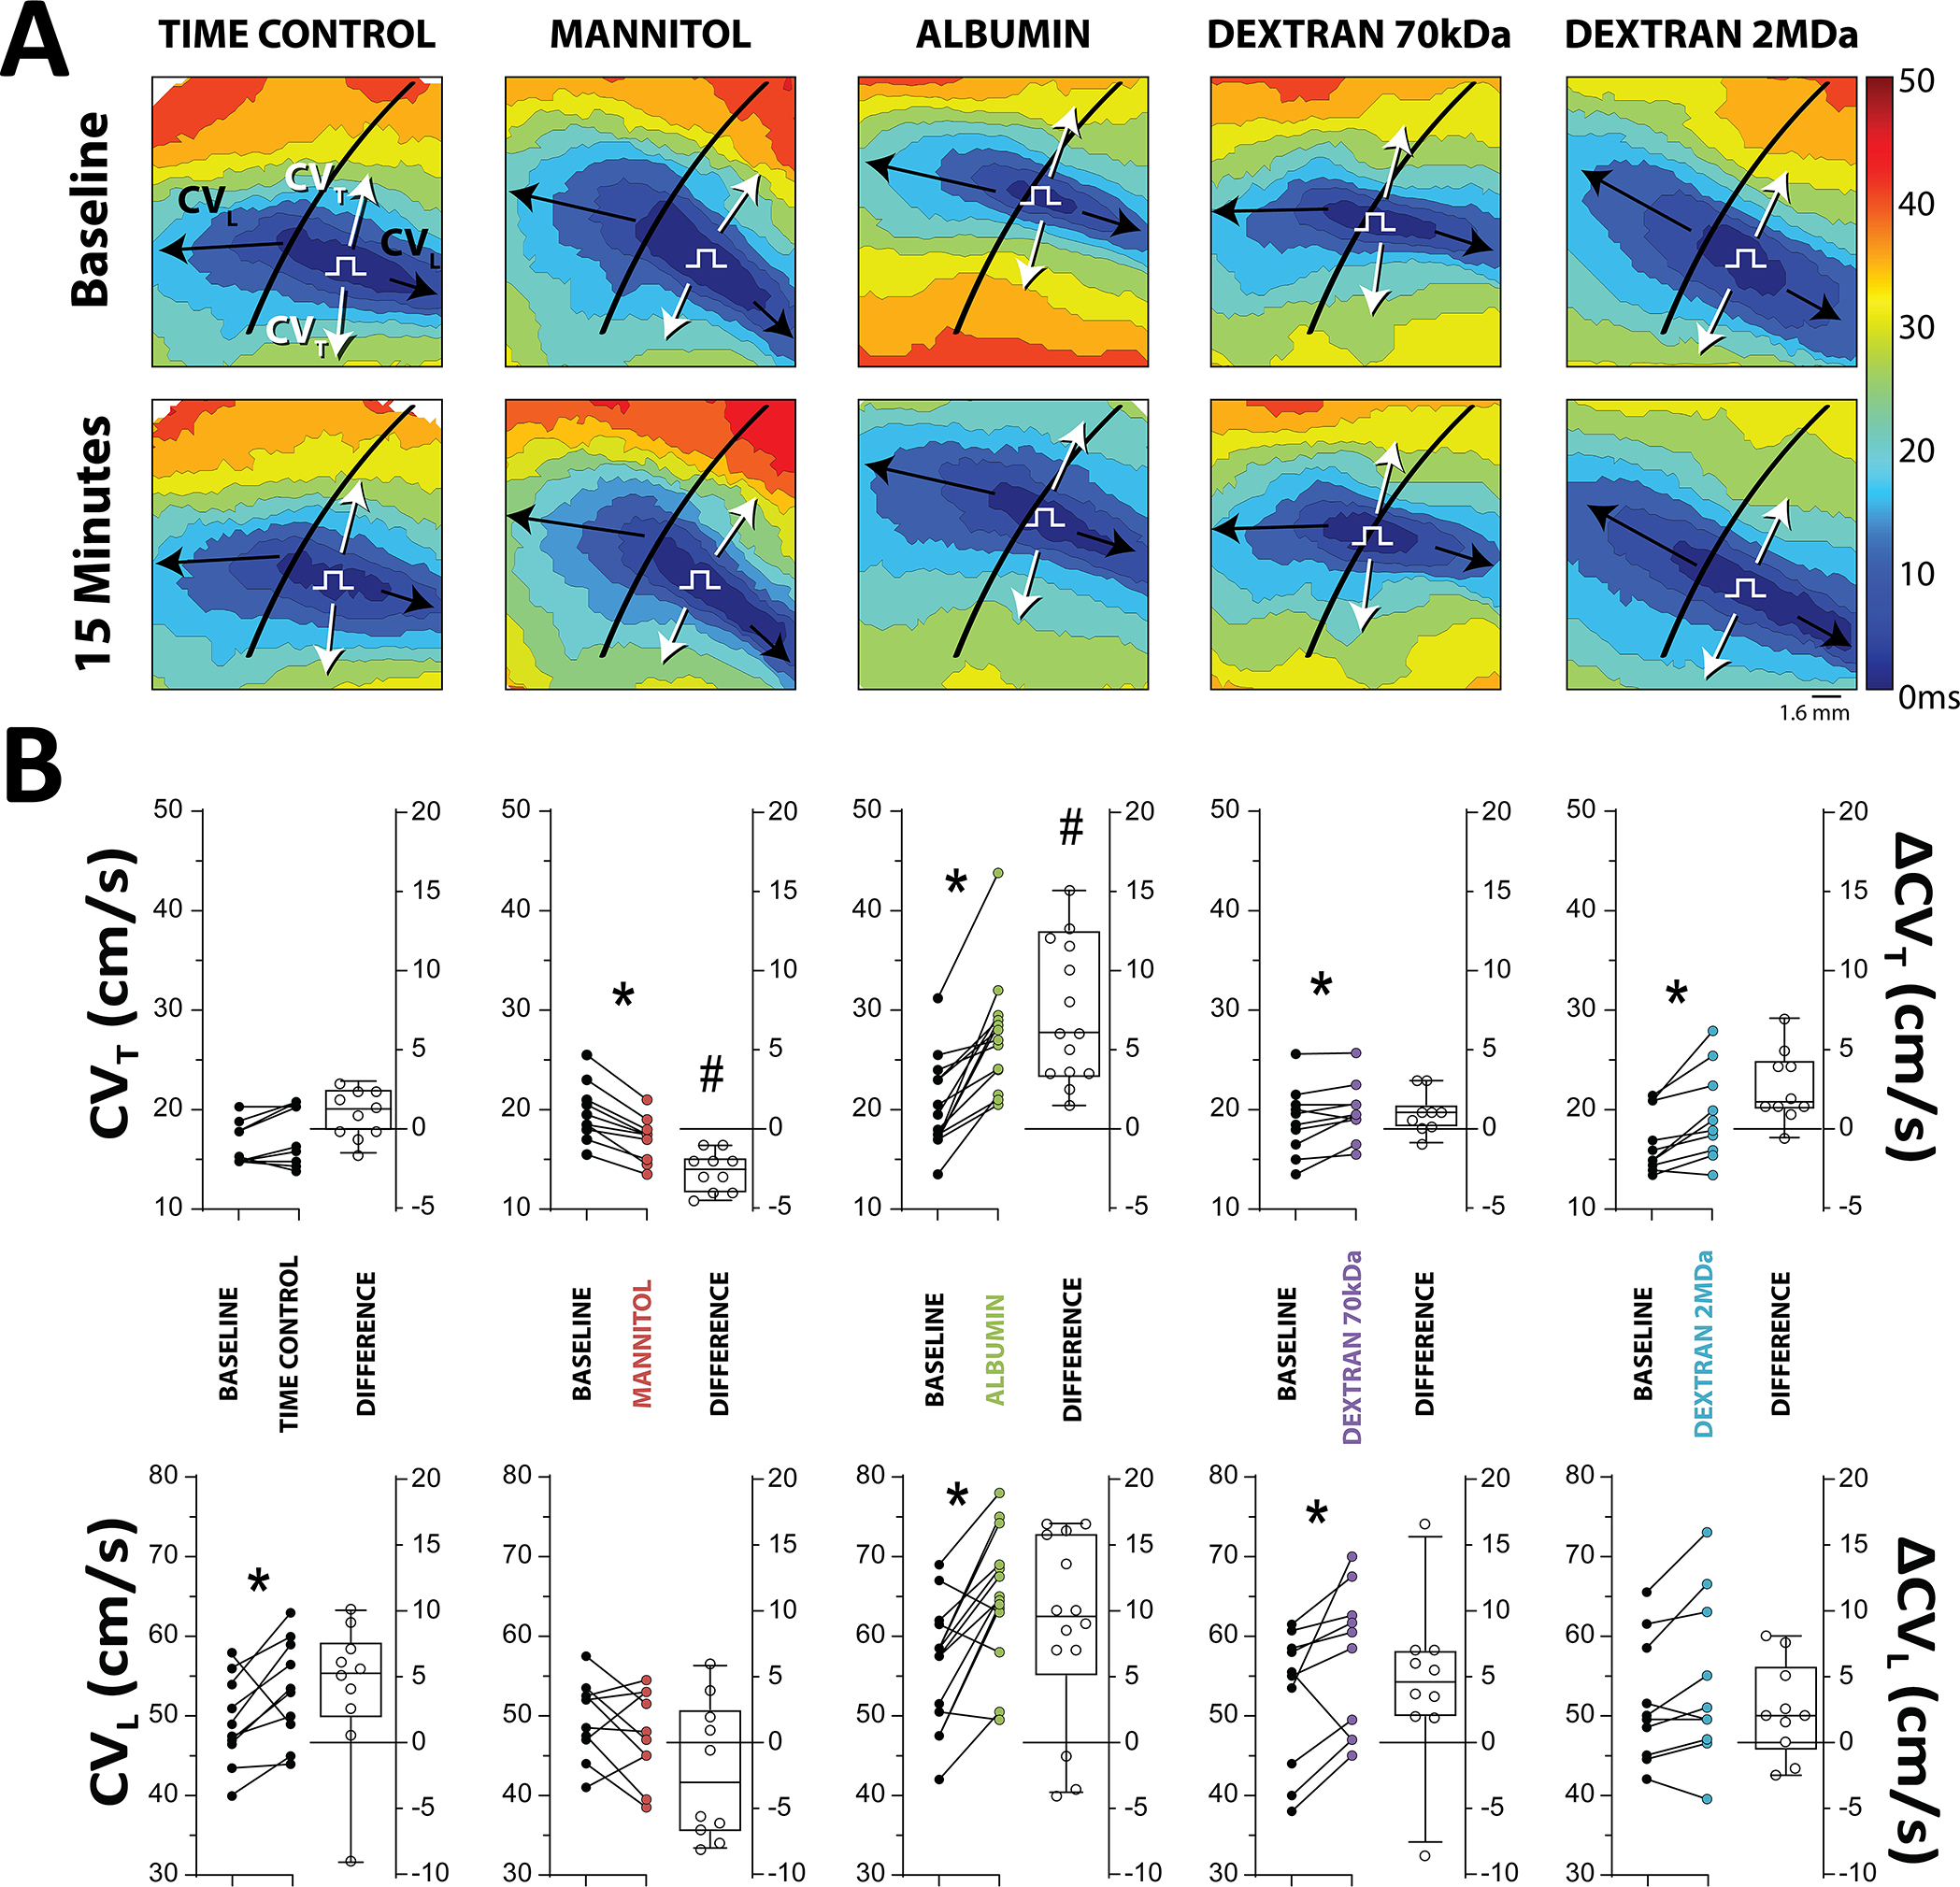
A. Representative 3 ms activation time isochrones demonstrate the effect of various osmotic agents on the spread of activation. A detailed explanation can be found in the methods supplement B. CV plotted as individual points (left axis) and the change in CV (right axis) from paired baseline experiments demonstrates mannitol (N=10) significantly decreases, albumin (N=14) significantly increases, dextran 70kDa (N=10) increases, and dextran 2MDa (N=10) increases CV preferentially in the transverse direction *p<0.05 relative to paired baseline measurement, paired Student’s t-test. #p<0.05 relative to time control, ΔCV across groups compared with ordinary one-way ANOVA applying Dunnett’s correction.
Neither APD90 nor maximum APD dispersion were significantly different from baseline in any treatment group (Figure S4).
Cx43 and Gap Junctions
In order to determine possible effects of osmotic agents on gap junctional coupling (GJC), levels of the principal ventricular gap junction (GJ) protein connexin43 (Cx43) were quantified by western blotting. Total Cx43 expression was not expected to change in response to 15 minute exposure to the osmotic agents, and so Cx43 phosphorylated at serine 368 (pCx43-S368) was also quantified since it has been associated with changes in GJ conductivity.50–52 Across all conditions, neither total nor pCx43-S368 (Figure 2A,B) significantly changed in response to osmotic agent perfusion. Relative to time control tissue, total Cx43 was not significantly different in tissue perfused with mannitol (Diff: 0.1 AU, 95%CI: ±0.4), albumin (Diff: 0.3 AU, 95%CI: ±0.4), dextran 70kDa (Diff: −0.2 AU, 95%CI: ±0.4), nor dextran 2MDa (Diff: −0.02 AU, 95%CI: ±0.5). With respect to time control, pCx43-S368 was also not significantly different in tissue perfused with mannitol (Diff: 0.1 AU, 95%CI: ±0.6), albumin (Diff: −0.2 AU, 95%CI: ±0.6), dextran 70kDa (Diff: −0.1, 95%CI: ±0.6), or dextran 2MDa (Diff: −0.1 AU, 95%CI: ±0.5).
Figure 2. Osmotic agents do not significantly alter Cx43 protein expression or function.
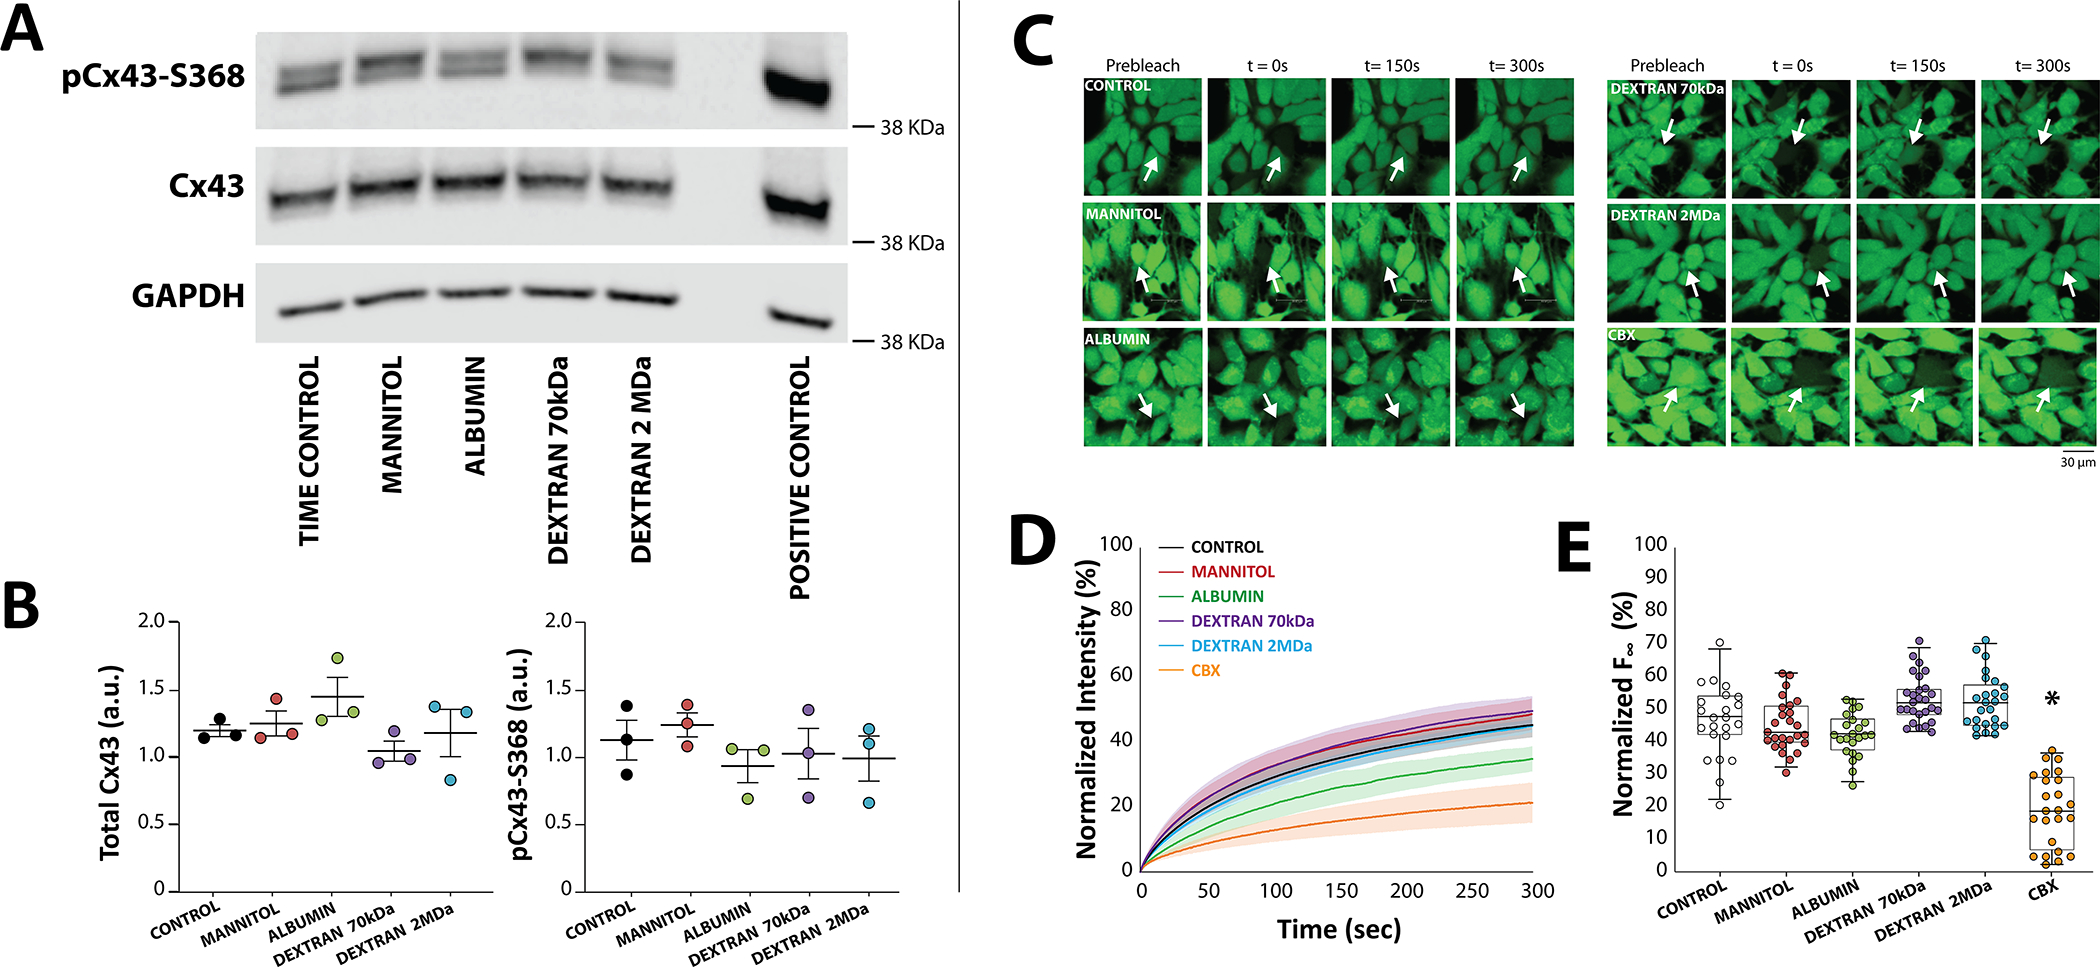
A. Representative western blots suggest that neither total connexin43 (Cx43) nor Cx43 phosphorylated at serine-368 (pCx43-S368) significantly change in response to acute exposure to osmotic agents. Lane 7 contains a positive control using hearts exposed to 60 min of room temperature ischemia, a condition shown to upregulate pCx43-S368.91 B. Summary data do not reveal significant differences in either total or pCx43-S368 for all conditions (N=3 hearts per condition. p=n.s. via ordinary one-way ANOVA applying Dunnett’s correction. Center is the mean and whiskers are standard deviation). C. Representative fluorescent images of calcein-AM fluorescence in Control cultures (N=13 plates, n=220 cells) and cultures exposed to Mannitol (N=7 plates, n=116 cells), Albumin (N=4 plates, n=77 cells), Dextran 70kDa (N=4 plates, n=102 cells), Dextran 2MDa (N=4 plates, n=95 cells), and Carbenoxolone (CBX, N=6 plates, n=110 cells). D. Fluorescence recovery after photobleaching (FRAP) plot of bleached cells during 300s post-bleaching. Solid lines denotes the average and shaded areas the standard error of the mean. E. Only CBX significantly decreased FRAP relative to control. *p<0.05, nested ANOVA applying Dunnett’s correction with culture plate nested under treatment type.
Since protein expression does not always correlate with function, functional GJC was also assessed by Fluorescence Recovery After Photobleaching (FRAP) in heterologous cells stably expressing Cx43 using an approach that we have reported previously.43,44,53 Representative fluorescent images taken before photobleaching (prebleach, Figure 2C), immediately after bleaching (t=0s), and at 150 and 300s post-bleaching, demonstrate fluorescence recovers to approximately the same extent as control cells. Specifically, FRAP, as can be seen in summary data plotted in Figures 2D and E, was not significantly different for cells incubated with mannitol (Diff: 1.0%, 95%CI: ±16.2), albumin (Diff: −4.2%, 95%CI: ±20.9), dextran 70kDa (Diff: 3.8%, 95%CI: ±20.7), or dextran 2MDa (Diff: 3.6%, 95%CI: ±20.8). As a positive control, the GJ uncoupler carbenoxolone (CBX, 10 μM) decreased FRAP as expected (Diff: −23.8%, 95%CI: ±5.9). Despite a visual drop in FRAP measured in cells treated with albumin, summary data in Figure 2E reveal that only CBX significantly decreased GJC estimated by FRAP. Even if 1-hour perfusion with albumin modestly decreased GJC, that finding would be inconsistent with the observed increased CV in hearts perfused with albumin. In summary, we did not measure a change in Cx43 level or function in response to the osmotic agents employed in this study at the concentrations or incubation times noted.
Peak Sodium Current
Next, we sought to determine whether the osmotic agents affected the sodium current, which is another important determinant of cardiac conduction. Representative current traces from a single cell, the average of average current-voltage measurements from multiple cells in each heart, and summary peak current for all cells and hearts are plotted in Figure 3A–D. In summary, the osmotic agents did not significantly change peak sodium currents relative to control replicates obtained from the same hearts. Specifically, the peak sodium current relative to control was not significantly different in cells treated with mannitol (Diff: 4.1 pA/pF, 95%CI: ±11.0), albumin (Diff: −1.1 pA/pF, 95%CI: ±13.9), dextran 70kDa (Diff: −2.6 pA/pF, 95%CI: ±14.1), or dextran 2MDa (Diff: −0.7 pA/pF, 95%CI: ±14.0).
Figure 3. Osmotic agents do not significantly alter peak sodium current.

Representative currents from a single cell, current-voltage curves averaged from a single heart, and peak current at −20 mV step potential for all hearts and cells reveal none of the test agents significantly decrease sodium currents relative to Control A. Mannitol (N=5 hearts, n=34 cells, red) B. Albumin (N=3 hearts, n=25 cells, green) C. Dextran 70kDa (N=3 heart, n=21 cells, purple) D. Dextran 2MDa (N=3 hearts, n=24 cells, blue) All treatment groups were compared to same day measurements from control group cells using a nested ANOVA applying Šidák’s correction, where the heart is the nested variable.
Bulk Interstitium
To test whether the volume of bulk interstitial space (VIS) correlated with changes in CV, the percentage of tissue unoccupied by cardiac cells was quantified with a positive-pixel analysis of hematoxylin and eosin (H&E)-stained tissue. Histological quantification did not reveal significant differences between tissues subjected to 15 minutes of perfusion with any osmotic agent (Figure 4). Relative to control, VIS was not significantly changed by perfusion with mannitol (Diff: 1.6%, 95%CI: ±11.4), albumin (Diff: 3.0%, 95%CI: ±11.9), dextran 70kDa (Diff: −6.1%, 95%CI: ±11.1), or dextran 2MDa (Diff: −1.0%, 95%CI: ±12.4). This was unexpected since our previous results from ventricular tissue analyzed from glutaraldehyde fixation and snap frozen samples demonstrated albumin decreases bulk extracellular volume and mannitol increases it.28
Figure 4. Osmotic agents do not significantly change interstitial space analyzed from hemotoxalin and eosin (H&E) stained ventricular tissue.

A. Representative images of H&E-stained tissue B. Volume of bulk interstitial space (VIS) as quantified by a positive-pixel algorithm for Control (N=8 hearts, n=84 images), Mannitol (N=8 hearts, n=73 images), Albumin (N=7 hearts, n=71 images), Dextran 70kDa (N=9 hearts, n=91 images), Dextran 2MDa (N=6, n=62 images). p=n.s. nested one-way ANOVA applying Šidák’s correction, with heart nested under treatment type.
We therefore sought to quantify tissue impedance at baseline and after 20 minutes of treatment with the osmotic agents using a 4-electrode technique as previously described.46,47,54 Extracellular tissue resistance (Re) was measured in each heart without interventions (time control) and after serial perfusion with the osmotic agents. This permitted a pair-wise comparison to reduce errors associated with different depths of electrode penetration and orientation of electrodes relative to myocardial ultrastructure and transmural rotational anisotropy. The specific values of Re are less important than whether the osmotic agent changed Re and if Re increased or decreased. Summary data in Figure 5A reveal that Re did not significantly change over 20 minutes relative to baseline for time control measurements (Diff: 13.6 Ω, 95%CI: ±89.7), mannitol significantly reduced Re (Diff: −4.9 Ω, 95%CI: ±5.0), albumin did not change Re (Diff: 14.3 Ω, 95%CI: ±85.7), dextran 70kDa significantly increased Re (Diff: 20.6 Ω, 95%CI: ±10.9), and dextran 2MDa significantly increased Re (Diff: 70.3 Ω, 95%CI: ±68.4). Importantly, CV changes observed above do not correlate with Re.
Figure 5. Osmotic agents modulate extracellular resistance.

A. Neither extracellular resistance (Re), nor the constant-phase element (CPE) parameter η varied during Time Control (N=4). B. Mannitol decreased Re but did not change η (N=7). C. Albumin did not affect either Re or η (N=4). D. However, Dextran 70kDa significantly increased Re but not η (N=4). E. Similarly, Dextran 2MDa increased Re but not η (N=4). *p<0.05, paired 2-tailed Student’s t-test, relative to baseline.
Intercellular parameters, including cell membrane capacitance, cytosolic resistance and GJ resistance were modeled as a constant phase element (CPE). The distributivity of the time constant of the CPE element, the parameter η, did not significantly change relative to paired baseline measurements: time control (Diff: 0.05 AU, 95%CI: ±0.9), mannitol (Diff: 0.11AU, 95%CI: ±0.10), albumin (Diff: 0.00 AU, 95%CI: ±0.23), dextran 70kDa (Diff: −0.03AU, 95%CI: ±0.16), and dextran 2MDa (Diff: −0.03AU, 95%CI: ±0.20), as can be seen in Figure 5. These data suggest the Re changes described above are unlikely to be the result of changes to cellular or tissue factors beyond Re.
Molecular Exclusion from the Intercalated Disc
In order to estimate whether the different sized osmotic agents can permeate the intercalated disc (ID), the ID distribution of different sized fluorescently tagged dyes (0.5, 3, and 10kDa) was measured by laser scanning confocal microscopy. Representative images in Figure 6A reveal the presence of the 0.5kDa dye in the ID, and the exclusion of the 3 and 10kDa dyes. Figure 6B demonstrates how ID relative to bulk extracellular dye distribution was quantified by taking fluorescent intensity profiles of the dye through the Cx43 immunolabelled ID. By quantifying the intensity of dye beyond the Cx43 signal (lateral membrane) relative to the dye at the peak of the Cx43 signal, summary data on relative ID localization reveal that 0.5kDa dyes can permeate the ID with a normalized fluorescence intensity of 3.6 (95%CI: ±0.88), which is significantly greater than 1, indicating the dye accumulates in the ID. Relative normalized fluorescence intensity for 3kDa dye was 0.30 (95%CI: ±0.20) and 10kDa dye was 0.12 (95%CI: ±0.04), which are both significantly below 1, indicating these compounds were largely excluded from the ID. The data suggest that even if 66.5kDa albumin freely diffused into the bulk interstitium, it would not penetrate the ID, nor would dextran 70kDa or 2MDa. In short, small molecular weight molecules <3kDa can penetrate the ID and cause osmotically mediated dehiscence, while larger molecules may be size restricted from the ID and prevent or reduce fluid accumulation in these nanodomains.
Figure 6. Molecules smaller than 0.5kDa can permeate the intercalated disc.

A. Representative images of ventricular tissue slices perfused with 0.5, 3, and 10kDa fluorescent dyes. Panels demonstrate extracellular diffusion. Cx43 signal is used to identify the intercalated disc (ID), and nuclei are shown alone and with overlay of all signals. B. A region of interest is identified around the Cx43 ID signal and intensity of signal is averaged to identify the peak of the Cx43 signal. The same spatial averaging with 0.5, 3, and 10kDa signals demonstrates a dip in 3kDa and 10kDa signals with a peak in the 0.5kDa dye signal demonstrating the 0.5kDa dye permeates the ID, but the other two do not. C. The intensity of the dye fluorescent signal at the peak of the Cx43 signal is normalized to the intensity of signal beyond the ID to reveal that fluorescent signal intensities for 3kDa (n=3 images) and 10kDa (n=4 images) are significantly lower than for 0.5kDa (n=7 images) signal intensity. *p<0.05 relative to 0.5kDa, one way ANOVA with Dunnett’s correction.
Ventricular Perinexus
To test the hypothesis that different sized osmotic agents differentially modulate ID volume, we quantified the width of the cardiac perinexus (WP) with transmission electron microscopy (TEM). Representative perinexi from the left ventricle of hearts are shown in Figure 7A at 150,000X magnification. The osmotic agents differentially modulated cell membrane separation immediately adjacent to the GJ plaque within 15 minutes of osmotic agent perfusion. Specifically, and relative to time control, mannitol significantly increased WP by 4.3 nm (95%CI: ±3.1), albumin significantly narrowed WP by −5.1 nm (95%CI: ±2.9), dextran 70kDa did not significantly change WP (Diff: 0.5 nm, 95%CI: ±2.1), and dextran 2MDa significantly narrowed WP by −3.9 nm (95%CI: ±1.8), as can be seen in Figure 7B. Importantly, perinexal quantification revealed an inverse correlation between WP and conduction. Specifically, mannitol widened WP and decreased CV consistent with previous reports,28 and albumin and dextran 2MDa narrowed WP and increased CV.
Figure 7. Cardiac perinexal width inversely correlates with CV.

A. Representative TEM images of ventricular perinexi (shaded yellow) suggest osmotic agents differentially modulate perinexal width (WP). B. Summary data reveal that relative to Time Control (N=9 hearts, n=140 images), Mannitol significantly increases (N=10 hearts, n=170 images), Albumin significantly decreases (N=12 hearts, n=135 images), Dextran 70k Da does not change (N=5 hearts, n=74 images), and Dextran 2MDa significantly decreases (N=5 hearts, n=75 images) WP. Dashed line represents mean WP for time control. *p<0.05, as evaluated with a generalized linear mixed effects model specifying a gamma distribution and identity link between samples collected from the same heart.
Self-Attenuation
To this point, presented data demonstrate that CV is inversely correlated to WP. Yet, the relationship between WP and CV is biphasic. For very narrow perinexi, CV can be directly proportional to WP by altering sodium channel self-attenuation.12,35,55 In a final set of experiments, we hypothesized that combining dextran 70kDa with albumin would further decrease WP and slow CV relative to albumin alone, consistent with previous studies.6 Representative perinexal images and summary data in Figure 8A demonstrate that albumin and dextran 70kDa perfused concurrently significantly decreased WP relative to albumin alone by 2.3 nm (95%CI: ±2.0).
Figure 8. Dextran 70kDa in the presence of albumin can narrow perinexal width and slow conduction relative to albumin alone.

A. Representative TEM images of ventricular perinexi (shaded yellow) and B. summary data reveal that simultaneous perfusion of Albumin and Dextran 70kDa (N=4 hearts, n=60 images) significantly narrows perinexal width (WP) relative to Albumin alone (N=10 hearts, n=150 images), #p<0.05 relative to albumin, as evaluated with a generalized linear mixed effects model specifying a gamma distribution and identity link between samples collected from the same heart. C. Representative activation time isochrones. D. Summary data reveal that cardiac conduction is significantly slower in hearts treated with both Albumin and Dextran 70kDa (N=15 hearts) relative to albumin alone (N=14 hearts). #p<0.05, unpaired two-tailed t-test. Note CV and Wp data for albumin alone is replicated from figures 1 and 7 for comparison.
On average, albumin perfusion increased CVT relative to baseline by Diff: 38% (95%CI: ±13.3). Whereas the combination of albumin and dextran 70kDa did not significantly increase CVT (Diff: 4.8%, 95%CI: ±11.8). Therefore, albumin and dextran 70kDa slowed CVT relative to albumin alone, by Diff: 33.3% (95%CI: ±14.9). On average, albumin perfusion increased CVL relative to baseline by Diff: 16.2% (95%CI: ±7.1). Whereas the combination of albumin and dextran 70kDa did not significantly increase CVT (Diff: 4.5%, 95%CI: ±6.2). Therefore, albumin and dextran 70kDa slowed CVL relative to albumin alone, by Diff: 11.7% (95%CI: ±9.8). These data demonstrate that dextran 70kDa can slow conduction in the presence (Figure 8B), but not the absence of albumin.
DISCUSSION
Herein, we present two primary observations: 1) The cardiac perinexus, a specialized nanodomain of extracellular space within the intercalated disc (ID), can be osmotically expanded and collapsed on a timescale of less than 15 minutes, and 2) The regulation of cardiac epicardial conduction velocity (CV) is biphasically related with perinexal width (WP). Among the conditions tested, we did not observe significant changes in total connexin43 (Cx43) expression or phosphorylation at serine 368 (pCx43-S368), nor did we find altered gap junction coupling (GJC) estimated by fluorescence recovery after photobleaching (FRAP). Additionally, the lack of a monotonic correlation between CV and altered tissue resistance argues for a minimal role in cable-like conduction mediated by gap junctions (GJ) alone. Furthermore, the osmotic agents did not significantly alter peak sodium current, although the change could have been below the resolution of detection. Our interpretation of these data is that extracellular volume changes in sodium channel-rich nanodomains such as the ID perinexus, rather than bulk extracellular resistance (Re), play a substantial role in modulating CV by an ephaptic mechanism in the absence of GJ remodeling.
In the present study, CV measurements for both mannitol and albumin were similar to those described earlier.28 Mannitol expanded WP as we reported earlier.19,29 Albumin and dextran 2MDa both decreased WP and increased CV. When conduction changes were noted, they were primarily observed in the transverse direction of propagation. This is consistent with electrical wavefronts encountering more ID, with associated GJs and ephapses, along the short versus the long axis of cardiomyocytes for a given unit length. More specifically, as cardiomyocytes are highly polarized and IDs are located primarily on the edges of the long-axis, transverse propagation requires the electrical wavefront to “zig-zag” through the lateral edges. Since conduction across the ID is slower than through the myocyte,56 the increased number of junctions in the transverse, relative to the longitudinal direction will multiply the effect of modulating junctional communication on cardiac conduction. Interestingly, 40 g/L dextran 70kDa alone modestly but significantly increased CV in the whole-heart preparation, which seems to be in contrast to a previous study that found conduction slows with dextran 70kDa.6 Unlike our study, albumin was present in the baseline perfusion solution of the previous independent study. This being said, we replicated previous findings that dextran 70kDa in the presence of albumin will prevent the conduction increase associated with albumin alone. We propose the mechanism of CV slowing with dextran 70kDa and albumin is more dependent on perinexal narrowing resulting in ephaptic self-attenuation than a decrease in bulk extracellular impedance. Self-attenuation is predicted to occur when sodium channels decrease extracellular potential or sufficiently deplete extracellular sodium such that the inward driving force of this ion is reduced in ephaptic nanodomains. The results of the experiments with concurrent perfusion of albumin and dextran 70kDa are consistent with previous demonstrations of self-attenuation,19,35 and reconciles conduction differences observed during osmotic stress by our group28,29,31,37 and others.6
Gap Junctions
Cx43-formed GJs and Re are widely accepted as major determinants of cardiac conduction.57–59 Since the half-life of cardiac Cx43 is on the order of 1–2 hours,60 and we observed CV changes at 15 minutes, it is not surprising that we do not measure a significant change in overall connexin protein expression. The further absence of associated changes in pCx43-S368 level is consistent with the lack of observable change in functional GJC estimated from FRAP assays. We previously demonstrated that Cx43 expression levels were not significantly changed by the same concentrations of albumin and mannitol perfused in this study.28 Though we cannot definitively rule out changes to GJ assembly or other Cx43 post-translational modifications, our data, combined with the short time scale of conduction changes, suggest that the primary mechanism for conduction changes may not be significantly attributed to GJC.
Most computational models of ephaptic coupling (EpC) and GJC do not demonstrate a biphasic relationship between CV and cleft width at “nominal” GJC,12–15 leading to the hypothesis that EpC is not particularly relevant during conditions of “normal” GJC. These models often reveal CV slowing secondary to widened cleft widths when GJC is reduced by more than 80%.12–15 As a result, a recurring question is whether EpC has a significant impact on cardiac conduction when GJC is nominal. In addressing this question, it is important to note that early computational models of cardiac conduction mediated by EpC and GJC often assumed normal GJ conductivity that is significantly greater12–15,56 than has been measured experimentally between ventricular cardiomyocytes. Specifically, direct measurement of GJ conductances by dual-cell patch clamp yields estimates ranging from 3 to 2530 nS, with the majority of studies reporting an average GJC of less than 550 nS, independent of species.20–27 Based on this consensus average, actual levels of GJC between myocytes are likely an order of magnitude smaller than the 2000nS values typically used as a nominal estimate of coupling in many computational models. Furthermore, even in models that do not incorporate EpC, GJC is often tuned to higher values than those experimentally measured for the purpose of producing in silico CV values consistent with measurements made in heart.61,62 It is possible that unaccounted for EpC could be a reason for non-physiologic GJC tuning that is necessary to replicate experimentally measured CV in hearts. Importantly, when one retrospectively re-evaluates these key early models in the context of consensus levels of GJC experimentally reported in the literature, EpC emerges as a major determinant of CV under normal, as well as pathological conditions of GJC.
Perinexal Width
In addition to the aforementioned biphasic predictions of the CV-cleft width relationship in computational models of cardiac conduction, computational models that include both EpC and GJC also predict that CV sensitivity to GJC is reduced when intercellular separation is below approximately 20 nm and significantly enhanced at much wider cleft widths. These predictions have since been validated in mice and guinea pigs.29,35,63 Additionally, expansion of the perinexus has been associated with chronic atrial fibrillation in humans.49
Based on the observations that CV is inversely correlated with WP during perfusion with the individual osmotic agents, and that combining albumin and dextran 70kDa narrowed WP more than albumin alone and prevented the albumin mediated CV increase, the data can be interpreted to support an ephaptic mechanism of osmotically regulated cardiac conduction. Specifically, very narrow perinexi are associated with relatively slow conduction (albumin and dextran 70kDa). Expanding the perinexus first increases CV (albumin or dextran 2MDa), then starts to slow CV (control or dextran 70kDa), and eventually dramatically slows CV as perinexi are dramatically disrupted (mannitol). These observations are consistent with an expected biphasic CV-WP relationship predicted by models which include both EpC and GJC.11–14,64
While we frequently report WP near 20 nm, we also have demonstrated that the absolute value is dependent on the blinded experimentalist who traces the boundary of the perinexus in transmission electron microscopy images.49 Additionally, estimating a 3-dimensional volume from 2-dimensional images limits the precision of estimating perinexal volume, and therefore correlation between CV and WP. Even so, the relationship between CV and WP is biphasic and therefore non-monotonic. Regardless, modelling and experimental data should be compared cautiously when attempting to establish numerical relationships between something as simple as channel conductance, whole-cell electrophysiology, and tissue level responses. For example, models often assume a cylindrical geometry of myocytes with a surface area that significantly underestimates the tortuosity of the ID. Incorporating ion tracking13 or simple structural detail into the model such as interdigitation or the known disposition of larger GJs to encircle the ID15 modulates the response and range of CV observed with altered cleft width. The estimated CV values in EpC models are also dependent on sodium channel density in the ID,15 and the location of sodium channel clusters and their relative apposition within the ID.18 While it is tempting to infer a nominal starting point for any parameter on a predicted curve and speculate if CV should increase or decrease with a specific change in WP, this approach is likely premature. New studies utilizing models with enhanced structural detail, biophysics of spatial interactions, and ion channel clustering will likely yield important new insights into the effect of EpC on electrophysiology.55,65
Extracellular Impedance
The electrochemical impedance experiments revealed significant Re changes at a similar time scale when conduction changes, as reported previously.28 Further, the data were collected on a similar temporal scale to the measurements of previous studies that carefully quantified tissue resistance at each point when conduction was measured.6 The physics of cable-like conduction through GJs alone is not compatible with our results, as Re did not directly correlate with conduction. Notably, whereas both the 70kDa and 2MDa dextrans increased Re and should have slowed conduction, they did not: Specifically, 70kDa and 2MDa dextran significantly increased CV. Furthermore, mannitol decreased Re while simultaneously slowing CV as reported previously,28 but according to models only including GJC alone, mannitol should have increased CV.
Importantly, dextran 70kDa increased Re by 21% in guinea pig whole-heart, similar to what was reported by others in isolated rabbit papillary muscle (a change of roughly 45%).6 To address the possibility that one or more osmotic agents altered GJC, cell size, membrane capacitance or any additional intercellular electrical parameters, we modeled the cellular pathway using a constant phase element (CPE). Tissue is composed of various cell types with different shapes and membrane properties, resulting in a distributed cell membrane time constant – the response speed of the cell membrane to electrical stimulation. This distributivity is what we quantified in the parameter, η. Since this parameter did not significantly change with time control, or with the addition of any of our osmotic agents, we conclude that the cell membrane time constant distribution on the tissue level was not substantially affected by our interventions. Therefore, the changes to Re described above are likely a result of changes to the extracellular compartment, i.e. interstitial space. The lack of change in η is also consistent with non-significant changes induced by the osmotic agents in Cx43 expression or FRAP coupling assays. Importantly, macroscopic impedance measurement and its relationship to the cable theory is at best complicated and requires additional study.
Sodium Channels
Despite the non-significant change in peak sodium current (INa) with osmotic agents, it is possible that conduction changes reported in this and previous studies28,30 could be attributed to a change in peak sodium current below our resolution of detection. It should be noted here that the statistical approach may play a role in the ability to report a significant change in peak conductance. Specifically, if each current obtained from a cell is considered an independent measurement, regardless of which heart it was obtained from, a simple non-paired Student’s t-test would suggest that mannitol modestly decreases peak INa on the order of 20%. If mannitol does significantly decrease peak INa, this and previous studies may over-associate conduction slowing with perinexal widening. It is possible that a relatively small sodium channel inhibitory effect of mannitol exacerbates conduction slowing under these conditions as well. Yet, perinexal expansion associated with a peptide developed to disrupt sodium channel beta subunit trans-adhesion did not affect peak sodium current density and also slowed conduction in the same isolated guinea pig whole-heart preparation.31
The computationally predicted relationship of CV to WP is also non-symmetric in the self-attenuation (positive correlation) and self-activation (negative correlation) phases of conduction. It is therefore difficult to know where the “normal” heart may reside on the CV-WP curve because this relationship is also modulated by factors such as sodium and potassium channel localization to the ID, channel unitary conductances, channel availability, cell size, and extracellular sodium and potassium.12–15,19,66–69 Importantly, we provide experimental evidence that the degree of perinexal narrowing or expansion is associated with different magnitudes of CV increase or decrease, respectively. Thus, at present, it is difficult to state to what degree the different osmotic agents should change CV for a given change in WP. We can say with confidence that the change in CV with narrower and wider WP is not uniform. Regardless, evidence continues to support the conclusion that cardiac conduction is well-described by models including both EpC and GJC.
Membrane and Intracellular Pathways
The 4-electrode distributivity measurement, a metric of cell membrane capacitance, cytosolic resistance and GJ resistance, does not significantly differ between controls and cells or tissue incubated with the osmotic agents. This inconclusive result does not support nor exclude the possibility that osmotically induced changes in cellular parameters are significant determinants of CV. The lack of distributivity change is inconsistent with previous results when cell volume was measured by cell morphometry, for example. Specifically, we and others reported that mannitol can decrease isolated ventricular myocyte volume by approximately 7% to 25% for concentrations of mannitol between 50 mM and 143 mM.28,70,71 The discrepancy and lack of significant differences in metrics of intracellular impedance in this study could therefore be a result of: a change that is below the detection resolution of the technique, intra- and interventricular heterogeneity,72 inter-animal variability, and/or variability secondary to cellular isolation.73 Importantly, a previous computational model of conduction found that the relationship between cell size and CV is complexly dependent on both forms of electrical coupling.16,69 Specifically, with relatively high GJC (2500 nS), decreasing cell size can slow conduction, and EpC can modestly steepen that relationship. In contrast, with relatively nominal but closer to normal GJC (100 nS), decreasing cell size can increase CV, but once again EpC modestly increases the steepness of this relationship.69 Since GJC has been measured over a large range of values, and the average value in literature is closer to 550 nS,20–27 we do not know which result to expect. Therefore, the effect of parameters such as cell volume on the observed changes in CV still requires significantly more independent investigation for a number of reasons including: 1) Morphometric changes in myocyte geometry are likely different in an isolated, unloaded cell relative to cells in intact myocardium, 2) The osmotic agents will partition differently between vascular, extracellular, and ID compartments based on osmolyte permeability and size, and 3) The molarity of the osmotic agents used in this study are not identical.
Limitations
No intervention can be applied without experimental consequence. Osmotic agents employed in this study have well-established effects in addition to changing oncotic pressure, and some are used clinically for these and other reasons.
Albumin, for example, has been used to regulate blood pressure due to its binding affinity to the vascular endothelium, leaving vessels at a rate of approximately 5% per hour. Albumin furthermore regulates vascular function and can bind to a number of cations, fatty acids and hormones, in addition to acting as an antioxidant.74
Mannitol, a sugar alcohol, has been used as a hyperosmotic agent to treat high intracranial pressure.75,76 With appropriate dosing and time courses of treatment, mannitol will decrease interstitial edema by drawing fluid out of the cerebral parenchyma; though at higher doses and over long time courses, mannitol will also cross the blood-brain barrier. Once across the blood-brain barrier, mannitol will then have the opposite intended effect, more similar to what we observe in cardiac tissue: drawing fluid into tissue and exacerbating edema.
Dextrans of various sizes have been used, like albumin, as a blood volume expander, with larger dextrans having a more pronounced effect on blood viscosity. Dextran 70kDa has antithrombotic properties and reduces the inflammatory response and troponin-I release after cardiac surgery.77,78 It remains unknown, however, whether the other non-osmotic properties affected our results over the much more acute time frame of less than 15 minutes studied here.
Despite our efforts to select osmotic agents with minimal binding or metabolic effects, we cannot definitively exclude any such effects and advise the reader to cautiously interpret our results about any implications for clinical treatment.
As mentioned previously, experiments were conducted in excised, isolated, male retired breeder, guinea pig ventricles that were perfused with di-4-ANEPPS and preserved for hematoxylin and eosin staining and electron microscopy with formalin and glutaraldehyde, respectively. As such, all values of structural dimensions presented – e.g. WP and interstitial volume, should be interpreted without implication of explicit in vivo values. Additionally, while our CV results are similar to those published previously,28 we observed no significant differences in interstitial volumes between interventions, though all of our values were similar to the controls reported previously. It is worth noting that the reported interstitial volume differences may be attributed to a shorter protocol (15 minutes in this study vs 60 minutes in previous studies), different fixatives (formalin vs glutaraldehyde), different analysis programs (positive-pixel vs color deconvolution), and the statistical approach. Interestingly, previous work suggests that 30 minutes of perfusion is required for changes in Re to reach steady-state.6
Furthermore, albumin is difficult to work with in optical mapping experiments because signal quality degrades quickly, as demonstrated previously30 and in Figure S2A. The reasons for this are not entirely understood since the absorption peak of albumin is approximately 280 nm79,80 and peak excitation for di-4-ANNEPS is near 480 nm.
Optical mapping also provides fluorescent signals from a volume of tissue that includes intramural cells, and volume averaging may “blur” the upstrokes of optical action potentials and capture transmural propagation patterns.81–85 The values of conduction between the left and right ventricle may also be affected by transmural rotational anisotropy given the difference in myocardial thickness.86 Additionally, our CV measures represent an average across the anterior epicardial surface, and the averages contain an indeterminate ratio of points from the left and right ventricles, as well as points that are more apical or basal relative to the pacing electrode. Regional heterogeneities in tissue response and which regions of tissue are quantified in a given image may have unanticipated effects on the magnitude of the observed effects, particularly as our measurement field of view and pacing site is biased towards the left ventricle. Therefore, caution should be taken when considering the absolute CV values presented herein. However, our group is careful about conducting positive and time control measurements with optical mapping under a variety of conditions previously reported to affect conduction: sodium channel inhibitors,29,87 GJ inhibition and Cx43 genetic loss of function35,68 mannitol or albumin,28,30 and changes in extracellular potassium.68
With regards to whether edema confounds epicardial measures of CV due to volume averaging, we currently discount this hypothesis for a few reasons. First, dehydrating tissues should bring more cells into the field of view epicardially and transmurally. Epicardial recruitment of cells into an imaging volume should decrease the speed of conduction by increasing the number of IDs in each pixel, even if the dimmer mid-myocardium would increase conduction. The epicardial recruitment effect is inconsistent with our finding that solutions associated with increased or decreased Re, a metric of bulk hydration, do not correlate with the directional change in conduction. Furthermore, we provide confirmatory evidence that dextran 70kDa in the presence of albumin is associated with slower conduction when compared to hearts perfused only with albumin, and this is consistent with studies using microelectrodes, the same osmotic agents, and papillary muscles that lack rotational anisotropy.6
Finally, within our tissue impedance experiments, electrode array orientation was visually aligned with local fiber orientation. However, as fiber orientation changes in 3-dimensional myocardial tissue, we cannot compare tissue impedance changes between experiments, only between interventions in the same heart. As a result, only the finding that Re changed has practical meaning, but the absolute values of Re and magnitude of change do not have direct physiologic relevance. Additionally, the measurement of Re does not distinguish between bulk extracellular volume expansion or changes to conductivity in the ID. Both volume changes could change Re in the same direction.88,89 However, our observations that CV does not change proportionally in response to Re argues against bulk extracellular volume expansion as the principal determinant of CV in these experiments.
Conclusions
Clinically relevant osmotic agents may impact cardiac conduction by a previously unappreciated mechanism of modulating nanodomain separation between cardiomyocytes in the perinexi of ID. Specifically, this study demonstrates that expanding ID nanodomains densely expressing ion handling proteins can both increase and decrease cardiac conduction consistent with computational predictions of cardiac conduction dependent on both EpC and GJC. While we cannot definitively exclude the possibility of off-target effects from the experimental interventions studied, our data suggest that EpC modulation of one type of ID nanodomain, the perinexus, is a major determinant of cardiac conduction. The perinexus therefore continues to emerge as a therapeutic target for managing cardiac arrhythmias, and further research is needed to better understand the conditions under which perinexal expansion represents a beneficial adaptation or pathologic remodeling.
Supplementary Material
Novelty and Significance.
What is Known?
Changes in extracellular volume affect cardiac conduction and arrhythmia susceptibility.
Cardiac conduction occurs via intercellular electrical communication that is thought to occur exclusively through gap junction coupling.
Under such a model, cardiac conduction velocity (CV) should be directly proportional to extracellular resistance.
What New Information Does This Article Contribute?
Exposure to clinically relevant osmotic agents leads to edema within the cardiac intercalated disc nanodomain known as the perinexus.
During treatment with these osmotic agents, cardiac conduction does not correlate with extracellular resistance, but is biphasically related to perinexal separation.
These findings are consistent with computational predictions of cardiac conduction dependent on both ephaptic and gap junctional coupling, but not gap junctional coupling alone.
Clinical efforts to improve cardiac conduction by targeting gap junctions have met with limited success. An alternative form of electrical communication, called ephaptic coupling has been proposed, but controversies about similar experimental conditions yielding different results prevented the reconciliation of electrotonic coupling through gap junctions with ephaptic coupling in the heart. Specifically, electrotonic coupling predicts that conduction is positively correlated with extracellular resistance, and ephaptic coupling predicts a biphasic correlation between conduction and cellular separation in the intercalated disc. This study reconciles previous controversies, reveals that cardiac conduction is biphasically related to perinexal separation, and ephaptic coupling is an important determinant of cardiac conduction. The results support ephaptic coupling as a novel target for improving cardiac conduction and possibly preventing arrhythmias.
SOURCES OF FUNDING:
This work was supported by NIH R01-HL102298, R01-HL138003 awarded to SP and R01-HL141855-04 awarded to SP and RG, R01-HL56728-18 and 1R35 HL161237-01 awarded to RG, NIH R01-HL132236 awarded to JWS, NIH F31 HL140873-02 awarded to TR, NIH F31 HL14743801 awarded to DRK, ICTAS Center for Engineered Health awarded to RD, and R01HL094450 and 1R01HL096962 awarded to ID.
Non-standard Abbreviations and Acronyms
- APD/APD90
Action Potential Duration/APD as measured at 90% repolarization
- CBX
Carbenoxolone
- CVT/L
Conduction Velocity, Transverse/Longitudinal direction
- EpC
Ephaptic Coupling
- η
Distributivity of the time constant of the CPE
- FRAP
Fluorescent Recovery After Photobleaching
- GJ
Gap Junction
- GJC
Gap Junction Coupling
- H&E
Hematoxylin and Eosin
- INa
Peak Sodium Channel Current
- ID
Intercalated Disc
- pCx43-S368
Cx43, Phosphorylated at serine 368
- Re
Extracellular tissue resistance
- TEM
Transmission Electron Microscopy
- VIS
Volume of Interstitial Space
- WP
Width of the Perinexus
Footnotes
DISCLOSURES: None.
Supplemental Materials:
Expanded Materials & Methods, Online Figures S1–S4, Online Tables S1–S10.
REFERENCES
- 1.Keener JP. The effects of gap junctions on propagation in myocardium: a modified cable theory. Annals of the New York Academy of Sciences. 1990;591:257–277. doi: 10.1111/j.1749-6632.1990.tb15094.x [DOI] [PubMed] [Google Scholar]
- 2.Henriquez CS. Simulating the electrical behavior of cardiac tissue using the bidomain model. Crit Rev Biomed Eng. 1993;21:1–77. [PubMed] [Google Scholar]
- 3.Nadim F, Golowasch J. Signal transmission between gap-junctionally coupled passive cables is most effective at an optimal diameter. J Neurophysiol. 2006;95:3831–3843. doi: 10.1152/jn.00033.2006 [DOI] [PMC free article] [PubMed] [Google Scholar]
- 4.Johnston BM, Coveney S, Chang ETY, Johnston PR, Clayton RH. Quantifying the effect of uncertainty in input parameters in a simplified bidomain model of partial thickness ischaemia. Med Biol Eng Comput. 2018;56:761–780. doi: 10.1007/s11517-017-1714-y [DOI] [PMC free article] [PubMed] [Google Scholar]
- 5.Kleber AG, Riegger CB. Electrical constants of arterially perfused rabbit papillary muscle. The Journal of physiology. 1987;385:307–324. [DOI] [PMC free article] [PubMed] [Google Scholar]
- 6.Fleischhauer J, Lehmann L, Kleber AG. Electrical resistances of interstitial and microvascular space as determinants of the extracellular electrical field and velocity of propagation in ventricular myocardium. Circulation. 1995;92:587–594. [DOI] [PubMed] [Google Scholar]
- 7.Sperelakis N, McConnell K. Electric field interactions between closely abutting excitable cells. IEEE engineering in medicine and biology magazine : the quarterly magazine of the Engineering in Medicine & Biology Society. 2002;21:77–89. [DOI] [PubMed] [Google Scholar]
- 8.Shibata Y, Yamamoto T. Freeze-fractrue studies of gap junctions in vertebrate cardiac muscle cells. J Ultrastruct Res. 1979;67:79–88. doi: 10.1016/s0022-5320(79)80020-9 [DOI] [PubMed] [Google Scholar]
- 9.Akester AR. Intercalated discs, nexuses, sarcoplasmic reticulum and transitional cells in the heart of the adult domestic fowl (Gallus gallus domesticus). J Anat. 1981;133:161–179. [PMC free article] [PubMed] [Google Scholar]
- 10.Gutstein DE, Morley GE, Tamaddon H, Vaidya D, Schneider MD, Chen J, Chien KR, Stuhlmann H, Fishman GI. Conduction slowing and sudden arrhythmic death in mice with cardiac-restricted inactivation of connexin43. Circulation research. 2001;88:333–339. [DOI] [PMC free article] [PubMed] [Google Scholar]
- 11.Sperelakis N, Mann JE Jr. Evaluation of electric field changes in the cleft between excitable cells. J Theor Biol. 1977;64:71–96. doi: 10.1016/0022-5193(77)90114-x [DOI] [PubMed] [Google Scholar]
- 12.Kucera JP, Rohr S, Rudy Y. Localization of sodium channels in intercalated disks modulates cardiac conduction. Circulation research. 2002;91:1176–1182. [DOI] [PMC free article] [PubMed] [Google Scholar]
- 13.Mori Y, Fishman GI, Peskin CS. Ephaptic conduction in a cardiac strand model with 3D electrodiffusion. Proceedings of the National Academy of Sciences of the United States of America. 2008;105:6463–6468. doi: 10.1073/pnas.0801089105 [DOI] [PMC free article] [PubMed] [Google Scholar]
- 14.Tsumoto K, Ashihara T, Haraguchi R, Nakazawa K, Kurachi Y. Roles of subcellular Na+ channel distributions in the mechanism of cardiac conduction. Biophysical journal. 2011;100:554–563. doi: 10.1016/j.bpj.2010.12.3716 [DOI] [PMC free article] [PubMed] [Google Scholar]
- 15.Lin J, Keener JP. Ephaptic coupling in cardiac myocytes. IEEE transactions on bio-medical engineering. 2013;60:576–582. doi: 10.1109/TBME.2012.2226720 [DOI] [PubMed] [Google Scholar]
- 16.Weinberg SH. Ephaptic coupling rescues conduction failure in weakly coupled cardiac tissue with voltage-gated gap junctions. Chaos. 2017;27:093908. doi: 10.1063/1.4999602 [DOI] [PubMed] [Google Scholar]
- 17.Rhett JM, Ongstad EL, Jourdan J, Gourdie RG. Cx43 associates with Na(v)1.5 in the cardiomyocyte perinexus. The Journal of membrane biology. 2012;245:411–422. doi: 10.1007/s00232-012-9465-z [DOI] [PMC free article] [PubMed] [Google Scholar]
- 18.Hichri E, Abriel H, Kucera JP. Distribution of cardiac sodium channels in clusters potentiates ephaptic interactions in the intercalated disc. The Journal of physiology. 2018;596:563–589. doi: 10.1113/JP275351 [DOI] [PMC free article] [PubMed] [Google Scholar]
- 19.Greer-Short A, George SA, Poelzing S, Weinberg SH. Revealing the Concealed Nature of Long-QT Type 3 Syndrome. Circulation Arrhythmia and electrophysiology. 2017;10:e004400. doi: 10.1161/CIRCEP.116.004400 [DOI] [PMC free article] [PubMed] [Google Scholar]
- 20.Yao JA, Hussain W, Patel P, Peters NS, Boyden PA, Wit AL. Remodeling of gap junctional channel function in epicardial border zone of healing canine infarcts. Circulation research. 2003;92:437–443. doi: 10.1161/01.RES.0000059301.81035.06 [DOI] [PubMed] [Google Scholar]
- 21.Xing D, Kjolbye AL, Nielsen MS, Petersen JS, Harlow KW, Holstein-Rathlou NH, Martins JB. ZP123 increases gap junctional conductance and prevents reentrant ventricular tachycardia during myocardial ischemia in open chest dogs. Journal of cardiovascular electrophysiology. 2003;14:510–520. doi: 10.1046/j.1540-8167.2003.02329.x [DOI] [PubMed] [Google Scholar]
- 22.Yao JA, Gutstein DE, Liu F, Fishman GI, Wit AL. Cell coupling between ventricular myocyte pairs from connexin43-deficient murine hearts. Circulation research. 2003;93:736–743. doi: 10.1161/01.RES.0000095977.66660.86 [DOI] [PubMed] [Google Scholar]
- 23.White RL, Spray DC, Campos de Carvalho AC, Wittenberg BA, Bennett MV. Some electrical and pharmacological properties of gap junctions between adult ventricular myocytes. The American journal of physiology. 1985;249:C447–455. doi: 10.1152/ajpcell.1985.249.5.C447 [DOI] [PubMed] [Google Scholar]
- 24.Weng S, Lauven M, Schaefer T, Polontchouk L, Grover R, Dhein S. Pharmacological modification of gap junction coupling by an antiarrhythmic peptide via protein kinase C activation. FASEB journal : official publication of the Federation of American Societies for Experimental Biology. 2002;16:1114–1116. doi: 10.1096/fj.01-0918fje [DOI] [PubMed] [Google Scholar]
- 25.Kameyama M Electrical coupling between ventricular paired cells isolated from guinea-pig heart. The Journal of physiology. 1983;336:345–357. doi: 10.1113/jphysiol.1983.sp014585 [DOI] [PMC free article] [PubMed] [Google Scholar]
- 26.Noma A, Tsuboi N. Dependence of junctional conductance on proton, calcium and magnesium ions in cardiac paired cells of guinea-pig. The Journal of physiology. 1987;382:193–211. [DOI] [PMC free article] [PubMed] [Google Scholar]
- 27.Verheule S, van Kempen MJ, te Welscher PH, Kwak BR, Jongsma HJ. Characterization of gap junction channels in adult rabbit atrial and ventricular myocardium. Circulation research. 1997;80:673–681. doi: 10.1161/01.res.80.5.673 [DOI] [PubMed] [Google Scholar]
- 28.Veeraraghavan R, Salama ME, Poelzing S. Interstitial volume modulates the conduction velocity-gap junction relationship. American journal of physiology Heart and circulatory physiology. 2012;302:H278–286. doi: 10.1152/ajpheart.00868.2011 [DOI] [PMC free article] [PubMed] [Google Scholar]
- 29.Veeraraghavan R, Lin J, Hoeker GS, Keener JP, Gourdie RG, Poelzing S. Sodium channels in the Cx43 gap junction perinexus may constitute a cardiac ephapse: an experimental and modeling study. Pflugers Archiv : European journal of physiology. 2015;467:2093–2105. doi: 10.1007/s00424-014-1675-z [DOI] [PMC free article] [PubMed] [Google Scholar]
- 30.George SA, Hoeker G, Calhoun PJ, Entz M 2nd, Raisch TB, King DR, Khan M, Baker C, Gourdie RG, Smyth JW, et al. Modulating cardiac conduction during metabolic ischemia with perfusate sodium and calcium in guinea pig hearts. American journal of physiology Heart and circulatory physiology. 2019;316:H849–H861. doi: 10.1152/ajpheart.00083.2018 [DOI] [PMC free article] [PubMed] [Google Scholar]
- 31.Veeraraghavan R, Hoeker GS, Alvarez-Laviada A, Hoagland D, Wan X, King DR, Sanchez-Alonso J, Chen C, Jourdan J, Isom LL, et al. The adhesion function of the sodium channel beta subunit (beta1) contributes to cardiac action potential propagation. Elife. 2018;7. doi: 10.7554/eLife.37610 [DOI] [PMC free article] [PubMed] [Google Scholar]
- 32.Entz M 2nd, King DR, Poelzing S. Design and validation of a tissue bath 3-D printed with PLA for optically mapping suspended whole heart preparations. American journal of physiology Heart and circulatory physiology. 2017;313:H1190–H1198. doi: 10.1152/ajpheart.00150.2017 [DOI] [PMC free article] [PubMed] [Google Scholar]
- 33.Dreher MR, Liu W, Michelich CR, Dewhirst MW, Yuan F, Chilkoti A. Tumor vascular permeability, accumulation, and penetration of macromolecular drug carriers. J Natl Cancer Inst. 2006;98:335–344. doi: 10.1093/jnci/djj070 [DOI] [PubMed] [Google Scholar]
- 34.George SA, Poelzing S. Cardiac conduction in isolated hearts of genetically modified mice - Connexin43 and salts. Progress in biophysics and molecular biology. 2015. doi: 10.1016/j.pbiomolbio.2015.11.004 [DOI] [PMC free article] [PubMed] [Google Scholar]
- 35.George SA, Bonakdar M, Zeitz M, Davalos R, Smyth JW, Poelzing S. Extracellular Sodium Dependence of the Conduction Velocity-Calcium Relationship: Evidence of Ephaptic Self-Attenuation. American journal of physiology Heart and circulatory physiology. 2016:ajpheart 00857 02015. doi: 10.1152/ajpheart.00857.2015 [DOI] [PMC free article] [PubMed] [Google Scholar]
- 36.Entz M 2nd, George SA, Zeitz MJ, Raisch T, Smyth JW, Poelzing S. Heart Rate and Extracellular Sodium and Potassium Modulation of Gap Junction Mediated Conduction in Guinea Pigs. Frontiers in physiology. 2016;7:16. doi: 10.3389/fphys.2016.00016 [DOI] [PMC free article] [PubMed] [Google Scholar]
- 37.Veeraraghavan R, Lin J, Keener JP, Gourdie R, Poelzing S. Potassium channels in the Cx43 gap junction perinexus modulate ephaptic coupling: an experimental and modeling study. Pflugers Archiv : European journal of physiology. 2016;468:1651–1661. doi: 10.1007/s00424-016-1861-2 [DOI] [PMC free article] [PubMed] [Google Scholar]
- 38.Burton FL, Cobbe SM. Dispersion of ventricular repolarization and refractory period. Cardiovascular research. 2001;50:10–23. doi: 10.1016/s0008-6363(01)00197-3 [DOI] [PubMed] [Google Scholar]
- 39.Smyth JW, Hong TT, Gao D, Vogan JM, Jensen BC, Fong TS, Simpson PC, Stainier DY, Chi NC, Shaw RM. Limited forward trafficking of connexin 43 reduces cell-cell coupling in stressed human and mouse myocardium. The Journal of clinical investigation. 2010;120:266–279. doi: 10.1172/JCI39740 [DOI] [PMC free article] [PubMed] [Google Scholar]
- 40.Solan JL, Fry MD, TenBroek EM, Lampe PD. Connexin43 phosphorylation at S368 is acute during S and G2/M and in response to protein kinase C activation. J Cell Sci. 2003;116:2203–2211. doi: 10.1242/jcs.00428 [DOI] [PubMed] [Google Scholar]
- 41.Bohuslavova R, Kolar F, Sedmera D, Skvorova L, Papousek F, Neckar J, Pavlinkova G. Partial deficiency of HIF-1alpha stimulates pathological cardiac changes in streptozotocin-induced diabetic mice. BMC Endocr Disord. 2014;14:11. doi: 10.1186/1472-6823-14-11 [DOI] [PMC free article] [PubMed] [Google Scholar]
- 42.Decrock E, De Vuyst E, Vinken M, Van Moorhem M, Vranckx K, Wang N, Van Laeken L, De Bock M, D’Herde K, Lai CP, et al. Connexin 43 hemichannels contribute to the propagation of apoptotic cell death in a rat C6 glioma cell model. Cell Death Differ. 2009;16:151–163. doi: 10.1038/cdd.2008.138 [DOI] [PubMed] [Google Scholar]
- 43.Yum SW, Zhang J, Valiunas V, Kanaporis G, Brink PR, White TW, Scherer SS. Human connexin26 and connexin30 form functional heteromeric and heterotypic channels. American journal of physiology Cell physiology. 2007;293:C1032–1048. doi: 10.1152/ajpcell.00011.2007 [DOI] [PubMed] [Google Scholar]
- 44.Rhett JM, Jourdan J, Gourdie RG. Connexin 43 connexon to gap junction transition is regulated by zonula occludens-1. Molecular biology of the cell. 2011;22:1516–1528. doi: 10.1091/mbc.E10-06-0548 [DOI] [PMC free article] [PubMed] [Google Scholar]
- 45.Wan X, Laurita KR, Pruvot EJ, Rosenbaum DS. Molecular correlates of repolarization alternans in cardiac myocytes. Journal of molecular and cellular cardiology. 2005;39:419–428. doi: 10.1016/j.yjmcc.2005.06.004 [DOI] [PubMed] [Google Scholar]
- 46.Zhao Y, Liu H, Bhonsle SP, Wang Y, Davalos RV, Yao C. Ablation outcome of irreversible electroporation on potato monitored by impedance spectrum under multi-electrode system. Biomed Eng Online. 2018;17:126. doi: 10.1186/s12938-018-0562-9 [DOI] [PMC free article] [PubMed] [Google Scholar]
- 47.Bonakdar M, Latouche EL, Mahajan RL, Davalos RV. The Feasibility of a Smart Surgical Probe for Verification of IRE Treatments Using Electrical Impedance Spectroscopy. IEEE transactions on bio-medical engineering. 2015;62:2674–2684. doi: 10.1109/TBME.2015.2441636 [DOI] [PubMed] [Google Scholar]
- 48.Raisch T, Khan M, Poelzing S. Quantifying Intermembrane Distances with Serial Image Dilations. Journal of visualized experiments : JoVE. 2018. doi: 10.3791/58311 [DOI] [PMC free article] [PubMed] [Google Scholar]
- 49.Raisch TB, Yanoff MS, Larsen TR, Farooqui MA, King DR, Veeraraghavan R, Gourdie RG, Baker JW, Arnold WS, AlMahameed ST, et al. Intercalated Disk Extracellular Nanodomain Expansion in Patients With Atrial Fibrillation. Frontiers in physiology. 2018;9:398. doi: 10.3389/fphys.2018.00398 [DOI] [PMC free article] [PubMed] [Google Scholar]
- 50.Lampe PD, TenBroek EM, Burt JM, Kurata WE, Johnson RG, Lau AF. Phosphorylation of connexin43 on serine368 by protein kinase C regulates gap junctional communication. The Journal of cell biology. 2000;149:1503–1512. doi: 10.1083/jcb.149.7.1503 [DOI] [PMC free article] [PubMed] [Google Scholar]
- 51.Ek-Vitorin JF, King TJ, Heyman NS, Lampe PD, Burt JM. Selectivity of connexin 43 channels is regulated through protein kinase C-dependent phosphorylation. Circulation research. 2006;98:1498–1505. doi: 10.1161/01.RES.0000227572.45891.2c [DOI] [PMC free article] [PubMed] [Google Scholar]
- 52.Solan JL, Lampe PD. Connexin43 phosphorylation: structural changes and biological effects. The Biochemical journal. 2009;419:261–272. doi: 10.1042/BJ20082319 [DOI] [PMC free article] [PubMed] [Google Scholar]
- 53.De Vuyst E, De Bock M, Decrock E, Van Moorhem M, Naus C, Mabilde C, Leybaert L. In situ bipolar electroporation for localized cell loading with reporter dyes and investigating gap junctional coupling. Biophysical journal. 2008;94:469–479. doi: 10.1529/biophysj.107.109470 [DOI] [PMC free article] [PubMed] [Google Scholar]
- 54.Stiles DK, Oakley BA. Four-point electrode measurement of impedance in the vicinity of bovine aorta for quasi-static frequencies. Bioelectromagnetics. 2005;26:54–58. doi: 10.1002/bem.20074 [DOI] [PubMed] [Google Scholar]
- 55.Ivanovic E, Kucera JP. Localization of Na(+) channel clusters in narrowed perinexi of gap junctions enhances cardiac impulse transmission via ephaptic coupling: a model study. The Journal of physiology. 2021;599:4779–4811. doi: 10.1113/JP282105 [DOI] [PMC free article] [PubMed] [Google Scholar]
- 56.Shaw RM, Rudy Y. Ionic mechanisms of propagation in cardiac tissue. Roles of the sodium and L-type calcium currents during reduced excitability and decreased gap junction coupling. Circulation research. 1997;81:727–741. [DOI] [PubMed] [Google Scholar]
- 57.de Groot JR, Veenstra T, Verkerk AO, Wilders R, Smits JP, Wilms-Schopman FJ, Wiegerinck RF, Bourier J, Belterman CN, Coronel R, et al. Conduction slowing by the gap junctional uncoupler carbenoxolone. Cardiovascular research. 2003;60:288–297. [DOI] [PubMed] [Google Scholar]
- 58.Veeraraghavan R, Gourdie RG, Poelzing S. Mechanisms of cardiac conduction: a history of revisions. American journal of physiology Heart and circulatory physiology. 2014;306:H619–627. doi: 10.1152/ajpheart.00760.2013 [DOI] [PMC free article] [PubMed] [Google Scholar]
- 59.Kleber AG, Saffitz JE. Role of the intercalated disc in cardiac propagation and arrhythmogenesis. Frontiers in physiology. 2014;5:404. doi: 10.3389/fphys.2014.00404 [DOI] [PMC free article] [PubMed] [Google Scholar]
- 60.Shaw RM, Fay AJ, Puthenveedu MA, von Zastrow M, Jan YN, Jan LY. Microtubule plus-end-tracking proteins target gap junctions directly from the cell interior to adherens junctions. Cell. 2007;128:547–560. doi: 10.1016/j.cell.2006.12.037 [DOI] [PMC free article] [PubMed] [Google Scholar]
- 61.Neu JC, Krassowska W. Homogenization of syncytial tissues. Crit Rev Biomed Eng. 1993;21:137–199. [PubMed] [Google Scholar]
- 62.Pourtaheri N, Ying W, Kim J, Henriquez C. Thresholds for Transverse Stimulation: Fiber Bundles in a Uniform Field. IEEE transactions on neural systems and rehabilitation engineering : a publication of the IEEE Engineering in Medicine and Biology Society. 2021;PP. doi: 10.1109/TNSRE.2009.2039600 [DOI] [PubMed] [Google Scholar]
- 63.George SA, Calhoun PJ, Gourdie RG, Smyth JW, Poelzing S. TNFalpha Modulates Cardiac Conduction by Altering Electrical Coupling between Myocytes. Frontiers in physiology. 2017;8:334. doi: 10.3389/fphys.2017.00334 [DOI] [PMC free article] [PubMed] [Google Scholar]
- 64.Lin J, Keener JP. Modeling electrical activity of myocardial cells incorporating the effects of ephaptic coupling. Proceedings of the National Academy of Sciences of the United States of America. 2010;107:20935–20940. doi: 10.1073/pnas.1010154107 [DOI] [PMC free article] [PubMed] [Google Scholar]
- 65.Moise N, Struckman HL, Dagher C, Veeraraghavan R, Weinberg SH. Intercalated disk nanoscale structure regulates cardiac conduction. The Journal of general physiology. 2021;153. doi: 10.1085/jgp.202112897 [DOI] [PMC free article] [PubMed] [Google Scholar]
- 66.Nowak MB, Greer-Short A, Wan X, Wu X, Deschenes I, Weinberg SH, Poelzing S. Intercellular Sodium Regulates Repolarization in Cardiac Tissue with Sodium Channel Gain of Function. Biophysical journal. 2020;118:2829–2843. doi: 10.1016/j.bpj.2020.04.014 [DOI] [PMC free article] [PubMed] [Google Scholar]
- 67.Nowak MB, Poelzing S, Weinberg SH. Mechanisms underlying age-associated manifestation of cardiac sodium channel gain-of-function. Journal of molecular and cellular cardiology. 2020;153:60–71. doi: 10.1016/j.yjmcc.2020.12.008 [DOI] [PMC free article] [PubMed] [Google Scholar]
- 68.King DR, Entz M 2nd, Blair GA, Crandell I, Hanlon AL, Lin J, Hoeker GS, Poelzing S. The conduction velocity-potassium relationship in the heart is modulated by sodium and calcium. Pflugers Archiv : European journal of physiology. 2021;473:557–571. doi: 10.1007/s00424-021-02537-y [DOI] [PMC free article] [PubMed] [Google Scholar]
- 69.Nowak MB, Veeraraghavan R, Poelzing S, Weinberg SH. Cellular Size, Gap Junctions, and Sodium Channel Properties Govern Developmental Changes in Cardiac Conduction. Frontiers in physiology. 2021;12:731025. doi: 10.3389/fphys.2021.731025 [DOI] [PMC free article] [PubMed] [Google Scholar]
- 70.Boyett MR, Frampton JE, Kirby MS. The length, width and volume of isolated rat and ferret ventricular myocytes during twitch contractions and changes in osmotic strength. Exp Physiol. 1991;76:259–270. doi: 10.1113/expphysiol.1991.sp003492 [DOI] [PubMed] [Google Scholar]
- 71.Morell M, Burgos JI, Gonano LA, Vila Petroff M. AMPK-dependent nitric oxide release provides contractile support during hyperosmotic stress. Basic research in cardiology. 2018;113:7. doi: 10.1007/s00395-017-0665-7 [DOI] [PubMed] [Google Scholar]
- 72.Veeraraghavan R, Poelzing S. Mechanisms underlying increased right ventricular conduction sensitivity to flecainide challenge. Cardiovascular research. 2008;77:749–756. doi: 10.1093/cvr/cvm090 [DOI] [PubMed] [Google Scholar]
- 73.Burton RAB, Rog-Zielinska EA, Corbett AD, Peyronnet R, Bodi I, Fink M, Sheldon J, Hoenger A, Calaghan SC, Bub G, et al. Caveolae in Rabbit Ventricular Myocytes: Distribution and Dynamic Diminution after Cell Isolation. Biophysical journal. 2017;113:1047–1059. doi: 10.1016/j.bpj.2017.07.026 [DOI] [PMC free article] [PubMed] [Google Scholar]
- 74.Quinlan GJ, Martin GS, Evans TW. Albumin: biochemical properties and therapeutic potential. Hepatology. 2005;41:1211–1219. doi: 10.1002/hep.20720 [DOI] [PubMed] [Google Scholar]
- 75.Muizelaar JP, Lutz HA 3rd, Becker DP. Effect of mannitol on ICP and CBF and correlation with pressure autoregulation in severely head-injured patients. J Neurosurg. 1984;61:700–706. doi: 10.3171/jns.1984.61.4.0700 [DOI] [PubMed] [Google Scholar]
- 76.Knapp JM. Hyperosmolar therapy in the treatment of severe head injury in children: mannitol and hypertonic saline. AACN Clin Issues. 2005;16:199–211. doi: 10.1097/00044067-200504000-00011 [DOI] [PubMed] [Google Scholar]
- 77.Gombocz K, Beledi A, Alotti N, Kecskes G, Gabor V, Bogar L, Koszegi T, Garai J. Influence of dextran-70 on systemic inflammatory response and myocardial ischaemia-reperfusion following cardiac operations. Crit Care. 2007;11:R87. doi: 10.1186/cc6095 [DOI] [PMC free article] [PubMed] [Google Scholar]
- 78.Zhang B, Wieslander JB. Dextran’s antithrombotic properties in small arteries are not altered by low-molecular-weight heparin or the fibrinolytic inhibitor tranexamic acid: an experimental study. Microsurgery. 1993;14:289–295. doi: 10.1002/micr.1920140415 [DOI] [PubMed] [Google Scholar]
- 79.Togashi D, Ryder A, Mc Mahon D, Dunne P, McManus J. Fluorescence study of bovine serum albumin and Ti and Sn oxide nanoparticles interactions. SPIE; 2007. [Google Scholar]
- 80.Gautam S, Gupta MN. Solid state fluorescence of proteins in high throughput mode and its applications. F1000Res. 2013;2:82. doi: 10.12688/f1000research.2-82.v2 [DOI] [PMC free article] [PubMed] [Google Scholar]
- 81.Hyatt CJ, Mironov SF, Wellner M, Berenfeld O, Popp AK, Weitz DA, Jalife J, Pertsov AM. Synthesis of voltage-sensitive fluorescence signals from three-dimensional myocardial activation patterns. Biophysical journal. 2003;85:2673–2683. doi: 10.1016/S0006-3495(03)74690-6 [DOI] [PMC free article] [PubMed] [Google Scholar]
- 82.Bray MA, Wikswo JP. Examination of optical depth effects on fluorescence imaging of cardiac propagation. Biophysical journal. 2003;85:4134–4145. doi: 10.1016/S0006-3495(03)74825-5 [DOI] [PMC free article] [PubMed] [Google Scholar]
- 83.Hyatt CJ, Mironov SF, Vetter FJ, Zemlin CW, Pertsov AM. Optical action potential upstroke morphology reveals near-surface transmural propagation direction. Circulation research. 2005;97:277–284. doi: 10.1161/01.RES.0000176022.74579.47 [DOI] [PubMed] [Google Scholar]
- 84.Bishop MJ, Rodriguez B, Eason J, Whiteley JP, Trayanova N, Gavaghan DJ. Synthesis of voltage-sensitive optical signals: application to panoramic optical mapping. Biophysical journal. 2006;90:2938–2945. doi: 10.1529/biophysj.105.076505 [DOI] [PMC free article] [PubMed] [Google Scholar]
- 85.Taccardi B, Macchi E, Lux RL, Ershler PR, Spaggiari S, Baruffi S, Vyhmeister Y. Effect of myocardial fiber direction on epicardial potentials. Circulation. 1994;90:3076–3090. doi: 10.1161/01.cir.90.6.3076 [DOI] [PubMed] [Google Scholar]
- 86.Vetter FJ, Simons SB, Mironov S, Hyatt CJ, Pertsov AM. Epicardial fiber organization in swine right ventricle and its impact on propagation. Circulation research. 2005;96:244–251. doi: 10.1161/01.RES.0000153979.71859.e7 [DOI] [PubMed] [Google Scholar]
- 87.Veeraraghavan R, Larsen AP, Torres NS, Grunnet M, Poelzing S. Potassium channel activators differentially modulate the effect of sodium channel blockade on cardiac conduction. Acta Physiol (Oxf). 2013;207:280–289. doi: 10.1111/j.1748-1716.2012.02481.x [DOI] [PMC free article] [PubMed] [Google Scholar]
- 88.Ebihara L, Mathias RT. Linear impedance studies of voltage-dependent conductances in tissue cultured chick heart cells. Biophysical journal. 1985;48:449–460. doi: 10.1016/S0006-3495(85)83800-5 [DOI] [PMC free article] [PubMed] [Google Scholar]
- 89.Mathias RT. Effect of tortuous extracellular pathways on resistance measurements. Biophysical journal. 1983;42:55–59. doi: 10.1016/S0006-3495(83)84368-9 [DOI] [PMC free article] [PubMed] [Google Scholar]
- 90.Xue J, Yan X, Yang Y, Chen M, Wu L, Gou Z, Sun Z, Talabieke S, Zheng Y, Luo D. Connexin 43 dephosphorylation contributes to arrhythmias and cardiomyocyte apoptosis in ischemia/reperfusion hearts. Basic research in cardiology. 2019;114:40. doi: 10.1007/s00395-019-0748-8 [DOI] [PubMed] [Google Scholar]
Associated Data
This section collects any data citations, data availability statements, or supplementary materials included in this article.
Supplementary Materials
Data Availability Statement
Data supporting the findings of this study are available from the corresponding author upon reasonable request. An expanded Materials and Methods section can be found in the Data Supplement.