

Visual Abstract

Keywords: AKI, cytokines, endothelium, kidney tubule
Abstract
Significance Statement
Activation of the type 1 IL-1 receptor (IL-1R1) triggers a critical innate immune signaling cascade that contributes to the pathogenesis of AKI. However, blockade of IL-1 signaling in AKI has not consistently demonstrated kidney protection. The current murine experiments show that IL-1R1 activation in the proximal tubule exacerbates toxin-induced AKI and cell death through local suppression of apolipoprotein M. By contrast, IL-1R1 activation in endothelial cells ameliorates AKI by restoring VEGFA-dependent endothelial cell viability. Using this information, future delivery strategies can maximize the protective effects of blocking IL-1R1 while mitigating unwanted actions of IL-1R1 manipulation.
Background
Activation of the type 1 IL-1 receptor (IL-1R1) triggers a critical innate immune signaling cascade that contributes to the pathogenesis of AKI. IL-1R1 is expressed on some myeloid cell populations and on multiple kidney cell lineages, including tubular and endothelial cells. Pharmacological inhibition of the IL-1R1 does not consistently protect the kidney from injury, suggesting there may be complex, cell-specific effects of IL-1R1 stimulation in AKI.
Methods
To examine expression of IL-1 and IL-1R1 in intrinsic renal versus infiltrating immune cell populations during AKI, we analyzed single-cell RNA sequencing (scRNA-seq) data from kidney tissues of humans with AKI and mice with acute aristolochic acid exposure. We then investigated cell-specific contributions of renal IL-1R1 signaling to AKI using scRNA-seq, RNA microarray, and pharmacological interventions in mice with IL-1R1 deletion restricted to the proximal tubule or endothelium.
Results
scRNA-seq analyses demonstrated robust IL-1 expression in myeloid cell populations and low-level IL-1R1 expression in kidney parenchymal cells during toxin-induced AKI. Our genetic studies showed that IL-1R1 activation in the proximal tubule exacerbated toxin-induced AKI and cell death through local suppression of apolipoprotein M. By contrast, IL-1R1 activation in endothelial cells ameliorated aristolochic acid–induced AKI by restoring VEGFA-dependent endothelial cell viability and density.
Conclusions
These data highlight opposing cell-specific effects of IL-1 receptor signaling on AKI after toxin exposure. Disrupting pathways activated by IL-1R1 in the tubule, while preserving those triggered by IL-1R1 activation on endothelial cells, may afford renoprotection exceeding that of global IL-1R1 inhibition while mitigating unwanted actions of IL-1R1 blockade.
Introduction
AKI is a common and devastating disease in the intensive care unit because it develops in up to 30% of critically ill patients.1 The complex nature of critical illness often requires the use of a variety of therapeutic agents, many of which may be used alone or in combination that have the potential to cause renal injury. The use of nephrotoxic agents is a pathogenic factor in up to 25% of severe acute renal failure cases in critically ill patients.2 Because there is a lack of effective therapies for treating toxin-induced nephropathy, deciphering its underlying molecular mechanisms could have a major effect on human health.3
Toxin-induced nephrotoxicity manifests with tubular injury, vascular damage, and renal inflammation. In particular, mounting evidence shows that the renal inflammatory milieu plays a vital role in the initiation and progression of toxin-induced nephropathy.4 Immune cells infiltrate the damaged kidney tissue, triggering secretion of several inflammatory cytokines. Among these, the IL-1 cytokine isoforms, IL-1α and IL-1β, play primary roles in initiating inflammatory cascades through the type I IL-1 receptor (IL-1R1) in a paracrine and autocrine manner.5 Despite the clear capacity of IL-1R1 activation to trigger tissue damage, the role and function of IL-1R1 signaling in AKI is highly complex. Almost 25 years ago, murine experiments featuring global, genetic IL-1R1 deletion convincingly demonstrated that IL-1R1 stimulation exacerbates persistent AKI after ischemia.6 Nevertheless, pharmacological blockade of IL-1 signaling in preclinical rodent studies has yielded inconsistent results in reducing ischemic, septic, or toxic AKI.6–9 Moreover, in patients with CKD, inhibition of IL-1β reduced major cardiovascular event rates, but did not preserve renal function.10 One possible reason for the discrepant outcomes of IL-1R1 receptor antagonism compared with genetic deficiency is that stimulating IL-1R1 on different cell lineages may yield variable effects on kidney damage.11 In the current studies, we use conditional gene targeting approaches in mice to decipher mechanisms through which IL-1R1 signaling in intrinsic kidney cell lineages affects toxic AKI.
Because aristolochic acid (AA) exposure underpins multiple human syndromes of toxic kidney damage, we used acute AA injury (AAI) in mice to study the cell-specific actions of IL-1R1 in toxic AKI. In its acute phase, AA is incorporated into proximal tubule (PT) cells and initiates renal injury.12 When our initial single-cell RNA sequencing (scRNA-seq) survey revealed widespread low basal expression of IL1-R1 in the kidney but greater induction of IL-1R1 in the distal nephron and kidney endothelium during AAI than in infiltrating myeloid cells, we hypothesized that initial injury in PT cells propagates to surrounding cells such as the distal nephron and endothelial cells through IL-1R1 signaling. Therefore, we sought to investigate the effects of PT-specific (initial injury site) or endothelial-specific IL-1R1 deletion on toxic AKI in the AAI model. These experiments indicate that IL-1R1 signaling in the nephron and endothelium have divergent effects on the outcome of toxic AKI.
Methods
Animals
Il1r1 floxed mice (Jackson Laboratory, Stock No: 028398) were generated as described13 and backcrossed >6 generations onto the 129/SvEv background. We generated mice with specific deletion of IL-1R1 from epithelial cells in the PT and from endothelial cells by using the 129/SvEv Pepck-Cre and Tie-2-CreERT2 (Tek-Cre) mouse lines, respectively.14,15 To induce endothelial-specific deletion of IL-1R1 in adult animals, the Tek-Cre mice and controls were treated with tamoxifen as described.15 To map the distribution pattern of Cre recombinase expression in the kidney, mT/mG mice from the Jackson Laboratory (Bar Harbor, ME) were crossed with the Pepck-Cre and Tie-2-CreERT2 transgenic lines, respectively. Female and male mice aged 8–12 weeks were analyzed separately in the cisplatin experiments. In the AAI studies, male mice were randomly assigned to the AA or vehicle groups. Mice were housed and bred in the animal facilities at the Durham Veterans' Affairs Medical Center according to National Institutes of Health guidelines and had free access to standard rodent chow and water.
scRNA-Seq Methods
Kidney Digestion and Cell Isolation
Our scRNA-seq cell isolation protocol has been previously described.16 Kidney digest was performed with liberase TM (0.3 mg/ml, Roche, Basel, Switzerland, 291963), hyaluronidase (10 mg/ml, Sigma, H4272), and DNaseI (20 mg/ml) at 37°C for 20 minutes. After centrifugation, cell pellets were incubated with ammonium-chloride-potassium lysing buffer (ThermoFisher A1049201) and again centrifuged. Pellets were incubated with 0.25% trypsin EDTA at 37°C for 10 minutes with shaking at 100 rpm in bacterial shaker. Trypsin was inactivated using 10% fetal bovine serum in PBS. Cells were then washed and resuspended in Dulbecco's phosphate-buffered saline supplemented with 0.04% bovine serum albumin. After filtration through a 30 μm strainer, cells were loaded into the 10× Chromium System (10× Genomics) at 1000 cells/ml by the Duke Human Vaccine Institute Sequencing Core. Our protocol yielded high viability and very few doublets, enabling us to avoid the use of flow cytometry–based cell sorting. For the pilot scRNA-seq study, the sham condition used both kidneys from one mouse, and the AA-challenged condition combined three kidneys from three AA-challenged mice to minimize potential biological and technical variability of the model. For scRNA-seq study comparing kidneys from AA-treated wild-type (WT) and IL-1R1 proximal tubular knockout (PKO) mice, we similarly combined three kidneys from three mice per experimental group. After library preparation, samples were sequenced on a Novaseq 6000 (Illumina) S2 flow cell by the Duke Center for Genomic and Computational Biology Sequencing Core. Cell Ranger software from 10× Genomics was used to transform raw base call files into FASTQ files (cellranger mkfastq) and align reads with reference mouse genome (cellranger count).
Quality Control and Filtering
Gene expression matrices generated separately by the CellRanger pipeline for each of the two samples were merged together into a single matrix. We used the quickPerCellQC function from the R package scater1 v1.18.0 to define thresholds for identifying low-quality cells based on quality control metrics (unique molecular identifier count, number of genes detected, percentage of unique molecular identifiers that mapped to the mitochondrial genome). To exclude low-quality cells, we kept all genes expressed in more than three cells and cells with at least 200 detected genes. Cells with unique gene counts >4000 or <200 were discarded. We also filtered out cells for which the percent of mitochondrial gene expression represented more than 55% of the total gene expression.
Normalization, Sample Integration, and Clustering
We used the R package Seurat v4.0.0 standard workflow for integration of multiple samples to combine the two samples into a unique dataset before clustering and visualization. Before integration, gene expression was normalized for each sample by scaling by the total number of transcripts, multiplying by 10,000, and then log transforming (log normalization). We then identified the 2000 genes that were most variable across each sample. Next, we identified anchor genes between samples using the FindIntegrationAnchors function that were used as a basis for Seurat to perform the integration of the two samples. We scaled the integrated data before running a principal component (PC) analysis. We then used the shared nearest neighbor modularity optimization-based clustering algorithm implemented in Seurat for identifying clusters of cells. This was performed using the FindNeighbors function with 50 PCs, followed by the FindClusters function with the Louvain algorithm using a 0.1 resolution. This allowed us to assign cells into a total of 14 clusters for the WT versus PKO comparisons. We applied the uniform manifold approximation and projection (UMAP) method on the cell loadings of the previously selected 50 PCs to visualize the cells in two dimensions.
Unsupervised Clustering of the scRNA-Seq Datasets and Cell-Type Annotation
Before clustering, variants arising from library size and percentage of mitochondrial and ribosomal genes were regressed out by specifying the vars.to.regress argument in Seurat function ScaleData. The highly variable genes were identified using the function FindVariableGenes. The expression level of highly variable genes in the cells was scaled and centered along each gene and was conducted to principal component analysis. We then assessed the number of PCs to be included in downstream analysis by (1) plotting the cumulative standard deviations accounted for by each PC using the function PCElbowPlot in Seurat to identify the knee point at a PC number after which successive PCs explain diminishing degrees of variance and (2) by exploring primary sources of heterogeneity in the datasets using the PCHeatmap function in Seurat. Based on these two methods, we selected top significant PCs for UMAP, implemented by the Seurat software with the default parameters. We used FindCluster in Seurat to identify cell clusters for each protocol. To identify the marker genes, differential expression analysis was performed by the function FindAllMarkers in Seurat with the Wilcoxon rank-sum test. Differentially expressed genes that were expressed in at least 25% of cells within the cluster and with a fold change more than 0.25 (log scale) were included for the subsequent analyses. Known markers of cells present in the mouse kidneys were used to assign corresponding cell types for each cluster (e.g., Nphs1 for podocyte, Emcn for endothelial cells, Slc34a1 for proximal tubular cells, etc.).17–19
Gene Set Enrichment Analysis
Differentially expressed genes (DEGs) analyses (PKO with AA versus WT with AA) were performed using the function FindMarkers implemented in the Seurat package with the Wilcoxon rank-sum test. Gene Ontology (GO)20 functional enrichment of DEGs at P < 0.05 was analyzed using an R package clusterProfiler v3.19.0. Gene set enrichment analysis (GSEA)21 was performed with clusterProfiler which supports statistical analysis and visualization of functional profiles for genes and gene clusters. In GSEA analysis, GO gene sets in MSigDB22 were used for annotation. Gene set size filters were set at a minimum of 10 and maximum of 500. Significantly enriched gene sets were defined as gene sets with a normalized enrichment score >1 and false discovery rate <0.05.
Extracting Data from Online Kidney Precision Medicine Project Database
The results of Supplemental Figure 1 here are in whole or part based on data generated by Kidney Precision Medicine Project (https://atlas.kpmp.org/explorer): DK133081, DK133091, DK133092, DK133093, DK133095, DK1330971, DK114866, DK114908, DK133090, DK133113, DK133766, DK133768, DK114907, DK114920, DK114923, DK114933, DK114886. https://www.kpmp.org.
Histological Analysis and Immunohistochemistry Staining
Mouse kidney samples were fixed in 10% formalin (Sigma-Aldrich) overnight and embedded in paraffin. Paraffin sections were stained by the periodic acid–Schiff reagent, and the histologic changes were assessed by light microscopy. Renal damage, including necrotic tubules, loss of brush borders, tubule dilation, cast formation, tubular epithelial swelling, and vacuolar degeneration, was semiquantitatively scored. A score of zero represents an injury area <5%, whereas one, two, three, four, and five connote damage involving 5%–20%, 21%–40%, 41%–60%, 61%–80%, and >81% of the whole kidney area, respectively. The investigator, who was masked to experimental conditions, assessed injury percentage of at least ten random fields under the microscope (original magnification, ×200), and a score was calculated for each mouse. To visualize endothelial cells, sections were stained with anti-CD31 (AF3628, R&D).
Terminal Deoxynucleotidyl Transferase–Mediated Digoxigenin-Deoxyuridine Nick-End Labeling Staining
Terminal deoxynucleotidyl transferase-mediated deoxyuridine triphosphate (dUTP) nick-end labeling (TUNEL) staining was performed according to the manufacturer's instructions of the In Situ Cell Death Detection Kit, Fluorescein (Roche, Germany). TUNEL-positive cells in ten high-powered fields of each tissue section were quantified by a blinded observer.
Kidney Endothelial Cell Isolation
Kidney single-cell suspensions were prepared by mechanical and enzymatic digestion, as described previously.23 To achieve homogenization, kidneys underwent mechanical dissociation and enzymatic digestion. Cell suspensions were then filtered through 70- and 40-μm cell strainers. The resulting single cells were incubated with Fc Block for 20 minutes at 4°C. For endothelial cell isolation, single cells were stained with CD45, CD31, and 4′,6-diamidino-2-phenylindole and then subjected to fluorescent cell sorting. The gating strategy was as follows: first gate on single live cells and second gate on CD45+ versus CD31+ cells. CD31+CD45−, CD45+CD31−, and CD31−CD45− cells were isolated and analyzed for IL-1R1 surface protein expression or saved for RNA microarray and real-time PCR. The threshold for positive IL-1R1 surface expression was determined using a fluorescence minus one control with labeling for CD45 and CD31, but not IL-1R1.
AKI Models
AA-Induced AKI
Experimental mice were injected daily intraperitoneally (IP) with 4 mg/kg AA (cat: 313-67-7, sigma) for five consecutive injections to induce kidney injury. Mice were euthanized and euthanized 1 day later. For tissue harvest, blood was obtained using cardiac puncture, and renal tissues were sectioned and snap-frozen in liquid nitrogen or fixed in 10% formalin for histological analysis. BUN levels were measured in individual samples using the Urea Nitrogen Colorimetric Detection Kit (EIABUN; Invitrogen). Serum creatinine was measured using an Automated Blood Chemical Analyzer Vitro 350. In a separate time-course experiment, blood or kidneys were collected from WT and PKO mice for analysis at 3 days (called day 8) and 7 days (called day 12) after the fifth AA injection. Tie2-CreERT2 Il1r1flox/flox (TKO) male mice and control littermates were injected IP with tamoxifen (T5648; Sigma-Aldrich) at 100 mg/kg for five consecutive days; 1 week after the last injection, the mice were subjected to AA treatment as described above.
Cisplatin-Induced AKI
Experimental mice were injected IP with 20 mg/kg (male) or 30 mg/kg (female) cisplatin (Sigma 479306) to induce kidney injury. After 72 hours, the injured kidneys and blood were harvested for analysis.
RNA Isolation and PCR Analysis
Total RNA was isolated from cells or tissue using the RNeasy mini kit (Qiagen, Valencia, CA) according to the manufacturer's instructions. cDNA was synthesized using the SuperScript II First-Strand Synthesis kit (Invitrogen, Carlsbad, CA). Real-time PCR was performed using cDNA with SYBR or Taqman primers. Glyceraldehyde-3-phosphate dehydrogenase was measured as a housekeeping gene. The relative amount of mRNA to glyceraldehyde-3-phosphate dehydrogenase was calculated using the following equation: 2ΔCT, in which ΔCT=CT gene−CTGAPDH. Total RNA of sorted CD31+CD45− cells from WT and TKO kidneys was extracted with the RNeasy micro kit (Qiagen, Valencia, CA) and quantified by the NanoDrop Spectrophotometer (NanoDrop Technologies). First-strand cDNA was synthesized using a RT2 first-strand kit (SABiosciences, Frederick, MD) according to the manufacturer's instructions.
Apolipoprotein M/Sphingosine-1-Phosphate Activator and VEGF120 Recombinant Protein Treatment Experiments
PKO and WT mice received FTY720 (cat: SML0700, Sigma) at a dose of 0.5 mg/kg per day through IP injection or recombinant Apolipoprotein M (Apom) dissolved in PBS (catalog: OPCA05213, Aviva) at a dose of 100 ug/kg per day using tail vein injection for the duration of the experiment.24,25 Mice were euthanized 1 day after last AA injection, and the injured kidneys and blood were harvested for analysis. TKO and WT mice received VEGF120 (cat: 580902, biolegend) at a dose of 25 µg/kg per day using tail vein (intravenous) injection for the duration of the experiment.26 Mice were euthanized 1 day after last the AA injection, and the injured kidneys and blood were harvested for further analysis.
Cell Culture Assays
The human kidney epithelial cell line (HK2) was obtained from American Type Culture Collection. Cells were cultured in Dulbecco's modified Eagle medium—F12 medium supplemented with 10% fetal bovine serum. Cells were seeded on six well-culture plates and then were transitioned to serum-free media for 16 hours after reaching 80% confluence in complete media. SEW2871 and AA were added to the serum-free medium at indicated concentrations for 12 or 24 hours. Then, cells were harvested for analysis of cleaved-caspase 3 protein levels, real-time PCR, and TUNEL analysis. In some experiments, HK2 cells were treated with human recombinant IL-1β (R&D, cat.: 201-LB) as indicated. Separately, human umbilical vein endothelial cells were grown to confluence on plates precoated with 2% gelatin and treated with IL-1β as indicated. Cells were then harvested for further analysis.
Western Blot
Kidney tissues (20 mg) were homogenized in radioimmunoprecipitation assay buffer (Sigma-Aldrich). Concentrations of protein were quantitated using the DC Protein Assay kit (Bio-Rad Laboratories, Hercules, CA). Equal amounts of sample were subjected to electrophoresis through 4%–12% Bis-Tris gels and then transferred to polyvinylidene difluoride membranes. After blocking with 5% milk in Tris-buffered saline solution with Tween 20, the blots were incubated with cleaved-caspase 3 antibody (cat: 9664; Cell Signaling Technology) or anti-glyceraldehyde-3-phosphate dehydrogenase (cat: 2118; Cell Signaling Technology) overnight in 4°C. The blots were then washed and incubated for 1 hour, at room temperature, with individual secondary antibodies accordingly. Bands were detected using an enhanced chemiluminescence detection system (Bio-Rad). The detected bands were quantified by densitometry through ImageJ 1.38 for Windows.
Statistical Analyses
The values of each parameter within a group are expressed as the mean±SEM. For comparisons between groups with normally distributed data, statistical significance was assessed using the two-tailed, unpaired t test. For comparisons between groups with non-normally distributed variables, we used the Wilcoxon test.
Results
Generation of Mice with Deletion of IL1R1 on Proximal Tubular Cells.
In the human Kidney Precision Medicine Project database of single nuclei RNA sequencing of injured human kidneys (https://atlas.kpmp.org/explorer/dataviz), we noted progressive induction of the gene encoding IL-1R1 in the damaged parts of the PT and the loop of Henle during AKI and the transition to CKD, with persistent expression of IL-1R1 in the renal endothelium. These changes mirrored those of the Havcr1 gene encoding the injury marker kidney injury molecule-1 (KIM-1) and the gene encoding the damaged and dedifferentiated PT marker vascular cell adhesion molecule-1 (Supplemental Figure 1A). Moving from AKI to the CKD settings, genes on the IL-1R signaling pathway including RelA (p65), Myd88, and Mapk1 (p38) were further induced in the damaged PT and loop of Henle (Supplemental Figure 1B). These data suggested to us that IL-1R1 signaling in the nephron during injury may be important for determining AKI outcomes.
To determine the changes in renal expression of IL-1 signaling components during toxin-induced AKI, we subjected male WT mice to five consecutive daily AA or vehicle injections and on the sixth day harvested the kidney to conduct a pilot, scRNA-seq analysis on single-cell digests (Figure 1A). After quality assessment, filtering, and normalization, a total of 18,898 cells from mice in the vehicle and AA groups were analyzed. After clustering at a lower resolution for major kidney cell types including tubule, endothelium, macrophage/monocyte, neutrophil, lymphocyte, and podocyte, we noted that Il1r1 was mainly expressed in nonimmune cell lineages—the tubule and endothelium clusters (Figure 1B). Lists of DEGs in the tubule and endothelial cell clusters are shown in Supplemental Table 1 and Supplemental Table 2. GSEA of the tubular cell cluster from AA-treated cohort revealed upregulation of the IL-1 signaling and IL-1 Family pathways as well as several signaling pathways downstream of IL-1R1 activation including nuclear factor-κB, TRAF6-NFκB activation, Myd88, and p38/MAP kinase. IL-1 signaling is known to regulate VEGFA transcription,27 and in our analysis, the endothelial cluster from the AA-treated cohort featured induction of the vascular endothelial growth factor (VEGF) and VEGF receptor 2 (VEGFR2) pathways (Supplemental Figure 2, A and B). Il1r1 was expressed at lower levels in infiltrating immune cells such as macrophage/monocytes and neutrophils during AA-induced AKI (Figure 1B). By contrast, the IL1b gene encoding IL-1β was primarily expressed by macrophage/monocyte and neutrophil clusters with weaker expression in the tubule and endothelium clusters (Figure 1B). In a separate time-course experiment, RT-PCR quantitation demonstrated upregulation of Il1b and Il1r1 in whole kidney at day 6 of AA-induced injury that persisted through day 12 (Supplemental Figure 3, A and B), suggesting that IL-1R1 signaling is engaged early and steadily during the disease process. More detailed cluster analysis at day 6 of AA-induced injury revealed low-level Il1r1 expression within several nephron segments and significant enrichment of IL-1R1 signaling pathways within the PT cluster (Supplemental Figure 4). Because AA initially targets the proximal tubular epithelial cell (PTEC), we posited that IL-1 signaling through activation of IL-1R1 on PTECs or renal endothelial cells may significantly contribute to toxin-induced acute tubular injury.
Figure 1.

IL1R1 in the nephron aggravates AA-induced AKI. (A) Integrated single-cell transcriptome map of kidneys from vehicle and AA-treated mice. (B) Dot plot of scRNA-seq analyses showing the IL1β and IL1R1 expression in multiple cell lineages from kidneys of vehicle and AA-treated animals. (C) Strategy for AA-induced PTEC injury. (D) Representative images of kidney sections from male IL1R1flox/flox Pepck-Cre− (WT) and IL1R1flox/flox Pepck-Cre+ (PKO) mice 6 days after first AA injection. Scale bar, 100 μm. (E) WT and PKO kidney pathology scores. (F) BUN. (G) Serum creatinine. (H) Renal mRNA expression of lipocalin2 encoding NGAL. n≥11. Data represent the mean±SEM. *P < 0.05. AA, aristolochic acid; CTL, control; NGAL, neutrophil gelatinase–associated lipocalin; PAS, periodic acid–Schiff; PKO, proximal tubular knockout; PTEC, proximal tubular epithelial cell; scRNA-seq, single-cell RNA sequencing; WT, wild type.
To test the function of IL-1R1 signals in kidney tubular cells during AKI, we ablated IL1R1 on PTECs using a Cre-Lox gene targeting approach. First, we bred a Pepck-Cre mouse line28 with a double-fluorescence reporter mouse (mT/mG) to observe the Cre recombinase efficiency in PTECs. We detected robust Cre-mediated recombination marked by green fluorescent protein within the kidney cortex of PEPCK-Cre+ mT/mG mice but the relative absence of Cre expression marked by red fluorescent protein in kidney medulla (Supplemental Figure 5A). We therefore bred the Pepck-Cre mouse line with an IL1r1 flox line harboring loxp sites on either side of the coding region for the Il1r1 gene (Supplemental Figure 5B). For our experiments, we used Pepck-Cre+ Il1r1flox/flox mice (PKO, Supplemental Figure 5C, lane 1) and Pepck-Cre− Il1r1flox/flox (WT, Supplemental Figure 5C, lane 4) littermates. To confirm tubular cell deletion of IL-1R1 in our IL-1R1-PKO animals, we isolated kidney cortex and measured mRNA levels for IL-1R1, cadherin 16, and aquaporin 1 from cortex tissues. Compared with WT littermates, PKO mice exhibited >50% deletion of IL-1R1 from cortical tissues but preserved levels for cadherin 16 and aquaporin 1 (Supplemental Figure 5D). By contrast, the PKO animals had preserved IL1r1 expression in the lung, liver, and heart versus WT controls (Supplemental Figure 5E).
Deletion of IL-1R1 in Proximal Tubular Cells Attenuates Toxin-Induced AKI
To ascertain the role of IL-1R1 on initial PTEC injury and subsequent AKI progression, we subjected littermate male WT and PKO mice to AA-induced (4 mg/kg) AKI (Figure 1C). One day after the last injection, all mice had marked renal tubular injury. However, the PKO kidneys showed relative preservation of kidney structure as confirmed by blinded injury scores (3.6±0.3 versus 2.6±0.3; P < 0.05; Figure 1, D and E). IL-1R1 PKO mice had lower BUN and serum creatinine levels compared with WTs (Figure 1, F and G). Renal mRNA levels for lipocalin2 that encodes neutrophil gelatinase–associated lipocalin (NGAL) were significantly lower in AA-treated PKO mice compared with WT controls (Figure 1H), suggesting that PT inhibition of IL1R signaling prevented subsequent distal tubule damage. In a time-course study, the PKO cohort also had lower BUN and serum creatinine levels at days 8 and 12 after the first AA injection and attenuated renal pathology scores at day 12 of AA-induced injury (Supplemental Figure 6, A–D).
To confirm these findings in a separate model of AKI that features PTEC damage, WT and PKO animals were subjected to acute cisplatin nephropathy. At day 3 after cisplatin injection, we measured survival in female mice and renal injury in male mice. Compared with WTs, PKO mice had a survival advantage (Figure 2A). PKO mice had significantly less tubular damage and lower BUNs and creatinines than WTs (Figure 2, B–E). Kidneys from cisplatin-treated PKO animals expressed lower mRNA levels for lipocalin2/NGAL (Figure 2F). Because male and female PKO animals both showed evidence of renoprotection, the remainder of our studies were conducted in male mice.
Figure 2.
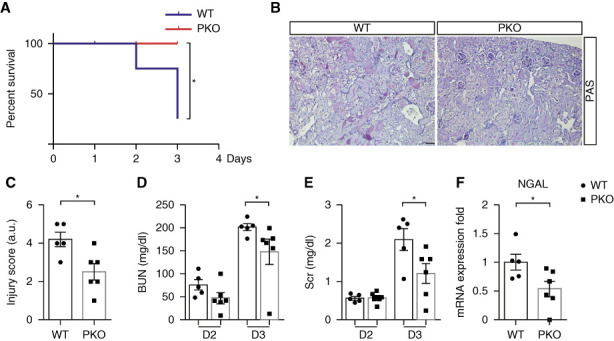
Deficiency of IL1R1 in the nephron protects against cisplatin-induced AKI. (A) Female WT and PKO mice were injected with 30 mg/kg cisplatin, at 3 days after cisplatin; survival was determined (significance determined by the Mantel–Cox log-rank test). (B) Representative images of kidney sections from male IL1R1flox/flox Pepck-Cre− (WT) and IL1R1flox/flox Pepck-Cre+ (PKO) mice 3 days after 20 mg/kg cisplatin injection. Scale bar, 100 μm. (C) WT and PKO kidney pathology scores. (D) BUN. (E) Serum creatinine. n=5–6. (F) Renal mRNA expression of lipocalin2 encoding NGAL. Data represent the mean±SEM. *P < 0.05. D2, day 2; D3, day 3; NGAL, neutrophil gelatinase–associated lipocalin; PAS, periodic acid–Schiff; PKO, proximal tubular knockout; WT, wild type.
Deletion of IL-1R1 in proximal tubular cells does not affect the expression of inflammatory mediators in kidney during toxin-induced injury.
We then quantitated renal mRNA expression for CCL2, macrophage migration inhibitory factor, CXCL1, CXCL2, IL1β, IL-6, TNF-α, and IFN-γ in WT and PKO kidneys after an AA or cisplatin challenge. No differences were detected between groups either in the AA or cisplatin models (Supplemental Figures 7 and 8).
IL-1R1 Activation Suppresses Apom Generation to Augment AA-Induced AKI.
To identify cellular mechanisms through which IL-1R1 activation on proximal tubular cells propagates AA-induced injury, we generated a single-cell transcriptome map of kidneys after AA exposure. Kidneys from three mice in both the WT and PKO groups were harvested 1 day after five consecutive daily AA injections. High-quality transcriptome data were compiled from a total of 26,961 cells in injured kidneys using an integration algorithm that normalizes and filters data using published protocols. We then performed unsupervised clustering analysis of this integrated dataset at a resolution that identified renal tubular segments and immune cell types. UMAP displayed these 14 separate clusters. The cellular identity of each cluster was determined based on known cell type–specific markers (Figure 3, A and B). We then analyzed cells from the mature PT cells and damage-associated dedifferentiated PT cell clusters, which are characterized by high expression of injury-induced genes and reduced expression of mature PT marker genes (PT and damage-associated PT in Figure 3A). We identified 463 DEGs between groups, 260 of which were upregulated and 203 of which were downregulated in the PKOs (Figure 3C, Supplemental Table 3). We then conducted GO enrichment analysis of these DEGs and noted two recurring themes among the signaling cascades regulated by these DEGs in PTs: fatty acid metabolic processes and regulation of epithelial cell proliferation versus apoptotic processes (Figure 3D). We then separately examined differentially expressed pathways using GSEA comparing the PKO and WT groups to further investigate the functional alterations correlated with IL-1R1 deficiency on the PT during AA-induced injury. Here again, GSEA revealed preserved biological processes in the cellular response to lipid metabolism and cellular catabolism within the PTs of the PKO group (Figure 3, E and F).
Figure 3.

scRNA-seq identifies Apom as a candidate gene suppressed by IL-1R1 in proximal tubular cells after AA exposure. (A) Integrated single-cell transcriptome map from kidneys of WT and PKO mice after AA exposure. Unsupervised clustering identified 14 distinct clusters in the UMAP plot. The dotted area (PT cell clusters; PT and DA-PT) was used for the downstream analyses in C–F. (B) Dot plot shows the gene expression patterns of cluster-enriched canonical markers. (C) Volcano plot of gene expression changes in PT cell clusters of PKO compared with WT groups. (D) GO functional analysis of PT cell clusters (PT and DA-PT) from A. (E and F) The significantly enriched GO biological processes in GSEA: the cellular response to lipid, with enrichment score of 0.49 and P = 0.002 (E) and positive regulation of cellular catabolic process, with enrichment score of 0.49 and P < 0.001 (F). (G) Expression of Apom mRNA levels from PT cell clusters presented by violin plots. (H) Verification of Apom mRNA levels from WT and PKO kidneys after AA exposure (n≥11). Data represent the mean±SEM. *P < 0.05. AA, aristolochic acid; Apom, apolipoprotein M; ATL+TAL, ascending thin limb and thick ascending limb of Henle loop; CNT, connecting tubule; DA-PT, damage-associated PT; DCT, distal tubule; DTL, descending thin limb of Henle loop; Endo, endothelial cell; FDR, false discovery rate; Fib, fibroblast; GO, gene ontology; GSEA, gene set enrichment analysis; IL-1R1, type 1 IL-1 receptor; Lymph, lymphocyte; NES, normalized enrichment score; Neu, neutrophil; PKO, proximal tubular knockout; Podo, podocyte; PT, proximal tubule; scRNA-seq, single-cell RNA sequencing; UMAP, uniform manifold approximation and projection; WT, wild type.
Because fatty acid oxidation is a preferred energy source in the PT that is inhibited during AKI,29–31 we next examined those DEGs that were significantly upregulated in the PKO PTs to see which might play key roles in lipid metabolism. As shown in the volcano plot, we noted induction of several genes including that encoding Apom (Figure 3C, Supplemental Table 3). By carrying sphingosine-1-phosphate (S1P), Apom serves a vital function in fatty acid and lipid transportation and metabolism.32,33 Moreover, S1P in the PT has demonstrated renoprotective functions in AKI.34 Violin plots from scRNA-seq data further illustrated differences in Apom expression between WT and PKO PTs (Figure 3G). RT-PCR showed similar baseline levels of renal Apom expression in naïve WT and PKO animals (Supplemental Figure 9), but confirmed the difference in renal Apom expression in a separate cohort of AA-treated WT and PKO animals (Figure 3H). Moreover, treatment of HK-2 human kidney epithelial cells in vitro with IL-1β suppressed Apom mRNA expression in a dose-dependent pattern at 6 hours (Supplemental Figure 10).
Apoptosis of damaged tubular cells is a critical pathogenic characteristic in AA-induced kidney injury. Because GO enrichment analysis (Figure 3D) and GSEA analysis suggested PKO PTs were resistant to cell apoptosis and death in AA-induced AKI (Figure 4A), we directly assessed apoptosis in injured WT and PKO kidneys. After AA injection, the number of TUNEL+ cells in the PKO kidneys was significantly lower than in WTs (Figure 4, B and C). In addition, western blot and semiquantitative analysis demonstrated that cleaved-caspase 3 protein was reduced in kidney tissues from PKO mice (Figure 4, D and E).
Figure 4.
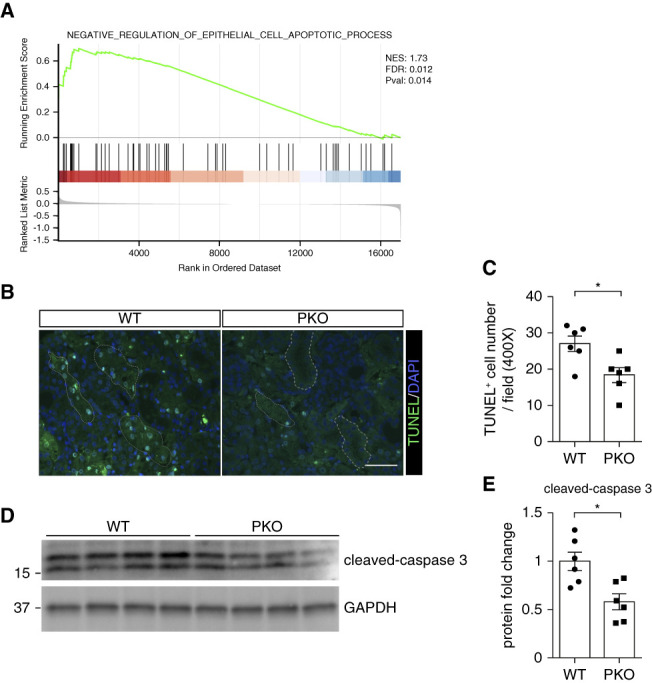
Tubular IL-1R1 deficiency attenuates cell death and apoptosis. (A) In GSEA, the negative regulation of epithelial cell apoptotic process is significantly enriched, with an enrichment score of 0.70 and P = 0.014. (B) Representative images of TUNEL staining in kidney sections from male WT and PKO mice with AA nephropathy with broken lines encircling tubular cells. (C) Semiquantification of TUNEL-positive cells per high-powered field. Scale bar, 100 μm. (D) Western blots for cleaved-caspase 3 from whole kidney tissue of WT and PKO mice with acute AA nephropathy. (E) Semiquantitative analysis for cleaved-caspase 3 from (D). n=6. Data represent the mean±SEM. *P < 0.05. AA, aristolochic acid; FDR, false discovery rate; GAPDH, glyceraldehyde-3-phosphate dehydrogenase; GSEA, gene set enrichment analysis; IL-1R1, type 1 IL-1 receptor; NES, normalized enrichment score; PKO, proximal tubular knockout; TUNEL, terminal deoxynucleotidyl transferase deoxyuridine triphosphate nick-end labeling. WT, wild type.
To further confirm the benefit of Apom/S1P signaling activation in AA-induced PTEC injury, FTY720, an Apom/S1P signaling activator,35,36 was injected IP into WT and PKO mice daily starting with the first AA treatment. periodic acid–Schiff stains of kidney tissue indicated that FTY720 attenuated AKI induced by AA and abrogated the differences in kidney damage between the WT and PKO groups (Figure 5, A and B). Levels of BUN and renal mRNA expression for genes encoding NGAL and KIM-1 were lower in WTs with FTY720 than with vehicle treatment and were similar in FTY720-treated WT and PKO cohorts (Figure 5, C–E). By contrast, renal mRNA expression levels for the genes encoding CCL2, IL-6, TNF-α, and IFN-γ were not altered by FTY720 treatment in the WT groups, and these cytokines were similarly expressed in the FTY720-treated WT and PKO groups (Supplemental Figure 11, A–D).
Figure 5.

Targeting Apom/S1P with FTY720 improves kidney injury and abrogates differences in injury between WT and PKO kidneys after AA challenge. (A) Kidney histology from the groups as shown by PAS staining. Scale bar, 100 μm. (B) Kidney pathology scores. (C) BUN. (D–E) Renal mRNA expression of lipocalin2 encoding NGAL (D) and havcr1 encoding KIM-1 (E). n≥6. Data represent the mean±SEM. *P < 0.05. AA, aristolochic acid; Apom, apolipoprotein M; KIM-1, kidney injury molecule-1; NGAL, neutrophil gelatinase–associated lipocalin; PAS, periodic acid–Schiff; PKO, proximal tubular knockout; S1P, sphingosine-1-phosphate; WT, wild type.
As a direct test of the protective capacity of Apom in our model, we treated WT animals with recombinant Apom or vehicle during AA-induced AKI. Treatment with Apom reduced blinded kidney injury scores, BUN, Cr, and renal mRNA for NGAL and KIM-1 (Supplemental Figure 12, A–F). Among the S1P receptors, S1P receptor 1 (S1PR1) is the most highly expressed in the kidney and mediates beneficial effects of S1P during AKI.37 In our hands, treatment of HK-2 human kidney epithelial cells with the selective S1PR1 agonist SEW2871 attenuated the AA-induced upregulation of mRNAs for kidney injury markers NGAL and KIM-1, protein levels of apoptosis marker cleaved-caspase 3, and TUNEL staining (Supplemental Figure 13, A–D). FTY720 treatment did not affect renal mRNA expression for S1PR1 in vivo (Supplemental Figure 11E). However, we cannot exclude an effect of FTY720 on cellular trafficking of S1PR1.
Endothelial Cell–Specific Deletion of IL-1R1 Exaggerates AA-Induced AKI
We next explored whether IL-1R1 in endothelial cells affects the susceptibility to acute AA-induced renal damage. By breeding a Tie2-CreERT2 mouse line with a double-fluorescence reporter mouse (mT/mG), we confirmed robust Cre-mediated recombination, which was marked by green fluorescent protein within the peritubular and vascular areas in mT/mG kidneys (Figure 6A). To test the role of IL-1R1 activation in the endothelium after AA exposure, we generated Tie2-CreERT2+ Il1r1flox/flox mice with selective deletion of IL-1R1 in endothelial cells (TKO) (Figure 6B). Compared with Tie2-CreERT2− Il1r1flox/flox (WT) controls, CD31+CD45− endothelial cells sorted from TKO kidneys showed approximately 60% reduction in Il1r1 mRNA (Figure 6, C and D). We also found that levels of Il1r1 mRNA expression in WT endothelial cells were higher compared with CD31−CD45+ and CD31−CD45− WT cells, indicating IL-1 signaling may have an important role in endothelial cell function (Figure 6D). Separately, Ilr1 mRNA expression was preserved in cultured renal tubular cells from TKO mice compared with WT controls (Supplemental Figure 14A). At the protein level, FACS analysis detected surface expression of IL-1R1 on 6% of WT sorted CD31+CD45− renal endothelial cells in naïve animals with minimal detection of IL-1R1 on sorted TKO renal endothelial cells (Supplemental Figure 14, B–D). By contrast, IL-1R1 surface expression was preserved on small percentages of TKO CD31−CD45+ immune cells versus WT controls (Supplemental Figure 14, E and F). To our surprise, after our AA-induced injury protocol (Figure 6E), kidney pathology was more severe in IL-1R1 TKO mice compared with WTs (Figure 6, F and G). Similarly, the TKO cohort developed more severe kidney dysfunction and damage as exhibited by higher levels of BUN, creatinine, and renal lipocalin2/NGAL mRNA (Figure 6, H–J). This pattern of exaggerated renal injury in the TKO cohort was recapitulated in male mice subjected to cisplatin nephrotoxicity (Supplemental Figure 15, A–E).
Figure 6.

IL-1R1 activation on endothelial cells attenuates AA-induced nephrotoxicity. (A) Representative sections of normal kidneys from mT/mG and Tie2-CreERT2+ mT/mG reporter mice in which Tie2-expressing endothelial cells fluoresce green and all other tissues fluoresce red. Scale bar, 50 μm. (B) Genotyping the mice by PCR analysis of genomic DNA. (C) Representative blots for sorting CD31+CD45− endothelial cells from kidneys of WT and TKO mice 7 days after their last tamoxifen injection. (D) mRNA levels of il1r1 in CD31+CD45−, CD31−CD45+, and CD31−CD45− cells (n=5). (E) Protocol for injection of tamoxifen and AA. (F) Representative images of kidney sections from male IL1R1flox/flox Tie2-CreERT2− (WT) and IL1R1flox/flox Tie2-CreERT2+ (TKO) mice 6 days after first AA injection. Scale bar, 100 μm. (G) Kidney pathology scores. (H) BUN. (I) Serum creatinine (Scr). (J) Renal mRNA expression of lipocalin2 encoding NGAL. n≥8. Data represent the mean±SEM. *P < 0.05. AA, aristolochic acid; IL-1R1, type 1 IL-1 receptor; NGAL, neutrophil gelatinase–associated lipocalin; PAS, periodic acid–Schiff; WT, wild type.
IL-1 Signaling Drives Vascular Endothelial Growth Factor A (VEGFA) Expression in Endothelial Cells during AA-Mediated AKI
To discern divergent gene expression programs in the kidney endothelial cells of WT versus TKO mice exposed to AA, we used a functional profiling qPCR array strategy, comparing mRNA levels for a broad panel of genes in CD31+CD45− endothelial cells sorted from WT and TKO kidneys. Among the detected genes, VEGFA was the most prominently downregulated in the TKO cohort (Figure 7A). TKO renal endothelial cells had approximately 50% less VEGFA expression as confirmed separately by real time quantitative PCR analysis (Figure 7B). By contrast, mRNA levels for VEGFC and VEGFA's receptor, VEGFR2, showed no differences between the groups (Figure 7, C and D). Inversely, the in vitro expression of VEGFA in human umbilical vein endothelial cells was significantly elevated by IL-1β treatment after 1 hour (Figure 7E). VEGFA preserves endothelial cell viability and promotes angiogenesis through VEGFR2 during tissue inflammation.38,39 After AA exposure, TKO kidneys showed reduced immunofluorescent staining for CD31 compared with WTs (Figure 7, F and G), consistent with decreased endothelial cell density.
Figure 7.

IL1R1 stimulation on endothelial cells limits vascular rarefaction through preserved Vascular Endothelial Growth Factor A (VEGFA) expression in AA-induced nephrotoxicity. (A) Expression of functionally relevant mRNAs in endothelial cells sorted from kidneys of male WT and TKO mice after AA exposure, reflected by heat map from qPCR array. (B–D) The VEGFA (B), VEGFC (C), and VEGFR2 (D) mRNA expression levels in sorted CD31+CD45− endothelial cells from same WT and TKO kidneys in separate qPCR (n=3). (E) mRNA expression for VEGFA in HUVECs treated with or without IL1β (50 ng/ml) for 1 and 6 hours (n=3). (F) Representative sections of CD31-stained kidneys from AA-treated WT and TKO animals. Scale bar, 100 μm. (G) Quantitative determination of kidney CD31-positive area in AA-treated WT and TKO cohorts (n=7). Data represent the mean±SEM. *P < 0.05. AA, aristolochic acid; HUVEC, human umbilical vein endothelial cell; VEGF, vascular endothelial growth factor; VEGFR2, vascular endothelial growth factor receptor 2; WT, wild type.
We then examined gene expression at the whole kidney level for a broad panel of inflammatory mediators and endothelial functional markers in WT and TKO kidneys. mRNA levels for several cytokines and chemokines were similar in the two groups. Genes encoding vascular cell adhesion molecule-1, all three isoforms of nitric oxide synthase, VEGFC, and FGF2 also showed comparable expression in the groups (Supplemental Figure 16, A–I and K and L). By contrast, the levels of mRNA for VEGFA in TKO kidneys were significantly lower than in WT controls (Supplemental Figure 16J).
To determine whether IL-1R1 activation in endothelial cells limits toxic injury to the kidney by stimulating VEGFA generation, we treated WT and TKO mice with vehicle or VEGFA recombinant protein, VEGF120, during AA-induced AKI. As before, in the vehicle-treated groups, TKO mice showed more severe kidney injury than WTs (Figure 8, A and B). However, VEGF120 treatment afforded greater protection to IL-1R1 TKO mice than WTs, abrogating differences between the WTs and TKOs in blinded renal injury scores, BUN levels, serum creatinine, and immunofluorescent staining in the kidney for CD31 (Figure 8, A–F).
Figure 8.
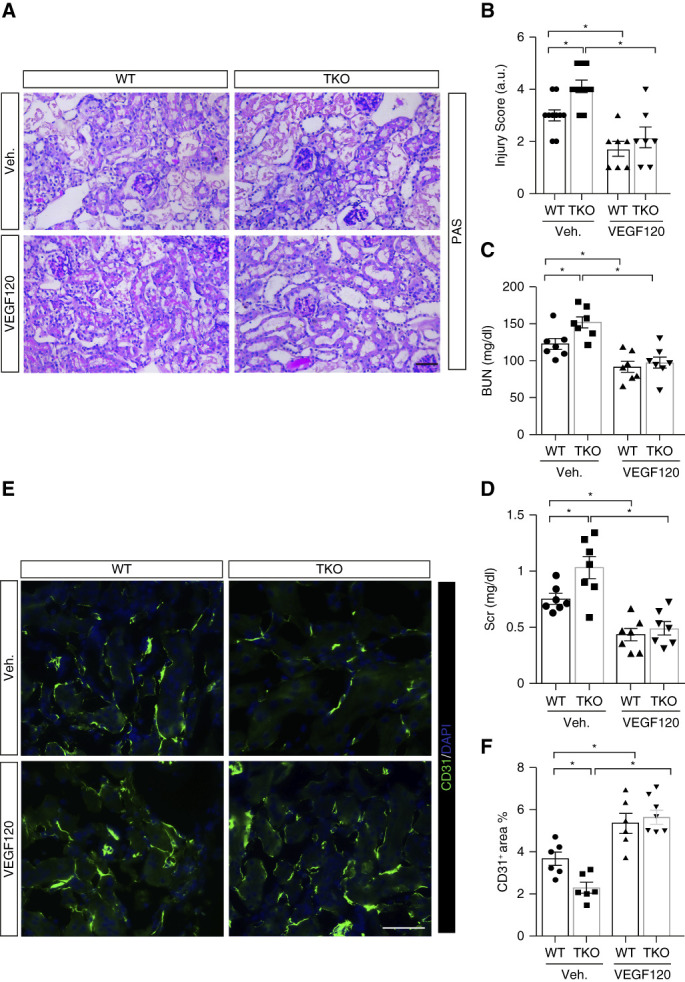
Effects of VEGF120 treatment on AA-induced kidney injury and function. (A) Representative kidney histology from male WT and TKO mice as shown by PAS staining. Scale bar, 100 μm. (B) Kidney pathology scores. (C) BUN. (D) Serum creatinine (Scr). (E) Representative sections of CD31-stained kidneys from indicated groups. Scale bar, 100 μm. (F) Quantitative determination of kidney CD31-positive area. n≥6. Data represent the mean±SEM. *P < 0.05. AA, aristolochic acid; PAS, periodic acid–Schiff; Veh., vehicle; WT, wild type.
Discussion
While IL-1 is a prototypical inflammatory cytokine that drives innate immune signaling cascades, activation of its receptor, IL-1R1, has pleiotropic functions that diverge across cell types.40,41 Thus, although global IL-1R1 deficiency clearly attenuates sustained ischemic AKI,6 the effects of IL-1R1 activation in different renal cell lineages during toxic AKI warrant scrutiny. In this study, we find that the effects on nephrotoxicity of IL-1R1 activation in the PT and endothelium are diametrically opposed, highlighting a need for cell type–specific manipulation of IL-1 signals to optimally contain toxic AKI.
Given the importance of the immune response in regulating acute kidney damage3 and the capacity of IL-1 to provoke inflammation during toxic AKI,5,42 we posited that activating IL-1R1 in the tubule or endothelium could affect injury to the PTEC through local effects on the inflammatory milieu within the kidney. However, when we abrogated IL-1R1 signals in the tubule or the endothelium during acute AA-induced renal damage, we detected no changes in renal mRNA levels for broad panels of inflammatory cytokines, suggesting that IL-1R1 on tubular or endothelial cells may not affect toxin-induced injury to the kidney by effects on inflammatory responses. Rather, we find that IL1R1 activation in the PT mediates cell injury and death in part by effects on lipid metabolism.
Mechanistically, IL-1R1 activation in the PT suppresses local Apom expression to reprogram cellular metabolism in acute AA-induced nephropathy. Apom, as an apolipoprotein, is expressed primarily in the liver and kidney and is downregulated by proinflammatory signals during injury and infection.43 In humans with sepsis, plasma Apom and S1P correlate inversely with disease severity.44 Proinflammatory transcription factors, c-Jun and JunB, bind to the proximal region of the Apom promoter to curtail its expression.45 Compared with WT controls, Apom-knockout mice exhibit abnormally severe mitochondrial damage and endoplasmic reticulum stress in the kidney, showing mitochondrial swelling, vacuolization, myeloid changes, and expansion of the rough endoplasmic reticulum, provoking kidney disease progression.46 Moreover, Apom deficiency permits induction of proapoptotic-related proteins and a decrease in antiapoptotic protein levels in the kidney.46 Finally, in clinical trials, plasma Apom levels are reduced in patients with CKD stages 3–5 compared with CKD stages 1–2,47 all pointing to a protective effective of Apom in renal injury. We find that IL-1R1 activation on proximal tubular cells inhibits Apom expression and fatty acid oxidation, with consequent tubular apoptosis and renal injury. Accordingly, restoring Apom/S1P signaling with FTY720 attenuates the exaggerated levels of toxin-induced kidney injury permitted by tubular IL-1R1 deficiency. Additional downstream mechanisms through which IL-1R1–mediated induction of tubular Apom protects the kidney will require future investigations. In adipocytes, IL-1R1–dependent recruitment of the IRAK2 myddosome suppresses mitochondrial oxidative phosphorylation and fatty acid oxidation, thereby attenuating energy expenditure and oxidative metabolism.48
In contrast to the injurious effects of tubular IL-1R1 in our studies, we find that IL-1R1 on endothelial cells mitigates AA-induced PTEC injury by augmenting local expression of the proangiogenesis factor VEGFA, thereby preserving endothelial cell density. Renal endothelial cell preservation is critical during AKI because vascular rarefaction permits progression of kidney damage.49,50 The inflammatory milieu affects angiogenesis,38,39 whereas conversely maintaining local endothelial function can limit renal inflammation during AKI.50 During ischemia–reperfusion, myeloid cells produce IL-1 that stimulates VEGF secretion by endothelial cells, facilitating angiogenesis.51 In tumors, IL-1 similarly induces angiogenesis allowing tumor growth and metastasis.52,53 Inversely, deficiency of IL-1α or IL-1β or administration of an IL-1R1 antagonist dramatically impairs blood vessel growth in tumors whereas treatment with recombinant IL-1 restores angiogenesis in the tumor.54 Our studies suggest that IL-1R1–mediated retention of renal vascular integrity protects the kidney during toxic injury.
On a molecular level, IL-1β selectively induces the expression of hypoxia-inducible factor-1β, a key transcription factor for VEGF.55 In addition to IL-1, other inflammatory factors such as IL-6, IL-33 can increase VEGF levels and angiogenesis.56,57 The angiogenic activity of IL-1 depends on signaling through VEGFR2.58 In our studies, IL-1R1 activation on the endothelium did not affect VEGFR2 levels. The upregulation of FasL on TKO endothelial cells in our PCR assay profile after AA exposure suggests that endothelial IL-1R1 activation may contribute to endothelial cell viability. Consistent with a favorable effect of IL-1R1–dependent VEGF generation in the endothelium, we find that supplementation of VEGFA protein attenuates kidney damage and abrogates differences in kidney injury and function between the WT and TKO cohorts after AA-induced PTEC injury. These findings are in accordance with those of Leonard et al. who reported renoprotective effects of injecting VEGF in kidney ischemia–reperfusion injury59 and highlight again the need for exquisite regulation of local VEGF levels to preserve development and architecture in multiple renal compartments.60
These protective actions of IL-1R1 in endothelial cells contrast starkly with the deleterious actions of IL-1R1 in intrinsic renal tubular cells. In previous reports, global IL-1R1 knockout mice exhibited diminished kidney injury after ischemia or cisplatin exposure.6,42 However, compared with genetic deletion, pharmacological blockade of IL-1's actions has yielded inconsistent results in reducing renal injury. For example, IL-1R1 blockade failed to attenuate murine ischemic AKI but mitigated renal tubular damage and apoptosis in a rat model of renal IRI.6,61 While the reasons for some discrepant effects of IL-1R1 receptor antagonism versus deficiency are unclear, our findings in this study offer one explanation that IL-1 signaling may exert cell lineage–specific opposing roles in acute renal damage.
In sum, the current studies elucidate divergent effects of IL-1R1 activation in the renal epithelium and endothelium on AKI after toxin exposure. These experiments illustrate complicated crosstalk involving inflammatory cytokines, renal tubular cells, and the endothelium during the evolution of renal disease. Whereas precise lipid-based delivery strategies still under development may ultimately allow selective tubular IL-1R1 inhibition62 or even endothelial IL-1R1 stimulation, in the shorter term targeting only those injurious pathways activated by IL-1 during AKI63 may represent an approach to maximize the protective effects of blocking IL-1R1 while mitigating unwanted off-target actions of IL-1R1 manipulation.
Supplementary Material
Acknowledgments
The authors would like to acknowledge the superlative husbandry work done by Cindy Chen in maintaining the animal colonies used in these studies.
Footnotes
See related editorial, “Targeting IL-1 Receptor Signaling in AKI,” on pages 1601–1603.
Disclosures
J.R. Privratsky reports employer: Private Diagnostic Clinic, PLLC and other interests or relationships: research support from NIGMS (K08-GM132689) and NIDDK (5R01-DK131065). M.J. Robson reports advisory or leadership role: DeltaChase, LLC. All remaining authors have nothing to disclose.
Funding
This work was supported by NIDDK grant R01 DK118019 and US Veterans Health Administration, Office of Research and Development, Biomedical Laboratory Research and Development grant BX000893 and Clinician Scientist Investigator Award to S.D. Crowley. This work was also supported by the National Natural Science Foundation of China (Grant 82100720) to J. Ren.
Author Contributions
Conceptualization: Steven D. Crowley.
Data curation: Koki Abe, Jamie R. Privratsky, Jiafa Ren, Tomokazu Souma.
Formal analysis: Steven D. Crowley, Xiaohan Lu, Jamie R. Privratsky, Jiafa Ren, Tomokazu Souma.
Funding acquisition: Steven D. Crowley.
Investigation: Steven D. Crowley, Xiaohan Lu, Jamie R. Privratsky, Jiafa Ren.
Methodology: Koki Abe, Randy D. Blakely, Steven D. Crowley, Kang Liu, Xiaohan Lu, Jamie R. Privratsky, Jiafa Ren, Matthew J. Robson, Tomokazu Souma, Lianqin Sun, Buyun Wu.
Project administration: Steven D. Crowley.
Resources: Steven D. Crowley, Huijuan Mao, Changying Xing.
Supervision: Steven D. Crowley.
Visualization: Steven D. Crowley, Jiafa Ren.
Writing – original draft: Jiafa Ren.
Writing – review & editing: Randy D. Blakely, Steven D. Crowley, Jamie R. Privratsky, Matthew J. Robson.
Data Sharing Statement
Data related to transcriptomic, proteomic, or metabolomic data (per previous question); original data created for the study are or will be available in a persistent repository on publication. The raw and processed scRNA-seq data generated in this study have been deposited in a persistent repository (https://gitlab.oit.duke.edu/jrp43/ren-crowley-pt-il1r-aki). The remaining data are available with the article or supplemental information.
Supplemental Material
This article contains the following supplemental material online at http://links.lww.com/JSN/E492, http://links.lww.com/JSN/E493, http://links.lww.com/JSN/E494, and http://links.lww.com/JSN/E495.
Supplemental Figure 1. Induction of IL-1R1 and its downstream signaling components in the damaged tubule and endothelium during AKI and the transition to CKD in human KPMP database.
Supplemental Figure 2. Multiple signaling pathways related to IL-1 and VEGF are upregulated in kidney epithelial and endothelial cells, respectively, after aristolochic acid (AA) exposure.
Supplemental Figure 3. Induction of IL-1b and IL1R1 in kidneys from mice after aristolochic acid (AA) exposure.
Supplemental Figure 4. Segmental expression of IL-1R1 and related signaling pathway in proximal tubule.
Supplemental Figure 5. Verification of IL1R1 deficiency in renal proximal tubular cells from PKO mice.
Supplemental Figure 6. IL1R1 in the nephron aggravates aristolochic acid (AA)–induced AKI at days 8 and 12.
Supplemental Figure 7. Chemokine and inflammatory cytokine expressions are similar in WT and PKO kidneys after AA challenge.
Supplemental Figure 8. Expressions of chemokines and inflammatory cytokines display no differences between WT and PKO kidneys after cisplatin exposure.
Supplemental Figure 9. Kidney Apom mRNA abundance from IL1R1flox/flox Pepck-Cre− (WT) and IL1R1flox/flox Pepck-Cre+ (PKO) mice.
Supplemental Figure 10. Apom mRNA expression in HK-2 human kidney epithelial cells is suppressed in vitro in a dose-dependent pattern after treatment with IL-1β.
Supplemental Figure 11. Expressions of chemokines and inflammatory cytokines display no differences after FTY720 treatment in the aristolochic acid model.
Supplemental Figure 12. Recombinant Apom protein supplementation attenuates aristolochic acid (AA)–induced AKI.
Supplemental Figure 13. Specific activation of S1PR1 with SEW2871 ameliorates tubular epithelial cell injury and apoptosis induced by aristolochic acid (AA) in vitro.
Supplemental Figure 14. Verification of IL1R1 deficiency in endothelial cells from TKO kidney.
Supplemental Figure 15. Deficiency of IL1R1 in the endothelium aggravates cisplatin-induced AKI.
Supplemental Figure 16. Renal mRNA expressions for inflammatory mediators and endothelial functional markers in WT and TKO animals after AA-induced AKI.
Supplemental Table 1. Differentially expressed genes in kidney tubule cluster from vehicle- versus aristolochic acid-treated wild-type mice.
Supplemental Table 2. Differentially expressed genes in kidney endothelial cell cluster from vehicle- versus aristolochic acid-treated wild-type mice.
Supplemental Table 3. Differentially expressed genes in proximal tubule and damaged proximal tubule cell clusters from aristolochic acid-treated wild-type versus PKO mice.
References
- 1.Uchino S. The epidemiology of acute renal failure in the world. Curr Opin Crit Care. 2006;12(6):538–543. doi: 10.1097/01.ccx.0000247448.94252.5a [DOI] [PubMed] [Google Scholar]
- 2.Pannu N, Nadim MK. An overview of drug-induced acute kidney injury. Crit Care Med. 2008;36(suppl 4):S216–S223. doi: 10.1097/ccm.0b013e318168e375 [DOI] [PubMed] [Google Scholar]
- 3.Rabb H Griffin MD McKay DB, et al. Inflammation in AKI: current understanding, key questions, and knowledge gaps. J Am Soc Nephrol. 2016;27(2):371–379. doi: 10.1681/ASN.2015030261 [DOI] [PMC free article] [PubMed] [Google Scholar]
- 4.Desanti De Oliveira B Xu K Shen TH, et al. Molecular nephrology: types of acute tubular injury. Nat Rev Nephrol. 2019;15(10):599–612. doi: 10.1038/s41581-019-0184-x [DOI] [PMC free article] [PubMed] [Google Scholar]
- 5.O'Neill LA. The interleukin-1 receptor/Toll-like receptor superfamily: 10 years of progress. Immunol Rev. 2008;226(1):10–18. doi: 10.1111/j.1600-065X.2008.00701.x [DOI] [PubMed] [Google Scholar]
- 6.Haq M, Norman J, Saba SR, Ramirez G, Rabb H. Role of IL-1 in renal ischemic reperfusion injury. J Am Soc Nephrol. 1998;9(4):614–619. doi: 10.1681/ASN.v94614 [DOI] [PubMed] [Google Scholar]
- 7.Faubel S Lewis EC Reznikov L, et al. Cisplatin-induced acute renal failure is associated with an increase in the cytokines interleukin (IL)-1β, IL-18, IL-6, and neutrophil infiltration in the kidney. J Pharmacol Exp Ther. 2007;322(1):8–15. doi: 10.1124/jpet.107.119792 [DOI] [PubMed] [Google Scholar]
- 8.Guidot DM, Linas SL, Repine MJ, Shanley PF, Fisher HS, Repine JE. Interleukin-1 treatment increases neutrophils but not antioxidant enzyme activity or resistance to ischemia-reperfusion injury in rat kidneys. Inflammation. 1994;18(5):537–545. doi: 10.1007/BF01560700 [DOI] [PubMed] [Google Scholar]
- 9.Kadova Z Dolezelova E Cermanova J, et al. IL-1 receptor blockade alleviates endotoxin-mediated impairment of renal drug excretory functions in rats. Am J Physiol Renal Physiol. 2015;308(5):F388–F399. doi: 10.1152/ajprenal.00266.2014 [DOI] [PubMed] [Google Scholar]
- 10.Ridker PM MacFadyen JG Glynn RJ, et al. Inhibition of interleukin-1β by canakinumab and cardiovascular outcomes in patients with Chronic Kidney disease. J Am Coll Cardiol. 2018;71(21):2405–2414. doi: 10.1016/j.jacc.2018.03.490 [DOI] [PubMed] [Google Scholar]
- 11.Ren J Lu X Hall G, et al. IL-1 receptor signaling in podocytes limits susceptibility to glomerular damage. Am J Physiol Renal Physiol. 2022;322(2):F164–F174. doi: 10.1152/ajprenal.00353.2021 [DOI] [PMC free article] [PubMed] [Google Scholar]
- 12.Chang SY Weber EJ Sidorenko VS, et al. Human liver-kidney model elucidates the mechanisms of aristolochic acid nephrotoxicity. JCI Insight. 2017;2(22):e95978. doi: 10.1172/jci.insight.95978 [DOI] [PMC free article] [PubMed] [Google Scholar]
- 13.Robson MJ Zhu CB Quinlan MA, et al. Generation and characterization of mice expressing a conditional allele of the interleukin-1 receptor type 1. PLoS One. 2016;11(3):e0150068. doi: 10.1371/journal.pone.0150068 [DOI] [PMC free article] [PubMed] [Google Scholar]
- 14.Higgins DF Kimura K Bernhardt WM, et al. Hypoxia promotes fibrogenesis in vivo via HIF-1 stimulation of epithelial-to-mesenchymal transition. J Clin Invest. 2007;117(12):3810–3820. doi: 10.1172/JCI30487 [DOI] [PMC free article] [PubMed] [Google Scholar]
- 15.Korhonen H Fisslthaler B Moers A, et al. Anaphylactic shock depends on endothelial Gq/G11. J Exp Med. 2009;206(2):411–420. doi: 10.1084/jem.20082150 [DOI] [PMC free article] [PubMed] [Google Scholar]
- 16.Privratsky JR Ide S Chen Y, et al. A macrophage-endothelial immunoregulatory axis ameliorates septic acute kidney injury. Kidney Int. 2023;103(3):514–528. doi: 10.1016/j.kint.2022.10.008 [DOI] [PMC free article] [PubMed] [Google Scholar]
- 17.Kirita Y, Wu H, Uchimura K, Wilson PC, Humphreys BD. Cell profiling of mouse acute kidney injury reveals conserved cellular responses to injury. Proc Natl Acad Sci U S A. 2020;117(27):15874–15883. doi: 10.1073/pnas.2005477117 [DOI] [PMC free article] [PubMed] [Google Scholar]
- 18.Park J Shrestha R Qiu C, et al. Single-cell transcriptomics of the mouse kidney reveals potential cellular targets of kidney disease. Science. 2018;360(6390):758–763. doi: 10.1126/science.aar2131 [DOI] [PMC free article] [PubMed] [Google Scholar]
- 19.Clark JZ, Chen L, Chou CL, Jung HJ, Lee JW, Knepper MA. Representation and relative abundance of cell-type selective markers in whole-kidney RNA-Seq data. Kidney Int. 2019;95(4):787–796. doi: 10.1016/j.kint.2018.11.028 [DOI] [PMC free article] [PubMed] [Google Scholar]
- 20.Subramanian A Tamayo P Mootha VK, et al. Gene set enrichment analysis: a knowledge-based approach for interpreting genome-wide expression profiles. Proc Natl Acad Sci U S A. 2005;102(43):15545–15550. doi: 10.1073/pnas.0506580102 [DOI] [PMC free article] [PubMed] [Google Scholar]
- 21.Yu G, Wang LG, Han Y, He QY. clusterProfiler: an R package for comparing biological themes among gene clusters. OMICS. 2012;16(5):284–287. doi: 10.1089/omi.2011.0118 [DOI] [PMC free article] [PubMed] [Google Scholar]
- 22.Liberzon A, Birger C, Thorvaldsdottir H, Ghandi M, Mesirov JP, Tamayo P. The molecular signatures database hallmark gene set collection. Cell Syst. 2015;1(6):417–425. doi: 10.1016/j.cels.2015.12.004 [DOI] [PMC free article] [PubMed] [Google Scholar]
- 23.Ren J, Lu X, Griffiths R, Privratsky JR, Crowley SD. Twist1 in T Lymphocytes augments kidney fibrosis after ureteral obstruction. Kidney360. 2021;2(5):784–794. doi: 10.34067/KID.0007182020 [DOI] [PMC free article] [PubMed] [Google Scholar]
- 24.Nofer JR Bot M Brodde M, et al. FTY720, a synthetic sphingosine 1 phosphate analogue, inhibits development of atherosclerosis in low-density lipoprotein receptor-deficient mice. Circulation. 2007;115(4):501–508. doi: 10.1161/CIRCULATIONAHA.106.641407 [DOI] [PubMed] [Google Scholar]
- 25.Li Y Zhou J Qiu J, et al. Berberine reduces gut-vascular barrier permeability via modulation of ApoM/S1P pathway in a model of polymicrobial sepsis. Life Sci. 2020;261:118460. doi: 10.1016/j.lfs.2020.118460 [DOI] [PubMed] [Google Scholar]
- 26.Rossiter H Barresi C Ghannadan M, et al. Inactivation of VEGF in mammary gland epithelium severely compromises mammary gland development and function. FASEB J. 2007;21(14):3994–4004. doi: 10.1096/fj.07-8720com [DOI] [PubMed] [Google Scholar]
- 27.Mantsounga CS Lee C Neverson J, et al. Macrophage IL-1β promotes arteriogenesis by autocrine STAT3- and NF-κB-mediated transcription of pro-angiogenic VEGF-A. Cell Rep. 2022;38(5):110309. doi: 10.1016/j.celrep.2022.110309 [DOI] [PMC free article] [PubMed] [Google Scholar]
- 28.Rankin EB, Tomaszewski JE, Haase VH. Renal cyst development in mice with conditional inactivation of the von Hippel-Lindau tumor suppressor. Cancer Res. 2006;66(5):2576–2583. doi: 10.1158/0008-5472.CAN-05-3241 [DOI] [PMC free article] [PubMed] [Google Scholar]
- 29.Jang HS Noh MR Jung EM, et al. Proximal tubule cyclophilin D regulates fatty acid oxidation in cisplatin-induced acute kidney injury. Kidney Int. 2020;97(2):327–339. doi: 10.1016/j.kint.2019.08.019 [DOI] [PMC free article] [PubMed] [Google Scholar]
- 30.Yu X Xu M Meng X, et al. Nuclear receptor PXR targets AKR1B7 to protect mitochondrial metabolism and renal function in AKI. Sci Transl Med. 2020;12(543):eaay7591. doi: 10.1126/scitranslmed.aay7591 [DOI] [PubMed] [Google Scholar]
- 31.Xu S Jia P Fang Y, et al. Nuclear farnesoid X receptor attenuates acute kidney injury through fatty acid oxidation. Kidney Int. 2022;101(5):987–1002. doi: 10.1016/j.kint.2022.01.029 [DOI] [PubMed] [Google Scholar]
- 32.Yalcinkaya M, von Eckardstein A. Apolipoprotein M and sphingosine-1-phosphate: a potentially antidiabetic tandem carried by HDL. Diabetes. 2020;69(5):859–861. doi: 10.2337/dbi20-0005 [DOI] [PMC free article] [PubMed] [Google Scholar]
- 33.Kurano M Tsukamoto K Shimizu T, et al. Protection against insulin resistance by apolipoprotein M/Sphingosine-1-Phosphate. Diabetes. 2020;69(5):867–881. doi: 10.2337/db19-0811 [DOI] [PubMed] [Google Scholar]
- 34.Park SW Kim M Kim JY, et al. Proximal tubule sphingosine kinase-1 has a critical role in A1 adenosine receptor-mediated renal protection from ischemia. Kidney Int. 2012;82(8):878–891. doi: 10.1038/ki.2012.224 [DOI] [PMC free article] [PubMed] [Google Scholar]
- 35.Bisgaard LS, Christoffersen C. The apoM/S1P complex-A mediator in kidney biology and disease? Front Med (Lausanne). 2021;8:754490. doi: 10.3389/fmed.2021.754490 [DOI] [PMC free article] [PubMed] [Google Scholar]
- 36.Christoffersen C Federspiel CK Borup A, et al. The apolipoprotein M/S1P Axis controls triglyceride metabolism and Brown fat activity. Cell Rep. 2018;22(1):175–188. doi: 10.1016/j.celrep.2017.12.029 [DOI] [PubMed] [Google Scholar]
- 37.Awad AS Ye H Huang L, et al. Selective sphingosine 1-phosphate 1 receptor activation reduces ischemia-reperfusion injury in mouse kidney. Am J Physiol Renal Physiol. 2006;290(6):F1516–F1524. doi: 10.1152/ajprenal.00311.2005 [DOI] [PubMed] [Google Scholar]
- 38.Szekanecz Z, Koch AE. Mechanisms of Disease: angiogenesis in inflammatory diseases. Nat Clin Pract Rheumatol. 2007;3(11):635–643. doi: 10.1038/ncprheum0647 [DOI] [PubMed] [Google Scholar]
- 39.Scaldaferri F Vetrano S Sans M, et al. VEGF-A links angiogenesis and inflammation in inflammatory bowel disease pathogenesis. Gastroenterology. 2009;136(2):585–595.e5. doi: 10.1053/j.gastro.2008.09.064 [DOI] [PubMed] [Google Scholar]
- 40.Frangogiannis NG. The inflammatory response in myocardial injury, repair, and remodelling. Nat Rev Cardiol. 2014;11(5):255–265. doi: 10.1038/nrcardio.2014.28 [DOI] [PMC free article] [PubMed] [Google Scholar]
- 41.Bujak M Dobaczewski M Chatila K, et al. Interleukin-1 receptor type I signaling critically regulates infarct healing and cardiac remodeling. Am J Pathol. 2008;173(1):57–67. doi: 10.2353/ajpath.2008.070974 [DOI] [PMC free article] [PubMed] [Google Scholar]
- 42.Privratsky JR Zhang J Lu X, et al. Interleukin 1 receptor (IL-1R1) activation exacerbates toxin-induced acute kidney injury. Am J Physiol Renal Physiol. 2018;315(3):F682–F691. doi: 10.1152/ajprenal.00104.2018 [DOI] [PMC free article] [PubMed] [Google Scholar]
- 43.Bisgaard LS, Christoffersen C. Apolipoprotein M/sphingosine-1-phosphate: novel effects on lipids, inflammation and kidney biology. Curr Opin Lipidol. 2019;30(3):212–217. doi: 10.1097/mol.0000000000000606 [DOI] [PubMed] [Google Scholar]
- 44.Frej C, Linder A, Happonen KE, Taylor FB, Lupu F, Dahlback B. Sphingosine 1-phosphate and its carrier apolipoprotein M in human sepsis and in Escherichia coli sepsis in baboons. J Cell Mol Med. 2016;20(6):1170–1181. doi: 10.1111/jcmm.12831 [DOI] [PMC free article] [PubMed] [Google Scholar]
- 45.Mosialou I, Krasagakis K, Kardassis D. Opposite regulation of the human apolipoprotein M gene by hepatocyte nuclear factor 1 and Jun transcription factors. J Biol Chem. 2011;286(19):17259–17269. doi: 10.1074/jbc.M110.200659 [DOI] [PMC free article] [PubMed] [Google Scholar]
- 46.Pei W Wu Y Zhang X, et al. Deletion of ApoM gene induces apoptosis in mouse kidney via mitochondrial and endoplasmic reticulum stress pathways. Biochem Biophysical Res Commun. 2018;505(3):891–897. doi: 10.1016/j.bbrc.2018.09.162 [DOI] [PubMed] [Google Scholar]
- 47.Sorensen IM Bertelsen M Freese E, et al. Apolipoprotein M in patients with chronic kidney disease. Atherosclerosis. 2018;275:304–311. doi: 10.1016/j.atherosclerosis.2018.06.815 [DOI] [PubMed] [Google Scholar]
- 48.Zhou H Wang H Yu M, et al. IL-1 induces mitochondrial translocation of IRAK2 to suppress oxidative metabolism in adipocytes. Nat Immunol. 2020;21(10):1219–1231. doi: 10.1038/s41590-020-0750-1 [DOI] [PMC free article] [PubMed] [Google Scholar]
- 49.Basile DP Friedrich JL Spahic J, et al. Impaired endothelial proliferation and mesenchymal transition contribute to vascular rarefaction following acute kidney injury. Am J Physiol Renal Physiol. 2011;300(3):F721–F733. doi: 10.1152/ajprenal.00546.2010 [DOI] [PMC free article] [PubMed] [Google Scholar]
- 50.Collett JA, Mehrotra P, Crone A, Shelley WC, Yoder MC, Basile DP. Endothelial colony-forming cells ameliorate endothelial dysfunction via secreted factors following ischemia-reperfusion injury. Am J Physiol Renal Physiol. 2017;312(5):F897–F907. doi: 10.1152/ajprenal.00643.2016 [DOI] [PMC free article] [PubMed] [Google Scholar]
- 51.Carmi Y Voronov E Dotan S, et al. The role of macrophage-derived IL-1 in induction and maintenance of angiogenesis. J Immunol. 2009;183(7):4705–4714. doi: 10.4049/jimmunol.0901511 [DOI] [PubMed] [Google Scholar]
- 52.Bunt SK, Yang L, Sinha P, Clements VK, Leips J, Ostrand-Rosenberg S. Reduced inflammation in the tumor microenvironment delays the accumulation of myeloid-derived suppressor cells and limits tumor progression. Cancer Res. 2007;67(20):10019–10026. doi: 10.1158/0008-5472.CAN-07-2354 [DOI] [PMC free article] [PubMed] [Google Scholar]
- 53.Garlanda C, Mantovani A. Interleukin-1 in tumor progression, therapy, and prevention. Cancer Cell. 2021;39(8):1023–1027. doi: 10.1016/j.ccell.2021.04.011 [DOI] [PubMed] [Google Scholar]
- 54.Voronov E Shouval DS Krelin Y, et al. IL-1 is required for tumor invasiveness and angiogenesis. Proc Natl Acad Sci U S A. 2003;100(5):2645–2650. doi: 10.1073/pnas.0437939100 [DOI] [PMC free article] [PubMed] [Google Scholar]
- 55.Jung YJ, Isaacs JS, Lee S, Trepel J, Neckers L. IL-1β mediated up-regulation of HIF-lα via an NFkB/COX-2 pathway identifies HIF-1 as a critical link between inflammation and oncogenesis. FASEB J. 2003;17(14):1–22. doi: 10.1096/fj.03-0329fje [DOI] [PubMed] [Google Scholar]
- 56.Huang YH, Yang HY, Huang SW, Ou G, Hsu YF, Hsu MJ. Interleukin-6 induces vascular endothelial growth factor-C expression via src-FAK-STAT3 signaling in lymphatic endothelial cells. PLoS One. 2016;11(7):e0158839. doi: 10.1371/journal.pone.0158839 [DOI] [PMC free article] [PubMed] [Google Scholar]
- 57.Choi YS Choi HJ Min JK, et al. Interleukin-33 induces angiogenesis and vascular permeability through ST2/TRAF6-mediated endothelial nitric oxide production. Blood. 2009;114(14):3117–3126. doi: 10.1182/blood-2009-02-203372 [DOI] [PubMed] [Google Scholar]
- 58.Salven P, Hattori K, Heissig B, Rafii S. Interleukin-1α (IL-1α) promotes angiogenesis in vivo via VEGFR-2 pathway by inducing inflammatory cell VEGF synthesis and secretion. FASEB J. 2002;16(11):1471–1473. doi: 10.1096/fj.02-0134fje [DOI] [PubMed] [Google Scholar]
- 59.Leonard EC, Friedrich JL, Basile DP. VEGF-121 preserves renal microvessel structure and ameliorates secondary renal disease following acute kidney injury. Am J Physiol Renal Physiol. 2008;295(6):F1648–F1657. doi: 10.1152/ajprenal.00099.2008 [DOI] [PMC free article] [PubMed] [Google Scholar]
- 60.Eremina V Sood M Haigh J, et al. Glomerular-specific alterations of VEGF-A expression lead to distinct congenital and acquired renal diseases. J Clin Invest. 2003;111(5):707–716. doi: 10.1172/JCI17423 [DOI] [PMC free article] [PubMed] [Google Scholar]
- 61.Rusai K Huang H Sayed N, et al. Administration of interleukin-1 receptor antagonist ameliorates renal ischemia-reperfusion injury. Transpl Int. 2008;21(6):572–580. doi: 10.1111/j.1432-2277.2008.00651.x [DOI] [PubMed] [Google Scholar]
- 62.Li H Tsokos MG Bhargava R, et al. IL-23 reshapes kidney resident cell metabolism and promotes local kidney inflammation. J Clin Invest. 2021;131(12):e142428. doi: 10.1172/JCI142428 [DOI] [PMC free article] [PubMed] [Google Scholar]
- 63.Leaf IA Nakagawa S Johnson BG, et al. Pericyte MyD88 and IRAK4 control inflammatory and fibrotic responses to tissue injury. J Clin Invest. 2016;127(1):321–334. doi: 10.1172/JCI87532 [DOI] [PMC free article] [PubMed] [Google Scholar]
Associated Data
This section collects any data citations, data availability statements, or supplementary materials included in this article.
Data Availability Statement
Data related to transcriptomic, proteomic, or metabolomic data (per previous question); original data created for the study are or will be available in a persistent repository on publication. The raw and processed scRNA-seq data generated in this study have been deposited in a persistent repository (https://gitlab.oit.duke.edu/jrp43/ren-crowley-pt-il1r-aki). The remaining data are available with the article or supplemental information.