

Abstract
Frailty is characterized by increased vulnerability to disability and high risk for mortality in older adults. Identification of factors that contribute to frailty resilience is an important step in the development of effective therapies that protect against frailty. First, a reliable quantification of frailty resilience is needed. We developed a novel measure of frailty resilience, the Frailty Resilience Score (FRS), that integrates frailty genetic risk, age, and sex. Application of FRS to the LonGenity cohort (n = 467, mean age 74.4) demonstrated its validity compared to phenotypic frailty and its utility as a reliable predictor of overall survival. In a multivariable-adjusted analysis, 1-standard deviation increase in FRS predicted a 38% reduction in the hazard of mortality, independent of baseline frailty (p < .001). Additionally, FRS was used to identify a proteomic profile of frailty resilience. FRS was shown to be a reliable measure of frailty resilience that can be applied to biological studies of resilience.
Keywords: FRS, Genetics, Longevity, Proteomics
Frailty is generally considered a state of increased vulnerability to physiological stressors and subsequent inability to maintain homeostasis (1,2) and is linked to increased risk of falls, hospitalizations, morbidity, and mortality in older individuals. Much has been learned about biological pathways and clinical risk factors for frailty, but less is known about what makes a person resilient to frailty. While initially resilience was regarded as the opposite of frailty, emerging research supports the idea that it can moderate, or even function independently of, frailty (3–6). A major limitation to identifying factors that confer resilience to frailty is a lack of a valid and reliable measure of frailty resilience.
To address this knowledge gap, we developed a Frailty Resilience Score (FRS) to quantify resilience to frailty, which was conceptually defined as the ability to protect against or delay the onset or progression of frailty in the presence of factors known to increase the risk for frailty, including advanced age, high frailty-associated polygenic risk score (PRS), and female sex. The FRS was operationalized as the difference between an individual’s predicted frailty and observed frailty. First, we developed the FRS in a genetically homogenous population and described its epidemiology. Second, we examined the criterion validity of FRS versus current frailty phenotypic definitions. Finally, to establish the clinical relevance of FRS, we examined the predictive validity of the FRS for mortality in the LonGenity cohort. Additionally, we identified the proteomic profile associated with FRS as a first step in elucidating the biological mechanisms of frailty resilience. We hypothesized that resilience to frailty would be inversely associated with mortality risk even after accounting for presence of frailty and other confounders. Establishing FRS will provide a quantitative tool to measure resilience that can be used to discover the biological underpinnings of resilience and to develop interventions that enhance resilience.
Method
Population
The study population was selected from the LonGenity cohort (n = 1 224), an ongoing longitudinal study that aims to identify factors that contribute to healthy aging (7). LonGenity enrolls individuals of Ashkenazi Jewish ancestry, age 65–94 years, who do not have significant cognitive impairment at baseline, excluded using established cut scores on the Blessed test of >8 and on the AD-8 (eight item informant interview to differentiate aging and dementia) of >2 (7). Other exclusion criteria include severe visual or hearing impairments or having a sibling already enrolled in the study. Approximately half of the cohort has at least 1 parent age 95 or older, termed offspring of parents with exceptional longevity (OPEL). LonGenity participants undergo annual assessments that include collection of updated medical history, cognitive testing, and functional evaluations that are used to construct measures of frailty. Fasting blood samples are collected biannually for DNA extraction and biochemical profiling. Participants eligible for inclusion in this analysis had 3 annual measurements of frailty as well as genotyping results (n = 467). Participants who did not qualify for inclusion based on the above criteria were older at baseline (p < .001), had fewer years of education (p = .003), and had higher global health score at baseline (p = .019); however, they did not significantly differ in sex distribution or familial history of longevity.
Frailty Definitions
Several definitions of frailty were used in this study to characterize frailty. The deficit accumulation approach was utilized to quantitatively measure frailty and is reported as the frailty index (FI). The variables selected for the FI construction were based on standardized criteria as proposed by Rockwood et al. (8). The variables and cutoffs used for construction of the FI are shown in Supplementary Table 1. Continuous or rank variables were graded from 0 (no deficit) to 1 (maximum deficits). The FI was calculated by adding the number of deficits (value = 1) and dividing the sum by the total number of variables per participant, which resulted in a range of scores from 0 to 1 for each individual (9). The same method and cutoffs have been applied previously in the same cohort (10). The phenotypic frailty approach was used to define physical frailty qualitatively. Phenotypic frailty was operationally defined based on the Cardiovascular Health Study criteria as meeting 3 or more of the following 5 attributes: unintentional weight loss of ≥10 lbs in the past year (1); muscle weakness was measured using Jamar handgrip dynamometer and weakness was defined using a cut score of 1 standard deviation [SD] or more below age and sex mean values; exhaustion characterized by a negative response to the question, “Do you feel full of energy?,” on the Geriatric Depression Scale (11); self-reported low physical activity levels characterized by a positive response to the question, “Have you been less active physically?,” on the Health Self-Assessment Questionnaire; and slow gait (1). Gait speed (cm/s) was measured using an 8.5-m-long computerized walkway with embedded pressure sensors (GAITRite; CIR Systems, Inc., Franklin, NJ). Slow gait was defined as 1.5 or more SD below age- and sex-appropriate means. The method and cutoff adopted to characterize phenotypic frailty in the cohort have been previously reported (12).
Frailty Resilience Score
This score quantifies frailty resilience in the context of known frailty risk factors. Previous studies have shown frailty to increase with age and in women (1,9). Additionally, frailty PRS quantifies the common polygenic risk of frailty for an individual based on their genetic makeup. We calculated PRSs using PRSice-2 (13,14) to quantify frailty risk from common variants in the LonGenity cohort. We first collected summary statistics from the most recent frailty genome-wide association study (15). From combined genotype data after imputation, we then selected common single nucleotide polymorphism (SNPs) (minor allele frequency >5%) in the cohort and carried out linkage disequilibrium clumping if they are within 250 kbps and R2 >0.1. After clumping, we used 19 p values (1, 0.9, …, 0.1, 0.01, 1E-3, …, 1E-10) as cutoffs to select SNPs for scoring.
At a given age, people with higher frailty PRS are at risk of being more frail. Some older individuals with higher frailty PRS, however, are resilient to frailty, as they have lower FI scores than their peers of the same age and similar genetic predisposition. We developed an FRS to quantify this genotype–phenotype discrepancy between the genetic risk and the actual phenotype of frailty of everyone in this study, which are measured by PRS and FI, respectively. To define FRS, we first fit a linear mixed model to the FI measured at baseline and at subsequent visits in our longitudinal cohort,
where Tij is time of the jth assessment from the baseline visit of ith participant, FIij is the frailty index, A0i is the baseline age, Gi is the frailty PRS, Si is sex of the participant, and mi is the number of frailty measurements for the participant, s are fixed effects and and are random effects. FRS is then defined as the average difference between the observed FI and the predicted FI based on the fixed effects: . Note that the prediction does not include the random effects. When an individual’s FRS is positive, their observed FI is, on average, smaller than the FI predicted by their PRS, age, and sex, implying that this individual is resilient to frailty.
Proteomic Assessment
Proteomic analysis was conducted using 5k SomaScan Assay V4, which included 5 209 SOMAmer reagents targeting human proteins. SomaScan data standardization was carried out as previously described by SomaLogic, Inc., Boulder, CO. (16). After implementing quality checks (QC), 960 sequences that failed QC were removed. Subsequent exclusion of nonhuman proteins, deprecated markers, noncleavable, nonbiotin as well as spuriomers left 4 265 SOMAmer reagents available for proteomic analysis (17). Relative fluorescence unit (RFU) values observed after data normalization procedure for each SOMAmer reagent were natural log-transformed. Outliers were removed using median absolute deviation method. There were 464 participants with available proteomic data.
Statistical Analysis
Baseline characteristics were summarized with descriptive statistics. FRS was constructed using FI measurements from the earliest 3 visits. To determine the longitudinal association of FRS with mortality, we used Cox models to compute hazard ratios (HRs) with 95% confidence intervals (CIs) adjusted for age, sex, years of education, and body mass index (BMI). In order to avoid potential confounding of survival analysis by FI data incorporated into the FRS construct, the baseline in all Cox models was set at the time of third FI measurement. To establish the ability of FRS to predict survival over the FI as well as other confounders, we included socioeconomic status (7), FI score at third follow-up, and parental longevity (OPEL status) as additional covariates in the Cox regression model. Missing BMI values at third follow-up wave were imputed by the values that were measured the closest to the third visit. Time-to-event outcomes were obtained by calculating time in years between the third assessment date and death date or final assessment date if the participant remained alive throughout the study follow-up. Proportionality of the models was examined graphically and statistically, and found to be adequately met. Kaplan–Meier estimates of survival functions were used to illustrate differences in survival between participants in the lowest tertile of FRS and participants in the upper 2 tertiles of FRS. p Values of <.05 were considered statistically significant. Cox proportional hazard analyses were carried out using SPSS version 27 (IBM, Armonk, NY).
The objective of the proteomic analysis was to identify SOMAmer reagents that significantly associated with the FRS using linear regression analyses in R (V4.1.0). Analyses were adjusted for median age across waves, sex, and parental history of longevity (OPEL status). Beta estimate was defined as increase or decrease in FRS with each unit of log SOMAmer reagent concentration. Bonferroni-corrected p values less than 1.0 × 10⁻⁵ (0.05/4 265) were considered statistically significant.
Weighted Gene Coexpression Network Analysis
The weighted gene coexpression network analysis (WGCNA) R package (18) was used to build unsigned protein expression networks from normalized and transformed RFUs of 4 265 SOMAmer concentrations. The WGCNA methodology has been well-described in previous publications as well as the tutorial accompanying this R package (18). Pathway or enrichment analyses were carried out using proteins in the modules that were associated with FRS to discover biological pathways related to frailty resilience (19).
Results
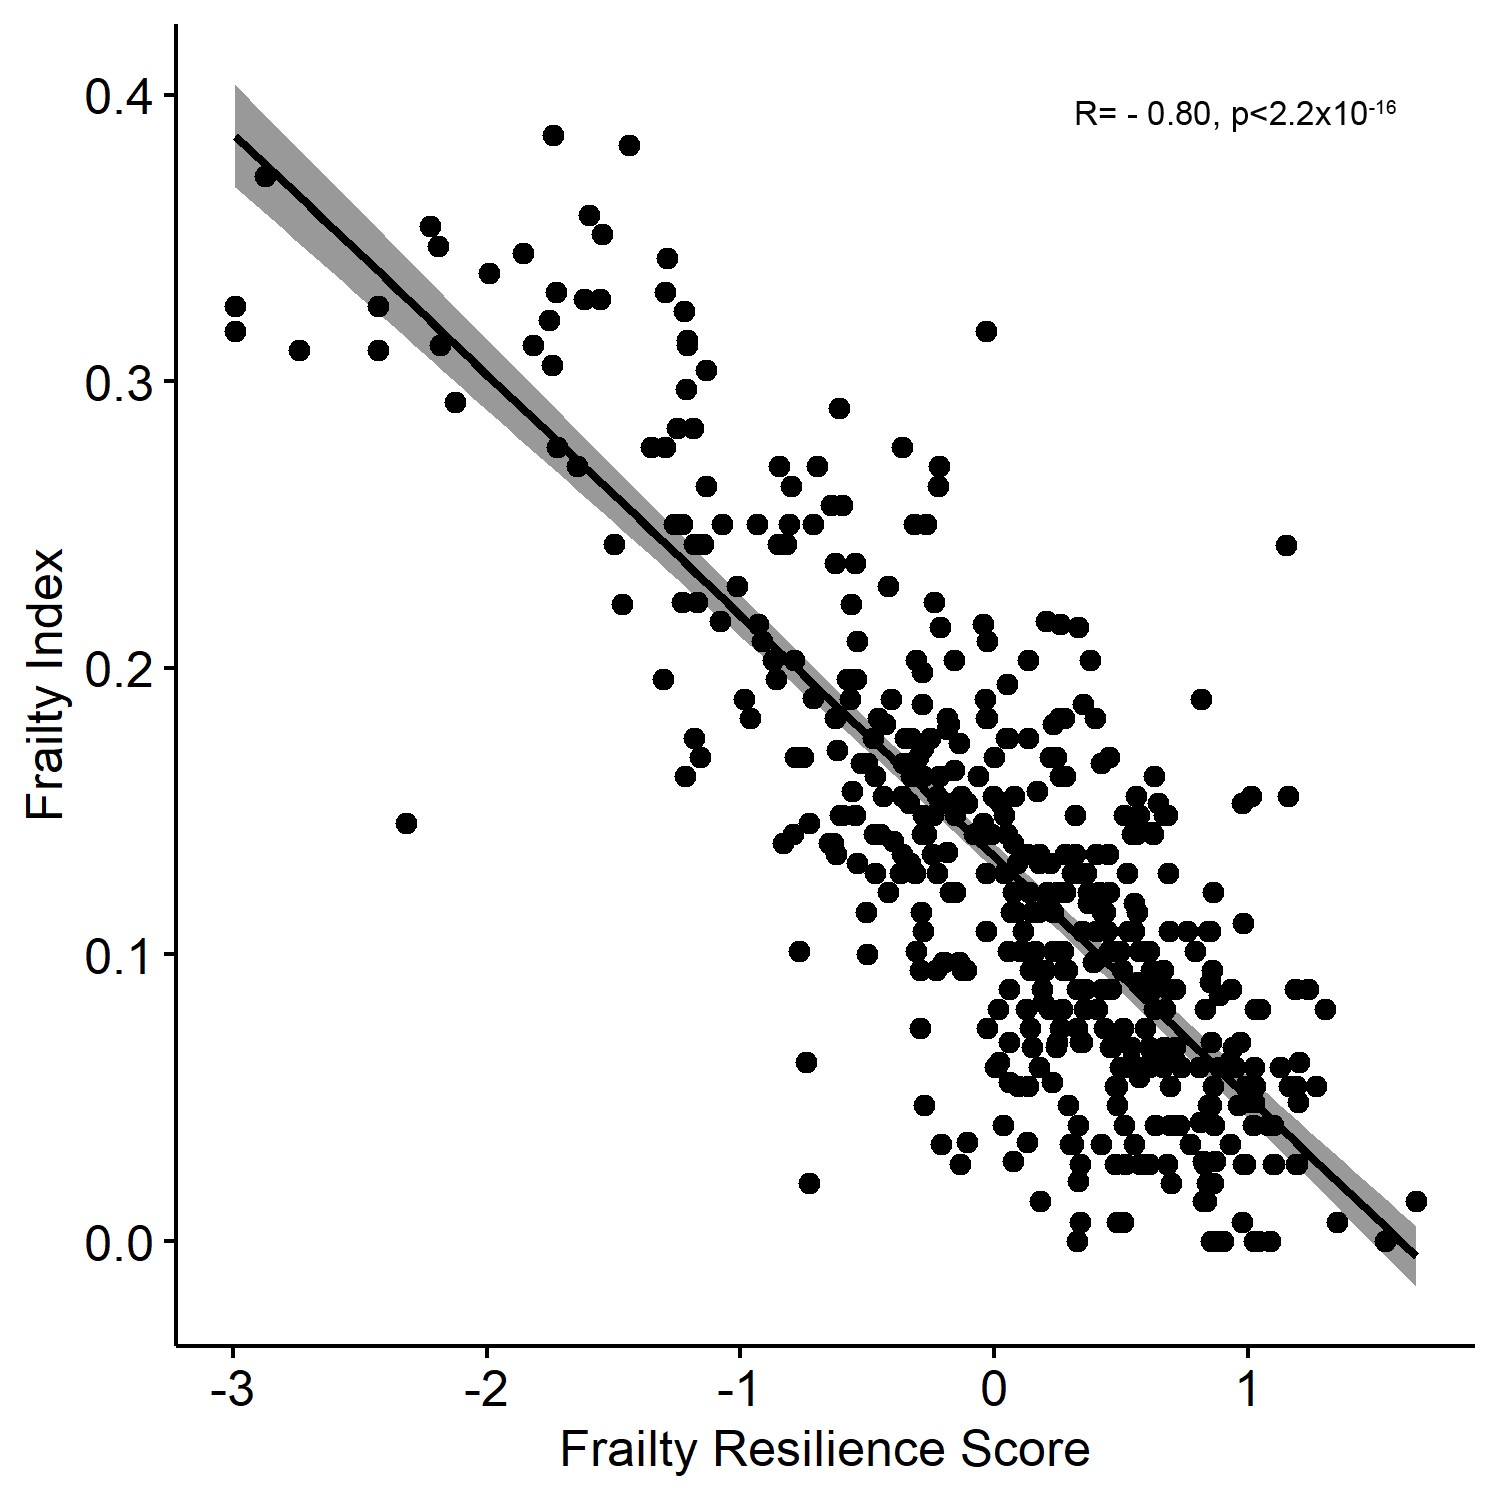
The FRS was calculated for 467 individuals with the mean baseline age 74.4 ± 5.9 years. The group baseline characteristics are listed in Table 1. Females made up 54.6% of the cohort and the mean FRS for the cohort was 0.02 ± 0.79. Phenotypic frailty was defined in 429 participants, of whom 61 (14%) were frail and 368 were nonfrail. An analysis stratified by phenotypic frailty found that the nonfrail group had significantly higher mean FRS (more resilient) compared to the frail group, 0.21 ± 0.62 versus −0.98 ± 0.95, respectively (p < 2.2 x 10⁻¹⁶), Figure 1. Lower FI also correlated with higher FRS (r = −0.80, p < 2.2 × 10⁻¹⁶), Supplementary Figure 1.
Table 1.
Baseline Characteristics.
| Characteristic (n = 467) | |
|---|---|
| Age, mean ± SD, years | 74.35 ± 5.90 |
| Female, n (%) | 255 (54.6) |
| Offspring of parents with exceptional longevity, n (%) | 254 (54.4) |
| Follow-up time, median (IQR), years | 8.7 (6.7-10.3) |
| Education, mean ± SD, years | 17.84 ± 2.69 |
| Frailty index, mean ± SD | 0.13 ± 0.08 |
| FRS, mean ± SD | 0.02 ± 0.79 |
| BMI, mean ± SD | 27.49 ± 4.91 |
| Medical History | % (n) |
|---|---|
| Angina | 3.6 (17) |
| CHF | 0.4 (2) |
| COPD | 1.9 (9) |
| Diabetes mellitus | 7.7 (36) |
| HTN | 43.3 (202) |
| MI | 7.1 (33) |
| Osteoarthritis | 39.6 (185) |
| Parkinson’s disease | 1.1 (5) |
| Stroke | 3.2 (15) |
Notes: BMI = body mass index; CHF = congestive heart failure; COPD = chronic obstructive pulmonary disease; FRS = Frailty Resilience Score; HTN = hypertension; IQR = interquartile range; MI = myocardial infarction; SD = standard deviation.
Figure 1.

Mean Frailty Resilience Score values for groups stratified for frailty based on physical frailty measures (n = 429).
During the median follow-up time subsequent to the third visit (interquartile range) of 5.7 (3.3–7.1) years, 51 participants died. The Kaplan–Meier survival analysis demonstrated that the hazard for mortality was lower for individuals in the combined top 2 FRS tertiles compared to the bottom FRS tertile, p = .06, Figure 2. In a Cox proportional hazard model adjusted for age, sex, and BMI, a 1-point increase in FRS was related to 51% reduced hazard of mortality and per 1-SD increase in FRS, the mortality hazard was reduced by 38%, HR 0.49 (95% CI 0.36–0.66), (p < .001), Figure 3. After additional adjustments for socioeconomic status, parental longevity, and the FI score in participants with all available data (n = 439), FRS remained a significant predictor of mortality, HR 0.50 (95% CI 0.29–0.87), p = .02, indicating its utility as a predictor of survival independent of the FI. A similar analysis performed in participants with available phenotypic frailty status (n = 415, with 47 recorded deaths) also found FRS to be associated with reduced mortality, HR 0.46 (95% CI 0.32–0.66), p < .001, independent of age, sex, BMI, socioeconomic status, parental longevity, and phenotypic frailty status.
Figure 2.

Kaplan–Meier survival curves according to Frailty Resilience Score tertiles.
Figure 3.

Hazard ratios and 95% confidence interval for the association of Frailty Resilience Score with mortality, adjusted for age, sex, and body mass index.
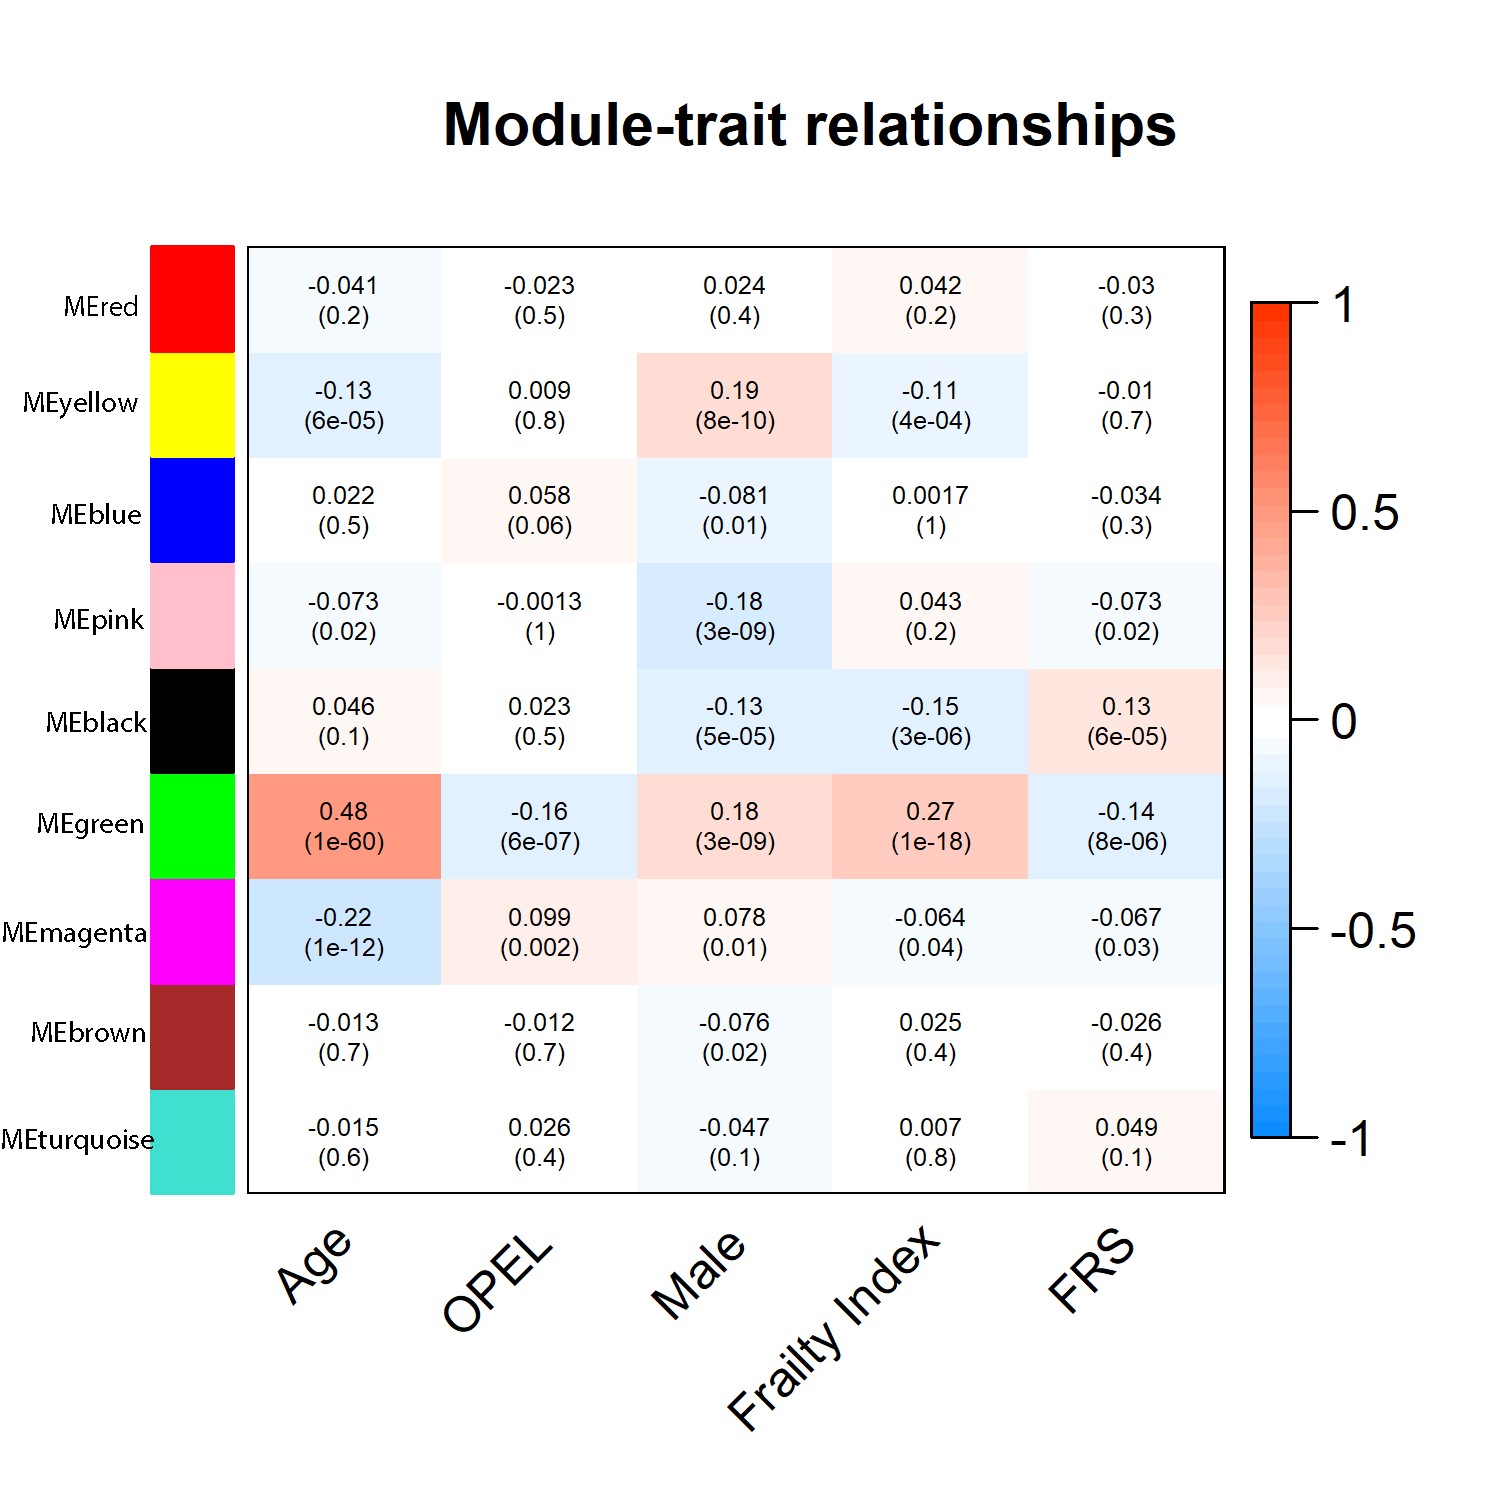
Query of the plasma proteome in association with FRS was performed in 464 participants and identified 7 proteins positively associated with FRS and 11 proteins negatively associated with FRS at significance level of p < 1 × 10⁻⁵, Figure 4 and Supplementary Table 2. Subsequent WGCNA of the proteome revealed that modules most significantly associated with FRS also demonstrated an association with the FI but in the opposite direction, Supplementary Figure 2. Moreover, the module that was most strongly related with familial longevity, defined by OPEL status, was linked with FRS in the same direction, suggesting that familial longevity and frailty resilience may have common biological underpinnings. Pathway analysis using ingenuity pathway analysis (IPA) showed inflammatory response, organismal injury and abnormalities, cell death, and survival to be top pathways associated in green module. Another top module associated with FRS was the black module (Cor = 0.13, p = 6.0 × 10⁻⁵). The IPA revealed cellular movement, connective tissue development and function, organismal injury and abnormalities, organ morphology, as well as nervous system development and function as the top pathways enriched in the black module.
Figure 4.

Association of proteins with Frailty Resilience Score. Volcano plot showing associated proteins as red dots (p value < 1.0 × 10⁻⁵). x-Axis denotes the beta estimate coefficient from linear model and y-axis shows the significance level presented as –log10 (p value). Top proteins have been annotated. ANTR2 = Anthrax toxin receptor 2; CD46 = Membrane cofactor protein; CSPG3 = Neurocan core protein; DNER = Delta and Notch-like epidermal growth factor-related receptor; ERBB1 = Epidermal growth factor receptor; FABP = Fatty acid-binding protein, heart; FABPA = Fatty acid-binding protein, adipocyte; FSTL3 = Follistatin-related protein 3; HHIP = Hedgehog-interacting protein; H6ST3 = Heparan-sulfate 6-O-sulfotransferase 3; HTRA1 = Serine protease HTRA1; IL-1Ra = Interleukin-1 receptor antagonist protein; MIC-1 = Growth/differentiation factor 15; PXDN = Peroxidasin homolog; SAP3 = Ganglioside GM2 activator; SRSF7 = Serine/arginine-rich splicing factor 7.
Discussion
In this study, we quantified resilience to frailty as FRS and demonstrated its concurrent and face validity compared to conventional quantitative and qualitative measures of phenotypic frailty. Additionally, we established the clinical utility of FRS as an independent predictor of survival in older adults. The multivariable-adjusted analysis showed that 1-SD increase in FRS predicted a 38% reduction in the hazard of mortality independent of baseline level and presence of phenotypic frailty. These findings suggest that not only are there factors which lead to frailty susceptibility but there are also mechanisms that protect against frailty, as captured by the FRS. The fact that frailty resilience could not be simply explained by the lack of baseline frailty or risk factors for frailty opens the door to investigations of independent biological mechanisms that regulate resilience to frailty, and opportunities to develop interventions that target resilience.
Identifying predictors of resilience may have an immediate application in the clinical setting. As the presence of frailty has been shown to result in poorer clinical outcomes (20), frailty status has been used as part of the clinical decision making in determining treatment options and resource allocation (21,22). However, this toolset as an outcome predictor is often inadequate and can be augmented by measures of resilience (23). Although a number of existing tools can measure resilience to psychological or physical challenges (3,24), until now there has not been an established measure to assess resilience to frailty. This underscores the need for a reliable measure of frailty resilience that can predict clinically relevant outcomes. If validated in future clinical studies, the FRS, which has already been shown to predict survival, may fill that role.
The LonGenity cohort is unique in that it is enriched with resilient participants. About half of the cohort has a parent with exceptional longevity, and a significant proportion of individuals with longevity delay or escape from age-related diseases (25,26). The resilience to aging and associated diseases appears to be, at least in part, heritable. Compared to age-matched individuals without parental longevity, offspring of parents with exceptional longevity demonstrate lower rates of frailty and age-related diseases (7,27). Additionally, offspring experience better physical function on measures of unipedal stance and gait speed at baseline, as well as a slower decline in unipedal stance, repeated chair rise, and short physical performance battery prospectively (28,29). These differences are apparent despite similar lifestyles, education, and socioeconomic status, highlighting the need to study biological underpinnings of resilience (7). The notion of biological drivers of resilience was further supported by our results which demonstrated that the proteomic module (a cluster of highly correlated proteins) most strongly associated with OPEL status was also associated with FRS and inversely associated with the FI.
The biology of frailty resilience can be investigated using a number of tools. Recent advances in large-scale proteomic analyses have provided opportunities to investigate multiple individual proteins and pathways simultaneously in complex syndromes and diseases. Proteomic analysis conducted in association with the FRS revealed specific proteins both positively and negatively associated with frailty resilience. Many of the identified proteins also previously were inversely associated with the FI (17), reinforcing their importance in the risk of and resilience to frailty. Such insights could lead to a better understanding of the biological underpinnings of frailty resilience and contribute to the development of therapeutic agents that promote resilience rather than target risk factors (30). However, to our knowledge, this study is the first to identify proteins related to resilience, both positively and negatively. This sets us on the path toward developing a biological signature for frailty and resilience. A therapeutic intervention that targets resilience has the potential to mitigate multiple risk factors simultaneously and even counteract the yet unidentified risk factors. Thus, devising therapies that replicate resilience in at-risk individuals may be a more efficient process for countering frailty than developing therapeutics that target each risk factor individually.
The protein with the strongest positive association with frailty resilience was erythroblastic oncogene B (ERBB1), also referred to as HER1 or EGFR, 1 of 4 receptors in the epidermal growth factor (EGFR) family. ERBB1 is a receptor for ligands such as EGF and transforming growth factor alpha with its downstream signaling affecting various cellular responses. Widely implicated in cancer and thus targeted by anticancer therapy, its role in resilience seems unexpected on the surface. However, ERBB1 dysfunction or loss has been linked to various cardiovascular pathologies. While the loss of ERBB1 has been shown to lead to cardiovascular hypertrophy (31), its activation can protect against stress-induced cardiac injury (32). Another protein with a strong positive association with resilience is Anthrax toxin receptor 2 (ANTR2), which plays a role in the maintenance of the extracellular matrix. We had previously shown that ANTR2 has a negative association with frailty, which we hypothesized was due to its implication in hypertension and grip strength (17).
The protein with the strongest negative association with resilience was Follistatin-related protein 3 (FSTL3). FSTL3 has been implicated in various cancers (33) and renal dysfunction (34). Importantly, increased FSTL3 has been linked to the atherosclerotic inflammatory response and heart failure (35,36), 2 essential contributors to frailty. It has also been independently linked to aging and frailty itself (37). Another protein negatively associated with resilience is fatty acid-binding protein (FABP). We had previously demonstrated FABP’s connection to frailty and had hypothesized that this is due to its role in atherosclerosis, similar to FSTL3 (17). Other proteins with similar functions and associations with resilience and frailty include FABPA and leptin.
Our study has a variety of strengths. The well-characterized LonGenity cohort, enriched for hereditary resilience, includes regular clinical assessments and annual evaluations for frailty. Furthermore, this cohort was profiled with a broad proteomic array that targets over 4 000 proteins, allowing us to analyze the associations between clinical and biological parameters. Despite this, the study has limitations. The SomaScan panel, while extensive, is not exhaustive, and there are likely unexamined proteins that might contribute to resilience. Also, the PRS for the FI captures only a small percentage of frailty heritability; thus, a major proportion of genetic frailty resilience remains unexplained. Future studies of rare genetic variants may be able to address this. Additionally, the LonGenity cohort only enrolled Ashkenazi Jewish participants; while this allows us to maximize discoveries of resilience factors driven by the accumulation of rare genetic variants, the generalizability of our findings will need to be confirmed in future studies. Nonetheless, many prior findings identified in this cohort have been confirmed in other populations and vice versa (10,26,38,39).
In conclusion, this study developed a novel measure, FRS, to quantify resilience to frailty. The FRS was validated clinically against established measures of frailty, and as a predictor of survival, confirming its utility. Its novel association with a proteomic profile demonstrated its potential application in identifying biomarkers and biological mechanisms of resilience. If these findings are confirmed in future studies, FRS or FRS-associated biomarkers may become a useful clinical prediction tool and an effective outcome measure for interventions that target frailty resilience.
Supplementary Material
Supplementary data are available at The Journals of Gerontology, Series A: Biological Sciences and Medical Sciences online.
Contributor Information
Sofiya Milman, Department of Medicine, Institute for Aging Research, Albert Einstein College of Medicine, Bronx, New York, USA; Department of Genetics, Albert Einstein College of Medicine, Bronx, New York, USA.
Ben Lerman, School of Medicine, St. George’s University, St. George’s, Grenada, West Indies.
Emmeline Ayers, Department of Neurology, Albert Einstein College of Medicine, Bronx, New York, USA.
Zhengdong Zhang, Department of Genetics, Albert Einstein College of Medicine, Bronx, New York, USA.
Sanish Sathyan, Department of Neurology, Albert Einstein College of Medicine, Bronx, New York, USA.
Morgan Levine, San Diego Institute of Science, Altos Labs, San Diego, California, USA.
Kenny Ye, Department of Epidemiology & Population Health, Albert Einstein College of Medicine, Bronx, New York, USA; Department of Systems & Computational Biology, Albert Einstein College of Medicine, Bronx, New York, USA.
Tina Gao, Department of Medicine, Institute for Aging Research, Albert Einstein College of Medicine, Bronx, New York, USA.
Albert Higgins-Chen, Department of Psychiatry, Yale School of Medicine, New Haven, Connecticut, USA.
Nir Barzilai, Department of Medicine, Institute for Aging Research, Albert Einstein College of Medicine, Bronx, New York, USA; Department of Genetics, Albert Einstein College of Medicine, Bronx, New York, USA.
Joe Verghese, Department of Medicine, Institute for Aging Research, Albert Einstein College of Medicine, Bronx, New York, USA; Department of Neurology, Albert Einstein College of Medicine, Bronx, New York, USA.
Funding
This work was supported by the National Institute on Aging at the National Institutes of Health (grant numbers R56AG044829 to S.M. and J.V.; R01AG061155 to S.M., R01AG057548 to J.V.; R01AG057909 to Z.Z. and N.B.).
Conflict of Interest
None.
Author Contributions
S.M., M.L., N.B., and J.V. contributed to the conception, design, structure, drafting, and revision of the article. B.L. contributed to the drafting and revision of the article. E.A. contributed to the design, data analysis, drafting, and revision of the article. Z.Z., S.S., and K.Y. contributed to the conception, design, structure, data analysis, drafting, and revision of the article. T.G. contributed to the design and drafting of the article. A.H.-C. contributed to the revision of the article.
References
- 1. Fried LP, Tangen CM, Walston J, et al. ; Cardiovascular Health Study Collaborative Research Group. Frailty in older adults: evidence for a phenotype. J Gerontol A Biol Sci Med Sci. 2001;56:M146–M156. doi: 10.1093/gerona/56.3.m146 [DOI] [PubMed] [Google Scholar]
- 2. Rodriguez-Manas L, Feart C, Mann G, et al. ; FOD-CC Group (Appendix 1). Searching for an operational definition of frailty: a Delphi method based consensus statement: the frailty operative definition-consensus conference project. J Gerontol A Biol Sci Med Sci. 2013;68:62–67. doi: 10.1093/gerona/gls119 [DOI] [PMC free article] [PubMed] [Google Scholar]
- 3. Merchant RA, Aprahamian I, Woo J, Vellas B, Morley JE.. Editorial: resilience and successful aging. J Nutr Health Aging. 2022;26:652–656. doi: 10.1007/s12603-022-1818-4 [DOI] [PMC free article] [PubMed] [Google Scholar]
- 4. Zeng Y, Shen K.. Resilience significantly contributes to exceptional longevity. Curr Gerontol Geriatr Res. 2010;2010:525693. doi: 10.1155/2010/525693 [DOI] [PMC free article] [PubMed] [Google Scholar]
- 5. Park J, Lee J, Lee H, Kim S, Kim CO, Park CG.. Physical resilience as a moderator of the relationship between frailty and disability in older adults with osteoarthritis. J Adv Nurs. 2022;78:2085–2094. doi: 10.1111/jan.15135 [DOI] [PubMed] [Google Scholar]
- 6. Whitson HE, Cohen HJ, Schmader KE, Morey MC, Kuchel G, Colon-Emeric CS.. Physical resilience: not simply the opposite of frailty. J Am Geriatr Soc. 2018;66:1459–1461. doi: 10.1111/jgs.15233 [DOI] [PMC free article] [PubMed] [Google Scholar]
- 7. Gubbi S, Schwartz E, Crandall J, et al. Effect of exceptional parental longevity and lifestyle factors on prevalence of cardiovascular disease in offspring. Am J Cardiol. 2017;120:2170–2175. doi: 10.1016/j.amjcard.2017.08.040 [DOI] [PMC free article] [PubMed] [Google Scholar]
- 8. Rockwood K, Mitnitski A.. Frailty in relation to the accumulation of deficits. J Gerontol A Biol Sci Med Sci. 2007;62:722–727. doi: 10.1093/gerona/62.7.722 [DOI] [PubMed] [Google Scholar]
- 9. Searle SD, Mitnitski A, Gahbauer EA, Gill TM, Rockwood K.. A standard procedure for creating a frailty index. BMC Geriatr. 2008;8:24. doi: 10.1186/1471-2318-8-24 [DOI] [PMC free article] [PubMed] [Google Scholar]
- 10. Verghese J, Ayers E, Sathyan S, et al. Trajectories of frailty in aging: prospective cohort study. PLoS One. 2021;16:e0253976. doi: 10.1371/journal.pone.0253976 [DOI] [PMC free article] [PubMed] [Google Scholar]
- 11. Yesavage JA, Brink TL, Rose TL, et al. Development and validation of a geriatric depression screening scale: a preliminary report. J Psychiatr Res. 1982;17:37–49. doi: 10.1016/0022-3956(82)90033-4 [DOI] [PubMed] [Google Scholar]
- 12. Sathyan S, Barzilai N, Atzmon G, Milman S, Ayers E, Verghese J.. Genetic insights into frailty: association of 9p21–23 locus with frailty. Front Med. 2018;5:105. doi: 10.3389/fmed.2018.00105 [DOI] [PMC free article] [PubMed] [Google Scholar]
- 13. Euesden J, Lewis CM, O’Reilly PF.. PRSice: polygenic risk score software. Bioinformatics. 2015;31:1466–1468. doi: 10.1093/bioinformatics/btu848 [DOI] [PMC free article] [PubMed] [Google Scholar]
- 14. Choi SW, O’Reilly PF.. PRSice-2: polygenic risk score software for biobank-scale data. GigaScience. 2019;8:1–6. doi: 10.1093/gigascience/giz082 [DOI] [PMC free article] [PubMed] [Google Scholar]
- 15. Atkins JL, Jylhava J, Pedersen NL, et al. A genome-wide association study of the frailty index highlights brain pathways in ageing. Aging Cell. 2021;20:e13459. doi: 10.1111/acel.13459 [DOI] [PMC free article] [PubMed] [Google Scholar]
- 16. Candia J, Cheung F, Kotliarov Y, et al. Assessment of variability in the SOMAscan assay. Sci Rep. 2017;7:14248. doi: 10.1038/s41598-017-14755-5 [DOI] [PMC free article] [PubMed] [Google Scholar]
- 17. Sathyan S, Ayers E, Gao T, Milman S, Barzilai N, Verghese J.. Plasma proteomic profile of frailty. Aging Cell. 2020;19:e13193. doi: 10.1111/acel.13193 [DOI] [PMC free article] [PubMed] [Google Scholar]
- 18. Langfelder P, Horvath S.. WGCNA an R package for weighted correlation network analysis. BMC Bioinf. 2008;9:559. doi: 10.1186/1471-2105-9-559 [DOI] [PMC free article] [PubMed] [Google Scholar]
- 19. Kramer A, Green J, Pollard J Jr, Tugendreich S.. Causal analysis approaches in ingenuity pathway analysis. Bioinformatics. 2014;30:523–530. doi: 10.1093/bioinformatics/btt703 [DOI] [PMC free article] [PubMed] [Google Scholar]
- 20. Makary MA, Segev DL, Pronovost PJ, et al. Frailty as a predictor of surgical outcomes in older patients. J Am Coll Surg. 2010;210:901–908. doi: 10.1016/j.jamcollsurg.2010.01.028 [DOI] [PubMed] [Google Scholar]
- 21. Joseph B, Zangbar B, Pandit V, et al. Emergency general surgery in the elderly: too old or too frail? J Am Coll Surg. 2016;222:805–813. doi: 10.1016/j.jamcollsurg.2016.01.063 [DOI] [PubMed] [Google Scholar]
- 22. Rockwood K, Theou O.. Using the clinical frailty scale in allocating scarce health care resources. Can Geriatr J. 2020;23:210–215. doi: 10.5770/cgj.23.463 [DOI] [PMC free article] [PubMed] [Google Scholar]
- 23. Whitson HE, Duan-Porter W, Schmader KE, Morey MC, Cohen HJ, Colon-Emeric CS.. Physical resilience in older adults: systematic review and development of an emerging construct. J Gerontol A Biol Sci Med Sci. 2016;71:489–495. doi: 10.1093/gerona/glv202 [DOI] [PMC free article] [PubMed] [Google Scholar]
- 24. Peters S, Cosco TD, Mackey DC, Sarohia GS, Leong J, Wister A.. Quantifying physical resilience in ageing using measurement instruments: a scoping review. Physiother Can. 2022;0:e20200134. doi: 10.3138/ptc-2020-0134 [DOI] [PMC free article] [PubMed] [Google Scholar]
- 25. Andersen SL, Sebastiani P, Dworkis DA, Feldman L, Perls TT.. Health span approximates life span among many supercentenarians: compression of morbidity at the approximate limit of life span. J Gerontol A Biol Sci Med Sci. 2012;67:395–405. doi: 10.1093/gerona/glr223 [DOI] [PMC free article] [PubMed] [Google Scholar]
- 26. Ismail K, Nussbaum L, Sebastiani P, et al. Compression of morbidity is observed across cohorts with exceptional longevity. J Am Geriatr Soc. 2016;64:1583–1591. doi: 10.1111/jgs.14222 [DOI] [PMC free article] [PubMed] [Google Scholar]
- 27. Adams ER, Nolan VG, Andersen SL, Perls TT, Terry DF.. Centenarian offspring: start healthier and stay healthier. J Am Geriatr Soc. 2008;56:2089–2092. doi: 10.1111/j.1532-5415.2008.01949.x [DOI] [PMC free article] [PubMed] [Google Scholar]
- 28. Ayers E, Barzilai N, Crandall JP, Milman S, Verghese J.. Association of exceptional parental longevity and physical function in aging. Age (Dordr). 2014;36:9677. doi: 10.1007/s11357-014-9677-5 [DOI] [PMC free article] [PubMed] [Google Scholar]
- 29. Ayers E, Barzilai N, Crandall JP, Milman S, Verghese J.. Association of family history of exceptional longevity with decline in physical function in aging. J Gerontol A Biol Sci Med Sci. 2017;72:1649–1655. doi: 10.1093/gerona/glx053 [DOI] [PMC free article] [PubMed] [Google Scholar]
- 30. Newman JC, Milman S, Hashmi SK, et al. Strategies and challenges in clinical trials targeting human aging. J Gerontol A Biol Sci Med Sci. 2016;71:1424–1434. doi: 10.1093/gerona/glw149 [DOI] [PMC free article] [PubMed] [Google Scholar]
- 31. Schreier B, Rabe S, Schneider B, et al. Loss of epidermal growth factor receptor in vascular smooth muscle cells and cardiomyocytes causes arterial hypotension and cardiac hypertrophy. Hypertension. 2013;61:333–340. doi: 10.1161/HYPERTENSIONAHA.112.196543 [DOI] [PubMed] [Google Scholar]
- 32. Pareja M, Sanchez O, Lorita J, Soley M, Ramirez I.. Activated epidermal growth factor receptor (ErbB1) protects the heart against stress-induced injury in mice. Am J Physiol Regul Integr Comp Physiol. 2003;285:R455–R462. doi: 10.1152/ajpregu.00588.2002 [DOI] [PubMed] [Google Scholar]
- 33. Fang C-Y, Hsiao M.. FSTL3 promotes tumor cell proliferation, invasion, survival and associates with poor prognosis in colorectal cancer patients. FASEB J. 2020;34:1. doi: 10.1096/fasebj.2020.34.s1.04867 [DOI] [Google Scholar]
- 34. Kralisch S, Hoffmann A, Kloting N, et al. FSTL3 is increased in renal dysfunction. Nephrol Dial Transplant. 2017;32:1637–1644. doi: 10.1093/ndt/gfw472 [DOI] [PubMed] [Google Scholar]
- 35. Runhua M, Qiang J, Yunqing S, Wenjun D, Chunsheng W.. FSTL3 induces lipid accumulation and inflammatory response in macrophages and associates with atherosclerosis. J Cardiovasc Pharmacol. 2019;74:566–573. doi: 10.1097/FJC.0000000000000742 [DOI] [PubMed] [Google Scholar]
- 36. Chen D, Untaru R, Liu S, et al. Follistatin-like 3 (FSTL3) levels are increased in acute heart failure patients. Eur Heart J. 2021;42:1039. doi: 10.1093/eurheartj/ehab724.1039 [DOI] [Google Scholar]
- 37. Roh JD, Hobson R, Chaudhari V, et al. Activin type II receptor signaling in cardiac aging and heart failure. Sci Transl Med. 2019;11:eaau8680. doi: 10.1126/scitranslmed.aau8680 [DOI] [PMC free article] [PubMed] [Google Scholar]
- 38. Barzilai N, Atzmon G, Derby CA, Bauman JM, Lipton RB.. A genotype of exceptional longevity is associated with preservation of cognitive function. Neurology. 2006;67:2170–2175. doi: 10.1212/01.wnl.0000249116.50854.65 [DOI] [PubMed] [Google Scholar]
- 39. Sebastiani P, Song Z, Ellis D, et al. A metabolomic signature of the APOE2 allele. GeroScience. 2023;45:415–426. doi: 10.1007/s11357-022-00646-9 [DOI] [PMC free article] [PubMed] [Google Scholar]
Associated Data
This section collects any data citations, data availability statements, or supplementary materials included in this article.