

Summary
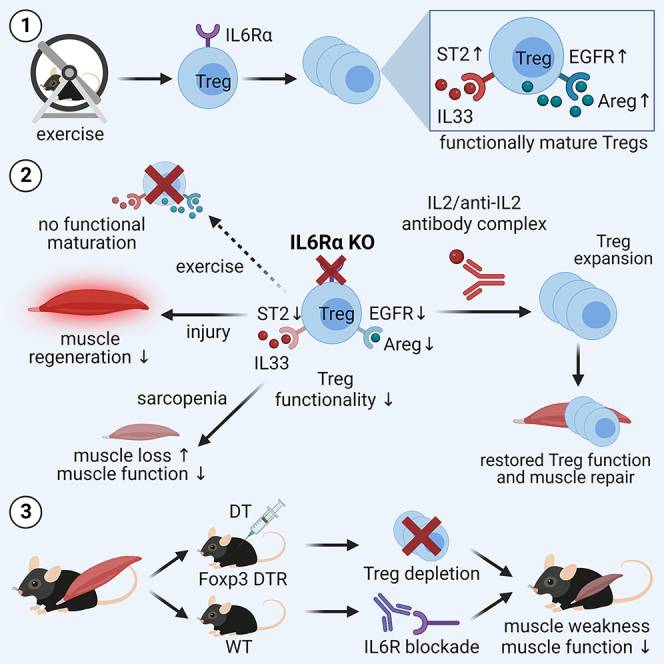
Muscle-residing regulatory T cells (Tregs) control local tissue integrity and function. However, the molecular interface connecting Treg-based regulation with muscle function and regeneration remains largely unexplored. Here, we show that exercise fosters a stable induction of highly functional muscle-residing Tregs with increased expression of amphiregulin (Areg), EGFR, and ST2. Mechanistically, we find that mice lacking IL6Rα on T cells (TKO) harbor significant reductions in muscle Treg functionality and satellite and fibro-adipogenic progenitor cells, which are required for muscle regeneration. Using exercise and sarcopenia models, IL6Rα TKO mice demonstrate deficits in Tregs, their functional maturation, and a more pronounced decline in muscle mass. Muscle injury models indicate that IL6Rα TKO mice have significant disabilities in muscle regeneration. Treg gain of function restores impaired muscle repair in IL6Rα TKO mice. Of note, pharmacological IL6R blockade in WT mice phenocopies deficits in muscle function identified in IL6Rα TKO mice, thereby highlighting the clinical implications of the findings.
Keywords: exercise, voluntary wheel running, tissue Tregs, immune tissue crosstalk, injury, muscle function, IL6Ra signaling, niche-specific Tregs, immunometabolism, immune-metabolic crosstalk
Graphical abstract
Highlights
-
•
Exercise induces a highly functional and stable muscle Treg phenotype
-
•
Tregs require IL6Rα signaling to control muscle function and regeneration
-
•
Pharmacological IL6R blockade provokes muscle weakness
Becker et al. discover that exercise induces muscle-residing Tregs through IL6Rα signaling. Mice lacking IL6Rα on T cells show defects in muscle Tregs upon exercise, more pronounced decline in muscle mass in sarcopenia, and impaired muscle regeneration following injury. Pharmacological IL6R targeting phenocopies these deficits, highlighting potential clinical implications for anti-IL6R therapies.
Introduction
The growing obesity pandemic is currently extending to a global health threat. The cardinal impact of obesity on population health is underscored by the critical contribution of obesity-related metabolic dysfunction as a risk factor for long-term cardiovascular complications. Overnutrition and especially the lack of physical activity are essentially involved in the pathogenesis of obesity and diabetes.1 Accordingly, caloric restriction and physiological interventions such as exercise training have proven to exert a variety of beneficial effects in the prevention and treatment of metabolic disorders.2,3
Despite these insights, our mechanistic understanding concerning the beneficial effects of exercise remains very limited. In particular, the molecular interconnections between muscle function, regulation of local immune responses, and exercise are currently largely undefined. This knowledge gap pertains to the impact of local immune regulation in the muscle and its crosstalk with muscle integrity, function, and regeneration. Therefore, the dissection of muscle-specific immune regulation together with muscle function, adaptation, and regeneration will be of pivotal importance to advance interventions toward niche-specific targeting of immune regulation in the future.
From an immunological point of view, a specific population of tissue regulatory T cells (Tregs) was recently identified in skeletal muscle that displayed a distinct T cell receptor (TCR) repertoire and a specific transcriptome.4,5,6 Tregs are characterized by the expression of CD4, CD25, and the transcription factor Foxp3, which functions as the master regulator for their development and function.7 In contrast to their counterparts residing in lymphoid tissues, Tregs in non-lymphoid tissues such as muscles were shown to exert key functions in the control and maintenance of tissue homeostasis, integrity, and function.4,5,6 Muscle Tregs possess high expression levels of amphiregulin (Areg), a member of the epidermal growth factor family whose receptor (epidermal growth factor receptor, EGFR) is expressed on immune cells and satellite cells (SCs) within the muscles.4 Areg has recently been demonstrated to play a central role in orchestrating both host resistance and tolerance mechanisms. Unlike other EGFR ligands, Areg binds with a low affinity to its receptor, and instead of causing receptor internalization, degradation, and negative feedback loops, it induces a sustained signal.8,9,10
In the context of muscle-immune crosstalk, IL6 functions as a critical myokine released in response to exercise.11,12 In contrast to its pro-inflammatory role in obesity-associated metabolic disease, intramuscular IL6 signaling upon exercise has been indicated to lack activation of pro-inflammatory pathways such as TNF-α and IL-1β but rather involves anti-inflammatory cytokines such as IL-10.13 Mechanistically, IL6 can exert signaling in the classical manner through the membrane-bound receptor IL6Rα followed by binding to the membrane-bound glycoprotein 130 (also known as gp130 and IL6Rβ). Additionally, trans-signaling through soluble sIL6R and trans-presentation mediated by dendritic cells (DCs) to a T cell in an antigen-specific manner14,15,16 contribute to the pleiotropic nature of IL6.
Despite these insights, it remains currently unknown whether exercise modulates muscle Tregs and their function as well as whether Tregs are required for the muscle response to exercise, from a metabolic perspective but also concerning muscle function, myogenesis, and repair mechanisms. Moreover, the molecular mechanisms of this immune regulation in muscles are unexplored. To answer these unknowns, we used T cell- and muscle-specific loss-of-function models including selective ablation of Tregs to show that Tregs control muscle function and that endurance exercise supports a stable induction of muscle-residing Foxp3+ Tregs with high functional activity. Mechanistically, we demonstrate that IL6Rα signaling on T cells is required for the increase of Foxp3+ Tregs and their functional adaptations following exercise and muscle injury. Underscoring the relevance of IL6Rα signaling for muscle-Treg cell interaction, we show that animals lacking IL6Rα on T cells (TKO) with induced muscle mass loss (sarcopenia) present with a significantly more pronounced decline in muscle function when compared to control mice. In addition, T cell-specific IL6Rα KO mice harbor significantly reduced frequencies of SCs and fibro-adipogenic precursor cells (FAPs) in the steady state and present with impairments in muscle regeneration and function upon muscle injury in vivo. Pharmacological IL6R targeting in wild-type (WT) mice phenocopies findings in IL6Rα TKO mice and indicates that anti-IL6R antibodies promote muscle weakness. These findings demonstrate a key function of an IL6Rα signaling axis on T cells to direct Treg-muscle crosstalk in order to control muscle function and regeneration.
Results
Oxidative soleus muscles harbor more Foxp3+ Tregs than glycolytic muscles
To assess the relevance of muscle-residing Tregs in controlling muscle function in response to exercise training, we first investigated their frequency in the sedentary steady state in relevant muscle fiber subtypes of male 16-week-old C57Bl/6J mice. In accordance with their metabolic characteristics, we focused on Musculus soleus (Sol, predominantly oxidative muscle fibers), Musculus extensor digitorum longus (EDL, predominantly glycolytic muscle fibers), Musculus tibialis anterior (TA), and Musculus gastrocnemius (GC, mixed muscle fibers). A set of exclusion markers permitted the direct identification of a CD4+ T cell subset purified from these four different muscles (Figure 1A; see also Figure S1A for full gating strategy). In combination with intracellular staining for Foxp3, the master transcription factor of Tregs, we identified the highest Treg frequencies in the oxidative Sol, when compared to mixed and predominantly glycolytic muscles (Figures 1B and 1C).
Figure 1.

Identification of CD4+ T cells and Foxp3+ Tregs in skeletal muscles and muscle response to exercise
(A and B) Representative fluorescence-activated cell sorting (FACS) plots of ex vivo muscle-residing (A) total CD4+ T cells and (B) CD4+Foxp3+ Tregs in musculus soleus (Sol), gastrocnemius (GC), tibialis anterior (TA), and extensor digitorum longus (EDL).
(C) Summary graph of ex vivo muscle-residing Tregs (% of CD4+ T cells) in different muscles in the steady state. For Sol and EDL, each point corresponds to two mice (4 muscles) pooled together.
(D) Gene expression analysis of Sol of sedentary (n = 6) and exercised (n = 3) WT mice subjected to voluntary wheel running for 10 days. Gene expression was normalized to histone H3.
Data are represented as bar graphs with all values and as mean ± SEM. For Sol and EDL, muscles of two mice were pooled. For all other data, each point is a biological replicate. Groups were compared by Student’s unpaired two-tailed t test (D) or one-way ANOVA followed by Tukey’s post hoc test for multiple comparisons (C). ∗p < 0.05, ∗∗p < 0.01, ∗∗∗p < 0.001.
See also Figure S1.
Voluntary wheel running induces myogenic factors and cytokines related to muscle repair
In order to dissect the involvement of Tregs in guiding muscle function in response to exercise training, we chose voluntary wheel running as a physiologically relevant, stress-free approach instead of forced treadmill running. To this end, male C57Bl/6J mice were randomized into sedentary and exercised groups. In a pilot experiment, mice remained sedentary or had access to wheels for 10 days to assess a more immediate impact of the exercise training. Mice were mainly active during the night phase of the day and showed higher activity after a few days of acclimatization to the wheels (activity profiles for individual mice are provided in Figure S1B).
To define exercise-responsive patterns related to muscle metabolism, myogenesis, and tissue repair, we performed gene expression analysis in Sol muscle. This short-term exercise training resulted in a significant induction of gene expression in markers relevant for myogenesis (including Myf5 and Myog; Figure 1D). In addition, Il6, a classical myokine, as well as Areg (that encodes Areg) mRNA expression were found to be significantly increased in response to exercise (Figure 1D). Metabolic markers including hexokinase 2 (Hk2) were not significantly altered on the mRNA level during this short-term period of exercise (Figure 1D), while previous studies using proteome analyses of muscles from mice subjected to long-term exercise training (20 weeks) suggested Hk2 and Slc4a2 (encoding Glut4) to be among the relevant exercise-responsive metabolic proteins.17
Endurance exercise alters metabolic parameters including body weight
Next, we aimed to understand the impact of muscle-residing Tregs in controlling muscle function with the goal to dissect muscle-Treg cell crosstalk in response to exercise. Therefore, we made use of an established exercise model using voluntary wheel running for 4 weeks (exercised group), which was for some groups followed by a longer resting phase (previously exercised group, “pre-ex”).18 First, we applied the identical experimental exercise scheme: 4 weeks of running followed by a 2-week resting phase. We evaluated succinate dehydrogenase (SDH) activity as an estimate of oxidative capacity and to assess a possible involvement of muscle deconditioning in this model in experimental groups. Voluntary wheel running for 4 weeks resulted in a mild but not significant increase in oxidative SDH+ muscle fibers when compared to sedentary animals as identified by stainings of cryosections from GC muscles (Figures S1C and S1D). After removing the wheels and a 2-week resting period, we identified no significant changes in SDH+ muscle fiber types (mean % SDH+ fiber, sedentary, 40.20%; exercised, 45.17%; pre-ex, 2 weeks post-exercise, 45.37%). After 4 weeks of rest, initial trends in SDH activity (pre-ex, 4 weeks post-exercise, 40.76%) returned to baseline again (Figure S1D).
Importantly, the immunological results of these experiments pointed toward the emergence of a muscular immune memory phenotype, which showed first indications after the 2-week resting phase. Specifically, the muscular immune memory phenotype revealed a significant increase in Foxp3+ Treg cells in the muscle and a mild enhancement in proliferating Ki67+ Tregs in the muscle after the 2-week resting time point (Figures S1E and S1F).
These findings (Figures S1C–S1F) prompted us to adapt the above indicated exercise scheme to 4 weeks of running followed by 4 weeks of resting (pre-ex; experimental study design in Figure 2A). This extended scheme allowed us to study the immunological impact as well as the muscle-immune cell crosstalk in response to exercise training in respective detail. Therefore, we defined the following experimental groups: male C57Bl/6J mice were randomized into sedentary, exercised, and pre-ex groups. The pre-ex mice were given access to the voluntary wheels for the first 4 weeks and the exercised mice had wheel access for the last 4 weeks only. Assessment of metabolic parameters was performed regularly during the entire study period. Specifically, body weights (BWs) were monitored and indicated that exercise resulted in a significant reduction in the cumulative delta BW (final delta BW; sedentary, 3.646 ± 1.189 g; exercise, 2.896 ± 2.075 g; pre-ex, 3.690 ± 0.776 g; difference in BW change upon exercise, sedentary versus pre-ex at time point 4 weeks, −0.59 g; sedentary versus exercise at time point 8 weeks, −0.75 g; Figure S1G). In addition, exercise resulted in a significant decline in visceral fat pad weights as compared to controls (Figure S1H), while no significant changes in muscle mass of exercised mice were identified (Figures S1I and S1J). Average running distance per day per cage was 16 km (Figure S1K), a distance that is in accordance with detailed recent assessments of voluntary wheel running patterns and physiological effects in C57BL/6J mice.19
Figure 2.

Exercise increases Treg frequencies in muscles and induces phenotypic maturation toward tissue Tregs
(A) Scheme of exercise studies indicating sedentary, exercised, and pre-ex groups.
(B) Representative FACS plots showing ex vivo CD4+Foxp3+ Tregs from Sol and GC in sedentary, exercised, and pre-ex WT mice. Pre-gated on live CD4+ T cells.
(C) Summary graph of ex vivo CD4+Foxp3+ Tregs from Sol and GC. For Sol, each point corresponds to two mice (four muscles) that were pooled.
(D–H) Summary graph for the ex vivo characterization of Tregs for proliferation: Ki67+Foxp3+ Tregs (D), Areg (E), EGFR (F), ST2 (G), or IL6Rα (H) expression in Sol or GC. For Sol, each point corresponds to two mice (four muscles) pooled.
Data are shown as bar graph with individual and mean ± SEM. For Sol, muscles of two mice were pooled. For all other data, each point is a biological replicate. Data were analyzed by one-way ANOVA followed by Tukey’s post hoc test for multiple comparisons (C–H). ∗p < 0.05, ∗∗p < 0.01, ∗∗∗p < 0.001.
See also Figures S1 and S2.
Endurance exercise induces Foxp3+ Tregs in muscles
To define the impact of exercise training on muscle-residing Treg frequencies, we purified Tregs directly from the Sol and GC muscles at the end of the 8-week experimental setup referring to the conditions sedentary, exercised, and pre-ex (Figures 2A and 2B; gating strategy for the analysis of Tregs is given in Figure S1L).
Ex vivo Treg frequencies in analyzed skeletal Sol and GC muscles were significantly increased upon exercise with maximum frequencies observed in pre-ex mice (Figures 2C, S2A, and S2B). The fact that muscle Tregs were most prominently increased in pre-ex animals highlights a stable induction of Tregs in response to exercise. Moreover, these findings indicate that Tregs are maintained upon exercise termination and therefore support the concept of an emerging muscular immune memory effect of exercise on muscle Tregs as indicated above (Figures 2C and 2D).
To dissect the maintenance of Tregs post-exercise termination, we first focused on assessing their proliferative potential. Analysis of the proliferation marker Ki67 demonstrated that post-exercise termination, pre-ex mice presented with a significant increase in the number of proliferating muscle-residing Tregs (Figure 2D). These findings indicate that the local muscular tissue environment upon exercise supports a specific expansion of muscle Tregs.
Exercise enhances Treg induction potential from naive CD4+ T cells
Next, we aimed to understand how broad the Treg-fostering impact of exercise is. Therefore, we asked the question of whether exercise could also modulate the potential of naive CD4+ T cells to be differentiated into Tregs, for instance by modulating the local microenvironment the naive T cells reside in. To this end, we employed established in vitro Treg differentiation protocols.20,21,22,23,24 Specifically, highly pure naive CD25−CD44lowCD4+ T cells from muscle-draining popliteal lymph nodes were used as a starting population. Importantly, Treg differentiation potential with naive CD4+ T cells from pre-ex mice was significantly increased when compared to the other experimental groups (Figure S2D). These findings suggest that exercise confers broad muscle-related Treg-fostering properties including Treg differentiation from naive CD4+ T cells.
The exercise-mediated induction of Foxp3+ Tregs involves Areg/EGFR/ST2 signaling
Next, we asked whether exercise training in addition to fostering Tregs in muscles will also impinge on their phenotypic characteristics and functional maturation to support tissue homeostasis. Specifically, given the critical role of Areg in supporting muscle integrity and repair, we analyzed Treg-specific Areg expression in all experimental groups (staining examples are provided in Figure S1J). Of note, in both Sol and GC muscles, Areg+Foxp3+ Tregs were found to be significantly increased in pre-ex mice (Figures 2E and S2C). As CD4+ T cells including Tregs become activated, they upregulate the EGFR, in part via STAT5-mediated signaling. It has been shown that Areg binds the EGFR with unusually low affinity25 and displays differential binding capacity for the EGFR in comparison to other EGFR ligands.26 These findings support the notion that Areg can mediate distinct biological outcomes compared to other EGF-like molecules. We observed an initial decline of EGFR+ Tregs directly after exercise termination in GC, while pre-ex animals revealed a significant increase in EGFR+ Tregs in both muscles (Figure 2F).
To understand whether the exercise-mediated cellular crosstalk involved local Tregs, we focused on ST2. ST2, the receptor for IL-33, is a transmembrane receptor and was shown to be strongly upregulated in tissue Tregs when compared to their lymphoid counterparts.27,28,29 Pre-ex mice presented with a distinct increase in ST2+ Tregs in GC muscles compared to sedentary and exercised mice (Figure 2G). ST2 levels were unchanged in Sol muscle of all three experimental groups. These findings again suggest that the muscle-specific metabolic sub-phenotypes related to oxidative versus mixed muscle fibers can impinge on (1) local Treg characteristics including proliferative potential as outlined above and (2) ST2 expression that is relevant for IL-33-mediated expansion (Figure 2G). Considering the importance of IL6 as a myokine in response to exercise, we assessed IL6Rα expression on T cells. T cells from pre-ex mice showed a significant increase in IL6Rα expression (Figure 2H). Taken together, we observe a strong pro-tolerogenic environment in the pre-ex muscle that leads to a phenotypic and functional maturation of muscle Tregs that involves Areg/EGFR/ST2 and IL6Rα signaling.
Treg depletion abolishes muscle-specific gene expression required for responses to exercise
Given the strong and durable increase of muscle Tregs in response to exercise, next we asked whether Tregs are actually required to control muscle gene expression as a response to exercise. Therefore, we employed Foxp3 DTR mice,30 which permit the diphtheria toxin (DT)-mediated depletion of Foxp3+ Tregs. Male Foxp3 DTR− and Foxp3 DTR+ animals both received DT injections (Figure S3A). As outlined in Figures 3A and 3B, DT application results in efficient Treg depletion in muscles from Foxp3 DTR+ mice (see Figure S3B for popliteal lymph node).
Figure 3.

Treg depletion critically impairs muscle function
(A) Representative FACS plots identifying muscle-residing CD4+Foxp3+ Tregs from muscles of Foxp3 diphtheria toxin receptor (DTR) mice, where DT treatment leads to specific depletion of Foxp3+ Tregs due to transgene expression of the DTR specifically in Tregs. Both Foxp3 DTR− and Foxp3 DTR+ littermates were treated with DT.
(B) Quantification of ex vivo Foxp3+ Tregs (% of CD4+ T cells) in muscle after DT treatment of Foxp3 DTR− versus Foxp3 DTR+ mice.
(C) Gene expression analysis of Sol muscle from DT-treated Foxp3 DTR− versus Foxp3 DTR+ mice. Gene expression was normalized to histone H3.
(D and E) Analysis of the citrate synthase activity in GC upon Treg depletion using DT in Foxp3 DTR mice.
(F and G) Cross-sectional area analysis of GC muscle upon Treg depletion using DT in Foxp3 DTR mice. Scale bar (yellow), 100 μm.
(H) Maximal grip strength of Foxp3 DTR mice before Treg depletion (d0) and 7 days after Treg depletion (d7).
Data are shown as bar graphs with mean ± SEM and were analyzed by Student’s unpaired two-tailed t test (B–E and H) or two-way ANOVA with Šidák post hoc test for multiple comparisons (G). ∗p < 0.05, ∗∗p < 0.01, ∗∗∗p < 0.001.
See also Figure S3.
Mechanistically, selective ablation of Tregs in the muscles results in a significant reduction of muscle-specific gene expression required for metabolic (Hk2, Ckmt2, and Cpt1b) and myogenic responses (Myf5 and Pax7) to exercise (Figure 3C). These findings indicate that local Tregs guide muscle function by controlling the expression and responsiveness of exercise-relevant genes.
Treg deletion impairs muscle function
Next, we aimed to dissect the physiological relevance of Treg ablation for muscle function. Acute Treg depletion did not induce muscle fiber-type switching (Figures S3D–S3F). To specifically address the question of whether Treg ablation impinges on muscle function required for responding to exercise training, we assessed the enzymatic activity of citrate synthase in muscles upon Treg depletion. Citrate synthase functions as a key regulatory enzyme and metabolic marker in assessing oxidative and respiratory capacity in muscles. Citrate synthase activity is also used as a biochemical marker of the skeletal muscle oxidative adaptation in response to a training intervention, and several studies suggested that citrate synthase activity increases in response to exercise training.31 Importantly, Treg ablation resulted in a significant decline of citrate synthase activity in muscles (Figures 3D and 3E), indicating a reduction in muscle function in the absence of local Tregs. In line with the observed reduction in citrate synthase activity upon Treg depletion, muscles from Treg-ablated animals presented with trends toward lower mitochondrial respiration capacity as indicated by protein analyses of oxidative phosphorylation (OXPHOS) complexes (Figure S3C). Furthermore, trends toward a reduction in muscle cross-sectional area upon Treg depletion were observed (Figures 3F, 3G, and S3G).
To study the importance of Treg cells for muscle function in a more direct manner, we leveraged a murine muscle grip strength test (four-limb grip strength using BioSeb GS3 and Bio-CIS) before and after selective ablation of Tregs. Of note, Treg depletion promoted a significant decline of maximal muscle grip strength (Figure 3H). These findings underscore a critical role of local Tregs in controlling muscle function and the ability to respond to exercise.
Exercise-mediated induction of muscle Tregs is partially dependent on the myokine IL6
In light of the key involvement of Tregs in directing muscle function in response to exercise, we next aimed to dissect the Treg-muscle crosstalk in response to exercise mechanistically. Specifically, given the prominent upregulation of Il6 mRNA expression in response to voluntary wheel running as shown in Figure 1D, next we aimed to understand whether the exercise-induced Treg enhancement is mediated by the myokine IL6. In line with that concept, muscle-derived IL6 upon exercise has been indicated to not involve activation of classical pro-inflammatory pathways such as TNF-α and IL-1β but to rather support anti-inflammatory cytokines such as IL-10.13 Despite these insights, the role of muscle-derived IL6 in controlling local Tregs in response to exercise remains undefined. To answer this question, we employed a loss-of-function model with mice lacking IL6 in myofibers.32,33 Specifically, muscle fiber-specific IL6KO mice were generated using Myl1 Cre mice,33 which express a Cre recombinase from the skeletal muscle-specific myosin light chain promoter (MLC), and Il6 fl/fl mice, thus targeting myofibers but no other cell types in skeletal muscle. The muscle fiber-specific deletion of IL6 was confirmed by genotyping using PCR for Myl1 Cre and Il6 fl/fl alleles (Figure S4A). Furthermore, the muscle-specific KO was validated by analyzing Il6 expression in muscles by qPCR, while visceral adipose tissue and liver were used as control where no difference in Il6 expression was detected (Figure S4B).
Physiologically, assessment of running profiles showed no significant differences in running distance between muscle fiber-specific IL6KO and respective floxed control animals (Figure S4E). In sedentary animals, we observed a significant BW difference between muscle IL6KO mice and floxed control mice (Figure S4C); this difference in BW disappeared upon pre-ex (Figure S4C). Visceral adipose tissue mass was slightly reduced in the pre-ex groups regardless of genotype compared to sedentary groups (Figure S4D).
Of note, in the absence of muscle fiber-derived IL6, the increase of muscle-residing Tregs in the pre-ex state was similar to IL6-competent floxed controls (Figures 4A and 4B). These findings indicate that the presence of the myokine IL6 per se in muscle is not essentially required in driving the increase of muscle Tregs post-exercise. However, in the absence of muscle fiber-derived IL6, (pre-)exercise did not induce local Treg proliferation as assessed by Ki67 staining in the muscle (Figure 4C). These results suggest that in addition to local Treg expansion upon exercise, other mechanisms such as Treg induction and/or recruitment do contribute to the exercise-mediated increase in muscle Tregs.
Figure 4.

Pro-tolerogenic impact of exercise is abolished in the absence of IL6/IL6Rα-mediated crosstalk between muscles and T cells
(A and B) Representative FACS plots and summary graph identifying ex vivo muscle-residing CD4+Foxp3+ Tregs from GC muscle of IL6KO mice (Myl1 Cre/WT × Il6 fl/fl) and IL6 floxed/floxed controls in sedentary and pre-ex state.
(C–F) Summary graph showing ex vivo Treg proliferation (C, Ki67+Foxp3+ Tregs; D, ST2+Foxp3+ Tregs; E, Areg+Foxp3+ Tregs; and F, EGFR+Foxp3+ Tregs) in GC of IL6KO mice and IL6 floxed/floxed controls in sedentary and pre-ex state.
(G and H) Ex vivo (G) CD4+Foxp3+ Tregs and (H) ST2+Foxp3+ Tregs in Sol and GC from IL6Rα TKO (Cd4 Cre/WT × Il6ra fl/fl) and floxed control mice in the steady state.
(I) Representative FACS plots of Foxp3+ Tregs in IL6Rα TKO versus floxed control mice in sedentary and pre-ex state in GC.
(J) Summary graph showing the ex vivo Foxp3+ Treg frequencies in IL6Rα TKO and floxed control mice of sedentary and pre-ex mice in GC.
(K–N) Summary graph representing ex vivo Treg proliferation (K, Ki67+Foxp3+ Tregs; L, ST2+Foxp3+ Tregs; M, Areg+Foxp3+ Tregs; and N, EGFR+Foxp3+ Tregs) in GC of IL6Rα TKO and floxed control mice in sedentary or pre-ex state.
(O) Four-limb max grip strength of IL6Rα TKO and floxed control mice subjected to DSS-induced sarcopenia. ##p < 0.01 for IL6Rα floxed mice compared to day 0.
(P and Q) Ex vivo analysis of SCs and FAPs in Sol and GC muscles of IL6Rα TKO and floxed control mice in the steady state.
(R) Cross-sectional area analysis of GC muscle of pre-ex IL6Rα TKO and floxed control mice.
Data are shown as bar graphs with individual values and as mean ± SEM. For analyses of Sol, the muscles of two mice were combined into one sample. For all other samples, each point refers to a biological replicate. Data were analyzed by Student’s unpaired two-tailed t test (G, H, and R) or two-way ANOVA followed by Tukey’s post hoc test for multiple comparisons (B–F and J–R). ∗p < 0.05, ##,∗∗p < 0.01, ∗∗∗p < 0.001.
See also Figures S4 and S5.
In light of the exercise-induced increase of Treg percentages despite the lack of myofiber-derived IL6 (Figure 4B), we asked whether IL6 is required for the enhancement of functional Treg maturation following exercise. Importantly, the lack of the myokine IL6 led to the absence of a pre-ex-specific upregulation of Areg, EGFR, and ST2 in Foxp3+ Tregs (Figures 4D–4F). Therefore, these findings show that myofiber-derived IL6 is involved in guiding the upregulation of muscle-tissue Treg characteristics and their function. In addition, these results support the view of an important layer of crosstalk between IL6 and Areg/EGFR-ST2 signaling and their integration in guiding muscle-residing Treg function and maturation upon exercise.
Exercise-mediated induction of muscle Tregs requires IL6Rα signaling
We showed that the absence of muscle fiber-derived IL6 did not abolish the Treg-fostering potential of exercise; however, IL6 from myofibers was required to boost Treg functional maturation exerted by Areg/ST2/EGFR signaling. Therefore, next we aimed to dissect the molecular interface that can integrate the Treg-fostering potential upon exercise in muscle. To this end, we focused on IL6 receptor signaling in muscle Tregs. From a tissue-crosstalk perspective, exercise training has been demonstrated to increase IL6Rα expression on skeletal muscles.13,34 As shown in Figure 2H, assessments of IL6R signaling in muscle Tregs revealed a significant enhancement of IL6Rα expression in Tregs from GC muscles of pre-ex mice.
Based on the regulation of IL6Rα expression in muscle-residing Tregs in response to exercise, we next asked the question of whether expression of IL6Rα on T cells is a prerequisite to respond to the exercise-mediated Treg induction. To dissect this mechanistically, we employed a T cell-specific loss-of-function model. Specifically, we studied mice with a T cell-specific deficiency of the high-affinity IL6 receptor α chain (Cd4 Cre × Il6ra fl/fl).35,36 To generate mice with a T cell-specific IL6Rα loss of function, we crossed mice hemizygous for a transgene in which transcription of the Cre recombinase is controlled by the Cd4 promoter (Cd4Cre)37 with mice homozygous for LoxP-flanked Il6ra alleles.38 The T cell-specific deletion of IL6Rα was confirmed by genotyping by PCR (Figure S5A) and reconfirmed by flow cytometric staining of IL6Rα on CD4+ T cells from lymph nodes (Figure S5B).
While frequencies of Foxp3+ Tregs in muscles of IL6Rα TKO animals were not different when compared to floxed control animals in the steady state (Figure 4G), we observed a significant reduction of Tregs with a tissue phenotype in T cells lacking IL6Rα as assessed by ST2 and Foxp3 expression (Figure 4H). These findings suggest an impact of IL6Rα signaling in shaping the muscle Treg signature.
Next, we employed the pre-ex scheme to IL6Rα TKO versus floxed control animals. Analyses of running profiles revealed no significant differences between IL6Rα TKO and floxed control mice in the running distances (Figure S5C). Additionally, we did not find significant alterations in BW and fat mass between sedentary and pre-ex IL6Rα TKO groups and also between sedentary and pre-ex floxed control groups (Figures S5D and S5E). Consistent with our aforementioned results, pre-ex floxed control mice presented with a significant increase in muscle-residing Tregs (Figures 4I and 4J). In contrast to that, the exercise-mediated enhancement of muscle Tregs was completely absent in mice with a T cell-specific loss of IL6Rα (Figures 4I and 4J). In line with an absence of the exercise-induced increase in muscle Tregs in T cells lacking IL6Rα, we did not observe any significant changes in Ki67+Foxp3+ Tregs in pre-ex IL6Rα TKO animals. Tregs from floxed controls of pre-ex animals revealed trends toward upregulation in proliferating Tregs within muscles (p = 0.08; Figure 4K). These findings indicate that proliferation of local Tregs as assessed by Ki67 positivity is not the single contributor to the identified significant difference between pre-ex floxed control and IL6Rα TKO mice in Foxp3+ Tregs (Figures 4I and 4J).
More importantly, from a mechanistic and phenotypic perspective, pre-ex IL6Rα TKO animals completely lacked the induction of Areg+, EGFR+, and ST2+Foxp3+ Tregs in the pre-ex state when compared to floxed control mice (Figures 4L–4N). These results indicate that the presence of IL6Rα on T cells is required for the exercise-mediated induction of muscle Tregs and their enhancement of functional activity including Areg, EGFR, and ST2.
Local Treg-mediated control of muscle function is impaired in IL6Rα TKO mice
Our data so far indicate that Treg ablation critically abrogates muscle function as assessed by analyses of gene expression, citrate synthase activity, and protein assessment of OXPHOS complexes and directly by defining maximal muscle grip strength (Figures 3H and S3C). To integrate these findings with our observation that IL6Rα signaling on T cells is required for the exercise-mediated induction of Tregs, we next thought to validate the functional importance of Tregs and IL6Rα signaling in controlling muscle adaptation and function in an independent model. Conceptually, we have chosen a model of skeletal muscle mass reduction since studies with specific Treg depletion promoted a significant impairment in muscle grip strength as indicated above. Specifically, in the next step we selected dextran sodium sulfate (DSS)-induced colitis as an established model of inflammation-induced muscle atrophy/sarcopenia.39 This mouse model reflects local, colorectal inflammation and systemic inflammation, thereby promoting a loss of skeletal muscle mass that was shown to resemble sarcopenia on both morphological and molecular levels.39 We induced sarcopenia in IL6Rα TKO versus floxed control animals (see scheme in Figure S5H for details). First, we assessed SDH activity to estimate oxidative capacity in respective experimental animals. We did not see any significant differences in SDH+ fibers of steady-state CD4 IL6Rα floxed versus TKO mice (p = 0.643). Furthermore, DSS-induced sarcopenia induced a mild trend toward reduced SDH+ fibers in GC of IL6Rα TKO mice that did not reach statistical significance (p = 0.0865 for steady-state floxed mice versus DSS sarcopenia floxed mice; p = 0.0954 for DSS sarcopenia in IL6Rα TKO versus floxed mice; Figures S5J and S5K).
To link the immunological features seen in IL6Rα TKO animals as detailed above with muscle function, we performed grip strength measurements in this model of muscle mass loss. Of note, upon sarcopenia induction, IL6Rα TKO animals showed a significantly more prominent decline in maximal muscle grip strength when compared to floxed control animals (Figure 4O). These findings underline a critical involvement of T cell-specific IL6Rα expression in mediating the impact of local Tregs on controlling muscle function as seen here in states of inflammation-induced muscle mass loss.
Local Treg-mediated control of muscle regenerative potential is impaired in IL6Rα TKO animals
Until now, we have established a direct impact of local Tregs on muscle function, which is mechanistically controlled by T cell-specific IL6Rα expression. Next, we aimed to understand whether T cell-specific IL6Rα expression likewise impinges on cellular components mediating muscle regeneration. Muscle regeneration is comprised of a dynamic network including, among others, SCs and FAPs. Specifically, SCs are mainly responsible for muscle regenerative capacity by differentiating into myofibers and self-renewal to preserve the SC pool. As mesenchymal stromal cells, FAPs support SC differentiation during tissue regeneration.40,41 Analyses of both SCs and FAPs were performed using multi-color flow cytometry. SCs were identified as Itga+Sca1− (% of CD31−CD45− cells) and FAPs as Itga−Sca1+ (% of CD31−CD45− cells; staining examples in Figure S5L). As detailed above, muscle Tregs harbor impairments in functional maturation in IL6Rα TKO mice. In order to assess consequences of this deficiency, we analyzed frequencies of SCs and FAPs in the steady state in these mice. We found that IL6Rα TKO mice presented with significantly reduced frequencies of SCs and FAPs, especially in Sol (Figures 4P and 4Q), the muscle that has the highest density of SCs and, thus, likely the highest susceptibility to changes in tissue homeostasis.42 Pre-ex IL6Rα TKO animals presented with a significantly reduced cross-sectional area in muscle (Figures 4R, S5M, and S5N). These findings demonstrate a diminished muscle regenerative potential in mice lacking IL6Rα signaling in T cells and underscore the critical involvement of Treg-muscle crosstalk in controlling muscle adaptation, function, and regeneration.
Tregs require IL6Rα signaling to control muscle regenerative capacity upon sterile injury
Having observed an impairment in functional maturation upon exercise in muscle Tregs from IL6Rα TKO mice that was accompanied by reduced SC and FAP frequencies, we performed a muscle injury model to challenge the immune-muscle crosstalk to a greater extent. Therefore, in line with established procedures,43 glycerol was injected into the muscle of floxed control animals or IL6Rα TKO mice (Figure 5A). Flow cytometric analyses 4 days post-injury (dpi) indicated a significant reduction in SC frequencies in the injured muscles of IL6Rα TKO mice (Figures 5B, 5C, and S6A). Frequencies of infiltrating macrophages (MPs) did not change (Figure 5B), but anti-inflammatory MPs were shown to be involved in the later phases of skeletal muscle regeneration and are shifting from a pro-inflammatory Ly6C+ to either anti-inflammatory Ly6C− or CD206+ MPs.44,45 In our model, the MP polarization was skewed toward fewer CD206+ MPs in IL6Rα TKO mice (Figure S6D), but no differences were observed when gating on Ly6C (Figure S6E), highlighting that the differences observed resulted from alterations in Treg function and only to a minor extent from MP changes. In line with the observed reduction in SC frequencies post-injury, mice with T cell-specific loss of IL6Rα showed significantly reduced cross-sectional area of injured TA muscles 14 dpi (Figure 5D). These findings highlight the importance of IL6Rα signaling on T cells to guarantee functional Treg maturation and to support repair and restoration of muscle homeostasis upon injury.
Figure 5.

Mice with T cell-specific loss of IL6Rα have significantly impaired muscle regeneration upon injury
(A) Scheme of the muscle injury model. Injury was induced by intramuscular (i.m.) injection of 2 × 12.5 μL glycerol into TA muscle in IL6Rα TKO and floxed control mice.
(B and C) FACS analysis identifying ex vivo macrophages (MPs), FAPs, endothelial cells (ECs), and SCs upon muscle injury in IL6Rα TKO and floxed control mice 4 days post-injury.
(D) Analysis of the cross-sectional area of TA muscle upon muscle injury in IL6Rα TKO and floxed control mice 14 days post-injury. Scale bar (yellow), 100 μm.
Data are shown as bar graphs with individual values and as mean ± SEM. Each point refers to a biological replicate. Data were analyzed by Student’s unpaired two-tailed t test (B–D) or two-way ANOVA with Šidák post hoc test for multiple comparisons (D). ∗p < 0.05, ∗∗p < 0.01, ∗∗∗p < 0.001.
See also Figure S6.
Recovery of Tregs upon depletion reinstates muscle function
Next, we aimed to understand whether the recovery of Tregs in the above detailed Foxp3 DTR mouse model30 would be sufficient to foster re-gain of muscle function. To this end, we first depleted Tregs using DT application (Figure 6A). In line with the findings detailed above, Treg depletion caused a significant reduction in muscle function when compared to day 0 before Treg depletion as assessed by muscle grip strength measurements (Figure 6B). Of note, endogenous repopulation with Tregs (Treg recovery) was sufficient to foster a re-gain of muscle function to levels not statistically different from day 0 before Treg depletion (Figure 6B). These results indicate an important contribution of local Tregs in controlling muscle strength.
Figure 6.

Treg expansion using anti-IL2/IL2 antibody complexes restores muscle regenerative capacity in IL6Rα TKO mice
(A and B) Scheme of the Treg recovery experiment using Foxp3 DTR+ mice. Max grip strength (g) was assessed once a week.
(C) Scheme of the gain-of-function model where Treg expansion is induced by three i.p. injections of anti-IL2/IL2 antibody complexes in IL6Rα TKO mice or floxed controls.
(D) Foxp3+ Treg frequencies in peripheral blood at the indicated time points upon Treg expansion.
(E–G) Representative FACS plots (E) and quantification of SCs (F) and FAPs (G) in Sol and one GC upon Treg expansion in IL6Rα TKO versus floxed mice. In contrast to Figure 4, all isolations were done with only 1 GC muscle being used for flow cytometric analyses.
Data are shown as bar graphs with individual values and as mean ± SEM. Each point refers to a biological replicate. One- (B, F, and G) or two-way ANOVA (D and G) with Šidák post hoc test for multiple comparisons. ∗p < 0.05, ∗∗p < 0.01; ns, p > 0.05.
Treg expansion using anti-IL2/IL2 antibody complexes in IL6Rα TKO mice is sufficient to restore resting state muscle
To address the question of whether the muscle repair defects observed in IL6Rα TKO mice (Figure 4) can be rescued, we performed gain-of-function experiments and Treg expansion using anti-IL2/IL2 antibody complexes. To this end, 6 μg anti-IL2/IL2 antibody complexes were injected intraperitoneally (i.p.) every other day into IL6Rα TKO or floxed control mice46 (see Figure 6C for experimental scheme). Tregs from IL6Rα TKO and floxed control mice showed comparable Treg expansion kinetics upon anti-IL2/IL2 antibody injections in peripheral blood (Figure 6D). Again, supporting the relevance of Treg-muscle crosstalk, we observed that Treg expansion fully restored the reduced SC and FAP frequencies in muscles from IL6Rα TKO to levels in floxed control mice after 14 days of Treg expansion (Figures 6E–6G).
Pharmacological IL6R targeting impairs muscle function in WT mice
In light of the above-described phenotype on impairments in muscle function using functional models in IL6Rα TKO mice, next we thought to assess possible clinical implications of these findings. Specifically, IL6R targeting antibodies such as tocilizumab used in the treatment of various autoimmune diseases have been associated with muscle weakness. To approach this experimentally, WT mice received either an isotype-control antibody or a specific anti-IL6R antibody for a time course of 4 weeks (experimental scheme detailed in Figure 7A). We employed muscle grip strength tests to define possible impairments in muscle function once per week (Figures 7B and S7A–S7F). Importantly, during the treatment course, animals receiving anti-IL6R antibodies showed trends toward a reduction of muscle strength already at day 14 and day 21 post-treatment start. Following a 4-week application scheme, animals receiving anti-IL6R antibodies demonstrated an ∼25% decline of initial muscle strength and thereby presented with a significant reduction in muscle function when compared to mice receiving isotype-control antibodies. These results indicate the development of muscle weakness upon pharmacological IL6R targeting and are in accordance with the findings on impairments in muscle function in IL6Rα TKO as detailed above.
Figure 7.

Pharmacological IL6R targeting impairs muscle function in WT mice
(A) Scheme for pharmacological IL6R targeting in WT mice. Anti-IL6R or control mAb was injected twice per week. Grip strength measurements were performed once a week.
(B) Grip strength measurements of (A).
Data are shown as bar graphs with individual values and as mean ± SEM. Each point refers to a biological replicate. Two-way ANOVA with Šidák post hoc test for multiple comparisons (B). ∗p < 0.05, ##p < 0.01.
See also Figure S7.
Discussion
The findings presented here demonstrate a critical role of muscle-residing Tregs in shaping muscle function, adaptation, and repair. Specifically, and from an immunological point of view, we show that exercise training potently induces a stable population of Tregs in muscles. Of note, Tregs in muscles induced by exercise are maintained post-exercise termination as evidenced by maximum frequencies seen in pre-ex mice. Therefore, these data highlight a key role of local Tregs in the regulation of muscle function in response to exercise training. Accordingly, we show that selective ablation of Tregs in the muscles evokes a significant reduction of muscle-specific gene expression required for metabolic and myogenic responses to exercise. Specifically, in the acute absence of Tregs in muscles, exercise-relevant metabolic gene expression, but also factors relevant for myogenesis and muscle repair, were significantly reduced. More importantly, Treg depletion promoted a significant reduction in muscle function. In line with this observation, Treg repopulation can restore muscle function. Therefore, these results underscore a critical impact of muscle-residing Tregs in controlling muscle function and adaptation to exercise.
A key finding of this study is the identification of IL6Rα expression on T cells as the molecular interface that is required for the Treg-mediated control of muscle function, adaptation, and repair. To validate the relevance and robustness of IL6Rα signaling in T cells for mediating these non-canonical Treg functions in muscles, we have chosen three models that—from a muscular perspective—are highly different and rely on distinct mechanisms. Specifically, we have selected exercise as detailed above, inflammation-induced muscle mass loss (sarcopenia), and sterile muscle injury, which will be discussed below. We studied the model of sarcopenia to dissect the (patho)physiological relevance of the impaired muscle Treg frequencies and characteristics in IL6Rα TKO mice on muscle function. Critically, IL6Rα TKO animals presented with a significantly more prominent reduction in muscle function when compared to floxed animals. From a muscle physiology point of view, in the models of exercise and sarcopenia, we did not identify significant changes in SDH activity in pre-ex mice or in animals following sarcopenia induction. Therefore, these data argue against a critical contribution of muscle de-conditioning in driving the biological response in these experimental settings.
From an immunological perspective, these results indicate an important contribution of muscle-Treg cell crosstalk in response to exercise and sarcopenia and reveal that this crosstalk is dependent on IL6Rα signaling in T cells. Accordingly, we show that in IL6Rα TKO animals, the beneficial effects of exercise on Treg frequencies and their functional maturation based on Areg, EGFR, and ST2 expression are fully abolished. Moreover, these results using IL6Rα TKO mice demonstrate that the classical IL6 signaling integrates these Treg-fostering features of exercise. These data also indicate that trans-signaling, which is still functional in T cell-specific IL6Rα KO animals and is initiated by binding of IL6 to sIL6R, followed by the binding of the sIL6R-IL6 complex to gp130, does not substantially contribute to the exercise-mediated induction of muscle Tregs. In addition, the present findings underscore an important interconnection and crosstalk with Foxp3, Areg, EGFR, and ST2 signaling in muscle Tregs. In line with this concept, previous studies have highlighted crosstalk of signals between EGFR and IL6R.47,48 Furthermore, muscle fiber-specific IL6 KO animals maintain the muscle-Treg enhancement following exercise; however, in this loss-of-function model the functional maturation of Tregs is significantly reduced as assessed by the lack of ST2 and EGFR induction on Tregs in response to exercise. IL6 production has been observed in almost all cells present in skeletal muscle.49 In particular, during muscle regeneration, IL6 secretion is induced in FAPs and MPs as a key source of this cytokine to promote SC proliferation and differentiation.40,50 Since our mouse model only ablates the Il6 gene in myofibers, we conclude that this source is a key element in exercise-related muscle T cell phenotypes. Therefore, these findings suggest that muscle fiber-derived IL6 is not the only modulator of IL6Rα downstream signaling upon exercise but critically involved in local Treg cell functional maturation.
In addition, it has been suggested that the binding of IL6R with EGFR prolongs IL6R-induced signal transducer and activator of transcription 3 (STAT3) activation.51 In accordance and in light of our findings demonstrating a critical requirement of IL6Rα signaling in T cells to mediate Foxp3 induction upon exercise in muscle Tregs, previous reports showed a direct role of STAT3 in the maintenance of the Treg phenotype and their function.52 Moreover, Foxp3 can act as a co-transcription factor with STAT3, thereby enhancing IL-10 gene transcription in tumor-induced Tregs.53 Furthermore, several signal intermediates were found to induce the production of Areg, which further activates the EGFR.8 Here, IL-33, the ligand for the ST2 receptor, was reported recently to be produced in skeletal muscle upon different exercise schemes.54 In line with this concept, previous work from Dietmar Zaiss’ group suggested an important contribution of a signaling complex between EGFR and ST2 in Th2 cells accompanied by IL-33-induced EGFR-mediated signaling.10
Given the observed reduced muscle regenerative potential in IL6Rα TKO mice in the steady state, as another independent approach we employed a sterile muscle injury model to define the importance of T cell-specific IL6Rα in mediating a role of local Tregs in muscle repair. Importantly, IL6Rα TKO animals showed significant impairments in muscle repair and regeneration when compared to floxed control animals. In accordance with the impaired muscle regenerative potential in IL6Rα TKO mice, anti-inflammatory MPs were also demonstrated to impact muscle regenerative capacity.44,45 Therefore, in addition to the identified reductions in Areg expression on Tregs from IL6Rα TKO mice, limitations in Areg accessibility and successive production of these MPs might further exacerbate the observed defective muscle regeneration and repair following injury in IL6Rα TKO mice. In keeping with this hypothesis, a recent study by Minutti et al.55 provides a mechanism by which macrophage-derived Areg supports tissue repair. Specifically, Areg was demonstrated to induce TGF-β activation on pericytes following tissue injury, thereby leading to re-vascularization and wound healing.55
Underscoring the importance of muscle-Treg crosstalk in controlling muscle repair and regeneration, we used Treg gain of function to show that Treg expansion fully restored the reductions in SCs and FAPs in muscles from IL6Rα TKO to levels observed in floxed control mice.
Importantly, pharmacological IL6R targeting employing specific antibodies (e.g., tocilizumab) is used in a variety of clinical settings including the treatment of auto-inflammatory diseases and has been associated with side effects that comprise the development of inflammation and weakness of the muscles. In line with this concept, we show here that pharmacological anti-IL6R targeting promotes muscle weakness in WT mice. Therefore, the identification that T cell-specific IL6Rα expression is required for the Treg-mediated control of muscle function also has clinical implications. Specifically, our results can provide a possible mechanistic explanation for the development of this side effect in response to anti-IL6R treatment regimens. It is of interest to note that in settings of ongoing infections that are accompanied by an inflammatory muscle phenotype such as muscle wasting,56 as well as in necrotizing myopathies, anti-IL6R antibodies have also shown beneficial effects directly in the muscle.57 These findings suggest a context-dependent effect of anti-IL6R antibodies in inflammatory diseases with or without a direct involvement of muscular inflammation.
In sum, using selective Treg ablation, Treg gain of function, exercise training, sarcopenia induction, and a muscle injury model, we identify IL6Rα expression on T cells as the molecular interface mediating Treg-based control of muscle function, adaptation, and repair. The findings presented are of clinical relevance in light of the association of anti-IL6R treatment with the development of muscle weakness. The functional specialization of Tregs in non-lymphoid tissues as shown here for the context of Tregs in muscle warrants the future optimization of application strategies that will permit a niche- and/or context-specific targeting of these relevant immune cells. Such context-specific targeting will help avoid side effects induced by systemic application as discussed for tocilizumab. Therefore, the results of this study highlight the relevance of dissecting muscle-specific immune regulation and will be of importance for the design of precision medicines targeting niche-specific Tregs in the future.
Limitations of the study
One important limitation of our study is that exercise experiments were only performed in male mice. Future studies will be needed to understand whether the kinetics of muscle Treg responses to exercise, glycerol injury, and Treg maturation in female mice are comparable to the findings obtained in male mice. For most exercise experiments, mice were double housed to avoid stress induced by single housing since high stress and cortisol levels can directly affect the immune system. In combination with the physiological approach of voluntary wheel running, in this experimental setup it was not possible to individually track the activity per single mouse (but only per cage/two mice). Experiments using anti-IL6R antibodies have the limitation of lacking specificity to target only IL6R on muscle-residing CD4+ T cells or Tregs; however, anti-IL6R antibodies as such are given as therapeutics in the clinic, highlighting the relevance of the here-described findings.
STAR★Methods
Key resources table
| REAGENT or RESOURCE | SOURCE | IDENTIFIER |
|---|---|---|
| Antibodies | ||
| Amphiregulin Biotin | R&D Systems | Clone: BAF989; Cat# BAF989; RRID: AB_2060662 |
| Anti-mouse IL2, functional grade | Thermo Fisher Scientific | Clone: JES5-1A12; Cat# 16-7022-85; RRID: AB_469207 |
| Anti-Total OXPHOS Rodent cocktail | abcam | Cat# ab110413; RRID: AB_2629281 |
| B220 Pacific Blue | BioLegend | Clone: RA3-6B2; Cat# 103227; RRID: AB_492876 |
| CD11b FITC | eBioscience | Clone: M1/70; Cat# 11-0112-85; RRID: AB_464936 |
| CD11b Pacific Blue | BioLegend | Clone: M1/70; Cat# 101224; RRID: AB_755986 |
| CD11 b PE | eBioscience | Clone: M1/70; Cat# 12-0112-81; RRID: AB_465546 |
| CD11c Brilliant Violet 421 | BioLegend | Clone: N418; Cat# 117330; RRID: AB_11219593 |
| CD126 (IL6Ra) PE | Miltenyi | Clone: REA620; Cat# 130-109-625; RRID: AB_2654815 |
| CD14 V450 | BD Biosciences | Clone: rmC5-3; Cat# 560639; RRID: AB_1727429 |
| CD206 (MMR) APC | BioLegend | Clone: C068C2; Cat# 141707; RRID: AB_10896057 |
| CD25 PerCP-Cy5.5 | BioLegend | Clone: PC61; Cat# 102030; RRID: AB_893288 |
| CD28, purified | BD Pharmingen | Clone: 37.51; Cat# 553294; RRID: AB_394763 |
| CD31 (PECAM-1) PE/Cy7 | eBioscience | Clone: 390; Cat# 25-0311-82; RRID: AB_2716949 |
| CD31 PE-Cy7 | BioLegend | Clone: 390; Cat# 102417; RRID: AB_830756 |
| CD3e, purified | BD Pharmingen | Clone: 145-2C11; Cat# 553057; RRID: AB_394590 |
| CD4 Alexa Fluor 700 | eBioscience | Clone: RM4-5; Cat# 56-0042-82; RRID: AB_494000 |
| CD44 PE | BioLegend | Clone: IM7; Cat# 103008; RRID: AB_312959 |
| CD45 Alexa Fluor 700 | BioLegend | Clone: 30-F11; Cat# 103128; RRID: AB_493715 |
| CD45 APC/Cy7 | eBioscience | Clone: 30-F11; Cat# 47-0451-82; RRID: AB_1548781 |
| CD45 PerCPCy5.5 | Biolegend | Clone: 30-F11; Cat# 103131; RRID: AB_893344 |
| CD62L APC | eBioscience | Clone: MEL-14; Cat# 17-0621-82; RRID: AB_469410 |
| CD8a Pacific Blue | BioLegend | Clone: 53–6.7; Cat# 100725; RRID: AB_493425 |
| EGFR Alexa Fluor 647 | Cell Signaling | Clone: D38B1; Cat# 5588, RRID: AB_10694773 |
| F4/80 FITC | eBioscience | Clone: MAR-1; Cat# 134315; RRID: AB_10640726 |
| F4/80 Pacific Blue | BioLegend | Clone: BM8; Cat# 123124; RRID: AB_893475 |
| Fc-Block | BD Pharmingen | Clone: 2.4G2; Cat# 553142; RRID: AB_394657 |
| Foxp3 FITC | eBioscience | Clone: FJK-16s; Cat# 11-5773-82; RRID: AB_465243 |
| Integrin α7 APC | Miltenyi Biotec | Clone: 3C12; Cat# 130-123-833; RRID: AB_2889699 |
| Integrin α7 PE | Miltenyi Biotec | Clone: 3C12; Cat# 130-103-355; RRID: AB_2652463 |
| IRDye 680RD donkey anti-mouse | Li-cor | Cat# 925–68070; RRID: AB_2651128 |
| Ki67 APC | BioLegend | Clone: 16A8; Cat# 652406; RRID: AB_2561930 |
| Ki67 Brilliant Violet 605 | BioLegend | Clone: 16A8; Cat# 652413; RRID: AB_2562664 |
| Ly6A/E (Sca1) Brilliant Violet 605 | BioLegend | Clone: D7; Cat# 108134; RRID: AB_2650926 |
| Ly6C PE/Cy7 | BioLegend | Clone: HK1.4; Cat# 128017; RRID: AB_1732093 |
| Sca-1(Ly-6A/E) APC | eBioscience | Clone: D7; Cat# 17-5981-82; RRID: AB_469487 |
| ST2 OptiBuild Brilliant Blue 700 | BD Biosciences | Clone: U29-93; Cat# 746115; RRID: AB_2743483 |
| InVivoMAb control | BioXCell | Clone 2A3; Cat# BE0089; RRID: AB_1107769 |
| InVivoMAb anti-IL6R | BioXCell | Clone 15A7; Cat# BE0047; RRID: AB_1107588 |
| TruStain FcX (anti-mouse CD16/32) | BioLegend | Cat# 156604; RRID: AB_2783138 |
| Chemicals, peptides, and recombinant proteins | ||
| Acetyl coenzyme A sodium salt ≥93% | Sigma | Cat# A2056 |
| Calcein | eBioscience | Cat# 65-0855-39 |
| Collagenase A | Roche | Cat# 10103586001; EC# 3.4.24.3 |
| Collagenase D | Roche | Cat#11088882001; EC #3.4.24.3 |
| Collagenase type II | Sigma Aldrich | Cat# C6885; EC# 3.4.24.3 |
| Dextran sulfate sodium salt (DSS), colitis grade (36,000–50,000) | MP Biomedicals Germany | Cat# MPB-0216011080; LOT: S4140 |
| Diphtheria toxin | Calbiochem | Cat# 322326-1MG |
| Direct Red 80 | Sigma | Cat# 365548 |
| Dispase II | Roche | Cat# 47801700 |
| DTNB -5,5′-Dithiobis(2-nitrobenzoic acid) | Sigma | Cat# D218200 |
| Fixable Viability Dye eFluor450 | eBioscience | Cat# 65-0863-18 |
| Fluoromount-G | eBioscience | Cat# 00-4958-02 |
| Glycerol | Sigma | Cat# G2025 |
| Nitrotetrazolium Blue chloride | Sigma | Cat# N6876 |
| Oxaloacetate | Sigma | Cat# O4126 |
| Phenazine methosulfate | Sigma | Cat# P9625 |
| Picric Acid | Morphisto | Cat# 10339 |
| Propidium Iodide (PI) | Sigma | Cat# P4170 |
| recombinant murine IL-2 | PeproTech | Cat# 212-12 |
| Roti-Histofix 4% | Carl Roth | Cat# P087.3 |
| streptavidin PE | Thermo Fisher Scientific | Cat# S21388 |
| Sytox Blue | Thermo Fisher Scientific | Cat# S34857 |
| Critical commercial assays | ||
| Foxp3 Staining Buffer Set | eBioscience | Cat# 00-5523-00 |
| iScript cDNA synthesis kit | Bio-Rad | Cat# 1708891 |
| miRNeasy Micro Kit | Qiagen | Cat# 217084 |
| Pierce BCA protein assay kit | Thermo Fisher Scientific | Cat# 10741395 |
| QuantiTect Reverse Transcription Kit | Qiagen | Cat# 205311 |
| Revert 700 Total Protein Stain for Western Blot Normalization | Li-cor | Cat# 926-11011 |
| RNAdvance Tissue | Beckman Coulter | Cat# A32649 |
| RNAdvance Cell V2 | Beckman Coulter | Cat# A47943 |
| SsoFast EvaGreen Supermix | Bio-Rad | Cat# 1725204 |
| Deposited data | ||
| Supplemental Data S1 – Source Data: Unprocessed data underlying the display items in the manuscript. Related to Figures 1, 2, 3, 4, 5, 6, 7, and S1–S7. | This manuscript | N/A |
| Experimental models: Organisms/strains | ||
| B6.129X1-Il6tm1.1Jho/Cnbc | European Mouse Mutant Archive (EMMA) | EM:05332 |
| C57Bl/6 | Charles River | JAX #000664 |
| C57BL/6-Tg(Foxp3-DTR/EGFP)23.2Spar/Mmjax | Jackson Laboratories | JAX #011003 |
| CD4 Cre Il6ra fl/fl | Jens Brüning, Max Planck Institute for metabolism research, Germany | Nish et al.35 |
| Myl1tm1(cre)Sjb/J | Jackson Laboratories | JAX #024713 |
| Oligonucleotides | ||
| GCTGAGGACAATGCAGGGTAA | N/A | Areg fwd |
| GTGACAACTGGGCATCTGGA | N/A | Areg rev |
| TGTGGCTGATGATCCGAATA | Reinhard Obst, Ludwig-Maximilians-Universität München, Germany | CD4 Cre RO289 |
| GCTTGCATGATCTCCGGTAT | Reinhard Obst, Ludwig-Maximilians-Universität München, Germany | CD4 Cre RO290 |
| ACACCCAGTGGCTATACCCTG | Maximilian Kleinert, Helmholtz Zentrum München, Germany | Ckmt2 fwd |
| CCGTAGGATGCTTCATCACCC | Maximilian Kleinert, Helmholtz Zentrum München, Germany | Ckmt2 rev |
| TGGGACTGGTCGATTGCAT | Maximilian Kleinert, Helmholtz Zentrum München, Germany | Cpt1b fwd |
| AGTGGCCATACCTTTCCGG | Maximilian Kleinert, Helmholtz Zentrum München, Germany | Cpt1b rev |
| ACTGGCTACAAAAGCCG | N/A | Histone H3 fwd |
| ACTTGCCTCCTGCAAAGCAC | N/A | Histone H3 rev |
| GTGTGCTCCGAGTAAGGGTG | Maximilian Kleinert, Helmholtz Zentrum München, Germany | Hk2 fwd |
| CAGGCATTCGGCAATGTGG | Maximilian Kleinert, Helmholtz Zentrum München, Germany | Hk2 rev |
| Taqman probe HPRT | Thermo Fisher Scientific | HPRT-Mm01545399_m1 |
| GCCTTCTTGGGACTGATGCT | N/A | Il6 fwd |
| TGCCATTGCACAACTCTTTTC | N/A | Il6 rev |
| CCCACCAAGAACGATAGTCA | Quintana et al.58 | IL6flox fwd |
| GGTATCCTCTGTGAAGTCCTC | Quintana et al.58 | IL6flox rev |
| Taqman probe IL6 | Thermo Fisher Scientific | IL6-Mm00446190_m1 |
| TAGGGCCCAGTTCCTTTAT | Xu et al.36 | IL6Ra 3IL6A |
| CCGCGGGCGATCGCCTAGG | Xu et al.36 | IL6Ra 5GK12 |
| CCAGAGGAGCCCAAGCTCTC | Xu et al.36 | IL6Ra 5IL6E3 |
| CTCAGGAGCAGCGGGTTTAT | N/A | Mfn2 fwd |
| GAGAGGCGCCTGATCTCTTC | N/A | Mfn2 rev |
| GCAAAATTGGCTCAAACAGCC | N/A | Mstn fwd |
| AGGGATCCAGCCCATCTTCTC | N/A | Mstn rev |
| CACCTCCAACTGCTCTGACG | N/A | Myf5 fwd |
| CTCGGATGGCTCTGTAGACG | N/A | Myf5 rev |
| CTACAGGCCTTGCTCAGCTC | N/A | Myog fwd |
| AGATTGTGGGCGTCTGTAGG | N/A | Myog rev |
| GTAGGTGGAAATTCTAGCATCATCC | Jackson Laboratories | oIMR0043 |
| GCGGTCTG GCAGTAAAAACTATC | Jackson Laboratories | oIMR1084 |
| GTGAAACAGCATTGCTGTCACTT | Jackson Laboratories | oIMR1085 |
| CTCAGTGAGTTCGATTAGCCG | N/A | Pax7 fwd |
| AGACGGTTCCCTTTGTCGC | N/A | Pax7 rev |
| GATTGACATCCTGCCTGACC | N/A | Pdk4 fwd |
| CATGGAACTCCACCAAATCC | N/A | Pdk4 rev |
| AAAAGTGCCTGAAACCAGAG | Maximilian Kleinert, Helmholtz Zentrum München, Germany | Slc2a4 fwd |
| TCACCTCCTGCTCTAAAAGG | Maximilian Kleinert, Helmholtz Zentrum München, Germany | Slc2a4 rev |
| Software and algorithms | ||
| ImageJ | Fiji | RRID: SCR_003070 |
| Cellpose software | N/A | RRID: SCR_021716 |
| Odyssey CLx imaging system | Li-cor | https://www.licor.com/ |
| Bio-CIS | Bioseb | https://www.bioseb.com/ |
| Wheel manager software | Med Associates, St. Albans, USA | N/A |
| Prism (version 6.0.1 to 9.3.1) | GraphPad | https://www.graphpad.com/scientific-software/prism/ |
| FlowJo software (version 7.6.1 and 10.7.1) | TreeStar, OR | https://www.flowjo.com/ |
| FACSDiva software (version 6.1.3) | Beckton Dickinson | N/A |
| Zeiss ZEN 3.7 software | Carl Zeiss Microscopy GmbH, Germany | N/A |
| Other | ||
| Grip strength meter BIO-GS3 | Bioseb | N/A |
| Standard diet | Altromin | Cat# 1314 |
Resource availability
Lead contact
Further information and requests for resources and reagents should be directed to and will be fulfilled by the lead contact Carolin Daniel (carolin.daniel@helmholtz-munich.de).
Materials availability
This study did not generate new unique items.
Experimental model and study participant details
Mice
All mice were maintained group-housed under specific pathogen free (SPF) conditions with a 12h/12h light dark cycle at 23°C with free access to food and water at the animal facility of Helmholtz Zentrum München, Germany, according to the Institutional Animal Committee Guidelines. The hygiene monitoring was based on the quarterly analysis of exhaust air dust of the IVC air handling units via real-time PCR analysis performed by an external diagnostic laboratory.59 Mice were fed ad libitum (Altromin, #1314, Lage, Germany). All mice used for in vivo studies were drug and test naive. Whenever possible, age- and sex-matched littermates were used for the studies. All animal care was executed according to the guidelines established by Institutional Animal Committees. Animal experiments were approved by the local authorities (approval numbers ROB-55.2-2532.Vet_02-17-63, ROB-55.2-2532.Vet_02-18-173, 2347-43-2018) and health status checks were performed at least once a week or more often when required.
In general, breeding of Cre/LoxP mice was performed using heterozygous mice carrying the Cre transgene and homozygous for the floxed allele with Cre negative mice homozygous for the floxed allele. Therefore, Cre heterozygous mice are referred to as (muscle fiber- or T cell-specific) KO mice and compared to the corresponding floxed/floxed control littermates.
C57Bl/6J mice (JAX Stock #000664, purchased via Charles River) were used as wild type (WT) mice. T cell-specific IL6Rα TKO mice are C57Bl/6-derived and were kindly provided by Jens Brüning (Max Planck Institute for Metabolism Research, Cologne, Germany)35 and maintained by in-house breeding. Muscle fiber-specific IL6KO mice were generated in-house using MLC Cre mice (STOCK-Myl1tm1(cre)Sjb/J (undefined genetic background), Jackson laboratories, stock #024713) and IL6 fl/fl mice (European Mouse Mutant Archive-EMMA, B6.129X1(129S4)-Il6tm1.1Jho/Cnbc).
For Treg depletion, 15-20-week-old male Foxp3 DTR mice (C57BL/6-Tg(Foxp3-DTR/EGFP)23.2Spar/Mmjax, Jackson laboratories, stock #011003) were injected i.p. with 25 ng diphtheria toxin per g bodyweight for three times every other day. Only male mice were used since Foxp3-DTR is on the X chromosome, transgene carrying males are infertile and therefore, no homozygous Foxp3 DTR+ female mice can be obtained by crossing heterozygous females with non-carrier males.
For Treg expansion, 6 μg anti-IL2/IL2 antibody complexes were injected i.p. in a total volume of 100 μL three times every other day into 10-12-week-old male IL6Rα TKO mice or floxed control animals.
For pharmacological IL-6R targeting, 10-week-old male C57Bl/6J mice received 400 μg anti-IL-6R InVivoMAb (BioXCell, BE0047) or control InVivoMAb (BioXCell, BE0089) in 100 μL 0.9% NaCl i.p. twice a week. Grip strength was measured weekly.
For the muscle injury model, all procedures were approved by the ethics committee for animal welfare of the State Office of Environment, Health, and Consumer Protection (State of Brandenburg, Germany) under approval number 2347-43-2018. Muscle injury was induced in 10-13-week-old male CD4 IL6Ra TKO vs. floxed mice by intramuscular injections of 25 μL of 50% glycerol (v/v in PBS) divided in two injections (12.5 μL each) into the tibialis anterior (TA) muscles in mice shortly anesthetized with isoflurane. At 4- or 14-day post injection mice were sacrificed and TA-muscles were collected for FACS and histology analysis, respectively.
For DSS-induced sarcopenia, 9-15-week-old female CD4 IL6Ra TKO vs. floxed mice received 1.5–2.0% (w/v) DSS in the drinking water. Drinking water was changed every two days. Grip strength was measured once a week.
For voluntary wheel running experiments, 8-week-old male littermates of the corresponding mouse lines were randomly assigned to sedentary vs. exercised groups. Mice were kept double-housed, but for some experimental setups single housing was approved by the local authorities. Cages of resting mice were enriched with plastic houses to correct for the additional cage enrichment during exercise experiments. Except for the wheels (exercise group) versus plastic house (resting group), cage enrichment was identical. Wheel running activity was monitored by connecting the angled running wheels (Med associates, St. Albans, USA) to a computerized activity monitoring system. The number of revolutions were recorded using the wheel manager software (Med Associates, St. Albans, USA) and used to calculate the running distance per hour or per day as indicated in the figures. BWs were monitored regularly. Running wheels of the exercised groups were locked the day prior to the study termination. For pilot studies focusing on the effect of exercise on gene expression in Soleus muscle, adult male mice were subjected to ten days of voluntary wheel running. For the other studies, male mice were randomly divided into sedentary, exercised and pre-exercised groups at the age of eight weeks. Exercised mice remained sedentary for the first four weeks and had access to wheels for the last four weeks. The pre-exercised mice had access to the wheels only during the first four weeks (for pilot studies, an additional pre-exercised group with two weeks rest, four weeks exercise followed by two weeks rest was included. This is indicated in the corresponding figure legends).
Grip strength measurements were done using BIOSEB Bio-GS3 grip strength meter and Bio-CIS software. Each mouse was measured with all four paws on the grid three times with at least 5 s recovery between measurements. Measurements of each cohort were done at the same time of the day and by the same investigator that was blinded for genotype and treatment during the measurements. The order of mice being tested was chosen randomly. The maximal grip strength was used for further analyses.
Method details
Genotyping
Genotyping of the KO mice were performed from proteinase K-digested ear punches by PCR (using the DreamTaq Green Polymerase System, Thermo Fisher) followed by agarose gel electrophoresis. For primers (Sigma Aldrich) see key resources table.
Body composition analysis using EchoMRI
Whole-body composition was analyzed in live mice using NMR technology (EchoMRI, Houston, TX, USA).
Cell isolation
Primary single cell suspensions from lymph nodes were prepared by gently straining the tissue through a 70μm cell strainer in HBSS+ (Sigma-Aldrich, supplemented with 5% FCS and 10 mM HEPES). For T cell analyses, skeletal muscles were collected in HBSS+, minced and digested using collagenase II (0.5 mg/mL, Sigma Aldrich) and calcium chloride (0.18 mg/mL) in PBS with 0.5% BSA at 37°C on a rotator for about 20–30 min. The cell suspension was passed through 70 μm/100 μm filter, centrifuged at 400g for 5 min at 4°C. The pelleted cells were resuspended in HBSS+ and stained for flow cytometric analysis.
For analyses of SCs and FAPs in steady state, muscles were isolated, minced and digested in HBSS+ containing 2.5 mg/mL of Collagenase A (Roche) for 45 min at 37°C on a rotator. 2 U/mL of Dispase II (Roche were added for additional 30 min. Muscle lysates were passed through 100 μm cell strainers, pelleted at 400g for 5 min at 4°C and further processed for flow cytometric analyses.
For analyses of the injury model, muscles were isolated, minced and digested in high-glucose DMEM medium containing 2.5 mg/mL of Collagenase A (Roche) for 45 min at 37°C with shaking. 2 U/mL of Dispase II (Roche were added for 30 min into the muscle lysates. Muscles slurries were passed 10 times through a 20 G syringe and a 70 μm cell strainer and centrifuged at 1200 rpm for 5 min at 4°C. The pellet was re-suspended in ACK (Ammonium Chloride Potassium) lysing buffer to eliminate red blood cells and centrifuged again at 1200 rpm for 5 min at 4°C. Cells were resuspended in sorting buffer consisting of 100 μL Hank’s balanced salt solution (HBSS), 0.4% bovine serum albumin and stained for 30 min at 4°C. Living cells were gated for the accumulation of calcein (1:1,000 dilution; stock of 1 mg in 215 mL DMSO) and the exclusion of propidium iodide (PI) (1:1000 diluted stock solution: 1 μg/mL in water) fluorescence.
Flow cytometry
All single cell suspensions were incubated with Fc blocking reagent (BD Pharmingen) for 10 min to prevent the unspecific binding of antibodies and thereafter incubated with fluorochrome-labelled antibodies for surface staining on ice in the dark for 30 min. All monoclonal antibodies used are listed in the key resources table.
For the intracellular staining, the cells were fixed and permeabilized using the Foxp3 staining buffer kit (eBioscience) after the surface staining. This was followed by staining with intracellular antibodies for Foxp3, Ki67 and Areg for 30 min. For the biotinylated antibody (Areg), the cells were further stained using a streptavidin-PE conjugate (S21388) from ThermoFisher Scientific. Following the staining, cells were passed through a 40 μm cell strainer (NeoLab) to remove any debris before acquisition.
Cells were sorted and acquired on BD FACS Aria III flow cytometer using FACS Diva software (Beckton Dickinson) with optimal compensation and gain settings determined based on unstained and single-color stained samples. Doublets were excluded based on SSC-A vs. SSC-W and FSC-A vs. FSC-W plots. Dead cells were excluded based on forward and sideward scatter and staining with Sytox Blue (ThermoFisher), Fixable viability dye eFlour450 (eBioscience) or propidium iodide and calcein. All the data were analyzed using FlowJo software version 7.6.1 or 10.8.1 (Treestar, OR).
In vitro Treg induction assay
For Treg induction, murine naive (CD4+CD44lowCD62Lhi CD25−) T cells from the popliteal lymph nodes were FACS sorted on BD FACS Aria III cell sorter and stimulated in 96 well plates. Plates were pre-coated with 5 μg/mL anti-CD3 and 5 μg/mL anti-CD28 (BD, Pharmingen) in 0.1 M sodium bicarbonate buffer (pH = 8.2). Sorted cells were cultured for 18 h in the pre-coated plates with RPMI medium (Gibco, Life technologies) supplemented with 10% FCS, 1 mM sodium pyruvate (Sigma Aldrich), 50 mM β-mercaptoethanol (Amimed), 1x non-essential amino acids (Merck Millipore), 100 U/ml penicillin and 100 μg/mL streptomycin (Sigma Aldrich) in the presence of 100 U/ml recombinant human IL-2 (Peprotech). To mimic the subimmunogenic conditions in vitro, cells were transferred into new uncoated wells after 18 h of stimulation. T cells were then cultured without TCR stimulation for additional 36 h prior to analysis.
Gene expression analysis by real time qPCR
mRNA from the snap-frozen muscle and adipose tissues were extracted using RNeasy Mini Kit (Qiagen) according to the manufacturer’s instructions. cDNA synthesis was done using QuantiTect Reverse Transcription Kit (Qiagen). Quantitative PCR (qPCR) was performed with a ViiA 7 Real-time PCR system (Applied Biosystems) using taqman probe. Target gene expression was normalized to the reference gene, Hprt (Mm01545399_m1, ThermoFisher Scientific) and calculated relative to controls. For WT and Foxp3 DTR mice, snap-frozen Soleus was homogenized using Precellys 24, RNA was isolated with the RNAdvance Tissue Kit (Beckman Coulter) and cDNA was reverse transcribed using iScript Advanced (BioRad) according to the manufacturers’ instructions. qPCR was performed using the Ssofast Real Time Mix (BioRad), gene expression was normalized to Histone H3 as reference gene. Ct values > 45 cycles were regarded as transcripts not detectable and included as 0 for Figure S4B.
Histology and image analysis
Tibialis anterior or Gastrocnemius muscle was dissected, fixed overnight in 4% formaldehyde at 4°C over night, dehydrated, and embedded in paraffin sections before 2 μm slices were cut at midbelly and 3 sections were collected every 250 μm for Sirius red staining. Briefly, deparaffinized slides were incubated with a 0.1% Sirius red solution dissolved in aqueous saturated picric acid for 1 h, washed in acidified water (0.5% acetic acid), dehydrated and mounted with Fluoromount-G. Collagen component was red-stained to delimiting muscle fibers from the extracellular matrix. Staining was visualized in a BZ900 Fluorescence Microscope and CellPose deep-learning algorithm, was used to automatically segment individual fibers from dense red extracellular matrix.60 Cross-sectional area fiber size from three different midbelly sections per mice were analyzed with FIJI/ImageJ,61 plugin LaberlsToROIs, as described in Waisman et al.62
Succinate dehydrogenase staining (SDH)
Gastrocnemius muscles were embedded in gum tragacanth 6% (w/v) (Sigma) and snap frozen in isopentane, previously cooled in liquid nitrogen. For SDH stainings of muscle injury and Treg depletion studies, serial cross-sections (10 μm thick) were cut at midbelly in a cryostat at −20°C and stained for succinate dehydrogenase (SDH) activity, complex II of the mitochondrial respiratory chain, as follows. Sections were first allowed to reach room temperature before they were then incubated in a working SDH solution containing phenazine methosulfate (0.3 mg/mL), nitro blue tetrazolium (0.5 mg/mL), sodium succinate (50 mM), and phosphate buffer (0.12 M potassium dihydrogen phosphate, 0.88 M disodium hydrogen phosphate) for 20 min at 37°C. Afterward, slides were dipped quickly in dH2O, air-dried for 10 min in the dark, and mounted with Fluoromount-G. For other studies (e.g., time course using C57Bl/6J mice in Figure S1, SDH stainings of steady state CD4 IL6Ra TKO vs. floxed mice and DSS-induced sarcopenia in CD4 IL6Ra TKO vs. floxed mice), 16 μm cryosections were processed as follows: Slides were stained for 20 min at 22°C. After quickly dipping in dH2O, slides were fixed for 10 min in 10% neutral buffered formalin, dehydrated in a graded ethanol series, cleared using Rotihistol (Carl Roth) and mounted in Entellan. Fibers were visually categorized and counted as either oxidative (dark and medium stained) or glycolytic (lightly blue stained) using FIJI/ImageJ software61 and the Cell Counter Plugin.
Citrate synthase activity
Citrate Synthase (CS) activity was determined spectrometrically by monitoring the reduction of DTNB (5,5′ dithiobis-(2-nitrobenzoic acid) at 412 nm. Briefly, GC muscle tissue was homogenized in buffer containing 50 mM Tris, 1 mM EDTA (pH = 7.4), and 0.1% Triton X-100 and centrifuged at 13,000×g for 10 min at 4°C. An aliquot of 10 μL of 1:10 diluted supernatant of each sample was transferred to a 96-well plate before adding 215 μL of reaction buffer (100 mM Tris, 1 mM MgCl2, 1 mM EDTA adjusted to pH = 8.2, 0.1 M DTNB) and 25 μL of Acetyl-CoA (3.6 mM). All analyses were measured as triplicates. The reaction was initiated by adding 3 mM Oxaloacetate and the increase in absorbance at 412 nm was measured for 10 min at 37°C. The CS activity was calculated from the slope of the linear portion and normalized to mg tissue.
Western Blotting
Gastrocnemius muscle tissue was homogenized in Citrate Synthase (CS) buffer and protein concentrations were determined with a BCA protein assay kit. Protein lysates were diluted in Laemmli buffer with β-mercaptoethanol (1:1000), then heated at 37°C for 5 min. Protein samples separation were performed using 15% SDS-PAGE and subsequent protein transfer onto PVDF membranes. Proteins were incubated with the anti-OXPHOS complex (1:1000) over night and normalized to total protein (reversible protein) for quantification. Detection was performed using the Odyssey CLx imaging system. Quantification was performed using ImageJ software.
Quantification and statistical analysis
Results are presented as mean and standard error of mean (mean ± SEM) or as percentages, wherever appropriate. Comparisons of two groups were done using Student’s unpaired two-tailed t-test and for more than two groups, one or two-way ANOVA (two-tailed) followed by Tukey’s, Šidák’s or Dunnett’s post hoc test for multiple comparisons, respectively. Given the applied n numbers, no additional methods were used to determine whether the data were normally distributed. The detailed information which statistical test was used and the n numbers for each experiment are indicated in the corresponding figure legends or shown by plotting individual points. A p < 0.05 was considered to be statistically significant. Statistical significance is shown as ∗ = p < 0.05, ∗∗ or ## = p < 0.01, ∗∗∗ = p < 0.001 or ∗∗∗∗ = p < 0.0001. All statistical analyses were performed using Prism v6-9.2.0 (GraphPad).
Acknowledgments
The authors thank Sebastian Cucuruz, Kristina Then, Anne H. Neubig, and Cynthia Striese for their assistance with animal studies; Martin G. Scherm for the graphical abstract; and Maximilian Kleinert for primer sequences (Helmholtz Zentrum München, Munich, Germany). Jens C. Brüning (Max-Planck Institute for Metabolism Research, Cologne, Germany) provided Il6ra floxed/floxed animals. C.D. holds a professorship grant from the Excellence Program for Outstanding Female Scientists from the Helmholtz Association and is supported by a Research Group at Helmholtz Zentrum München, by the German Center for Diabetes Research (DZD), through a membership in the CRC1054 of the Deutsche Forschungsgemeinschaft Project-ID 210592381–SFB 1054 (B11), and through an award of the EFSD/JDRF/Lilly Program on Type 1 Diabetes Research 2020. This research was supported by the Deutsche Forschungsgemeinschaft (DFG, German Research Foundation) project number 490846870-TRR355/1 TPA02 to C.D., project number 427826188/SFB1444 P12 to T.J.S., and grant HO 2286/3-1 within the Research Unit FOR 5298: iMAGO to S.M.H. I.S. is supported by the Deutsche Forschungsgemeinschaft, project ID SE3036/2-1 and TRR355/1 TPB02. This work was supported in part by funding to M.H.T. from the Alexander von Humboldt Foundation, the Helmholtz Alliance ICEMED, and the Helmholtz Initiative on Personalized Medicine iMed by the Helmholtz Association; funding by the European Research Council (ERC; AdG HypoFlam no. 695054); the Helmholtz cross-program topic “Metabolic Dysfunction”; and the Initiative and Networking Fund of the Helmholtz Association. We acknowledge grants within the German Center for Diabetes Research (DZD) funded by the German Ministry of Education and Research (BMBF) and the State of Brandenburg (DZD grant IDs 82DZD00302, 82DZD03D03, and 82DZD03C3G to T.J.S.). We thank the Core Facility Pathology & Tissue Analytics at Helmholtz Munich for their support.
Author contributions
M.B. designed and performed animal studies, performed experiments for Treg analysis and muscle function, interpreted data, compiled figures, and wrote the manuscript. S.S.J. designed and performed experiments, analyzed and interpreted data, and co-wrote the manuscript. F.G.-C. performed and analyzed muscle injury studies and cross-sectional areas and interpreted data. R.Z.T. designed and supported the animal exercise studies and data collection. I.S. supported experiments and data analyses. D.O. supported the animal studies and Treg analyses. S.M.H. oversaw running wheel experiments, supported metabolic data analyses and integration, and provided loss-of-function models. T.J.S. designed and supervised the muscle injury experiments. M.H.T. advised and supported the conceptualization of the manuscript. C.D. conceptualized, designed, analyzed, and interpreted all data and wrote the manuscript.
Declaration of interests
The authors declare no competing interests.
Inclusion and diversity
We support inclusive, diverse, and equitable conduct of research.
Published: September 20, 2023
Footnotes
Supplemental information can be found online at https://doi.org/10.1016/j.cmet.2023.08.010.
Supplemental information
All values used to generate the graphs and uncropped images of representative Western blots in the paper can be found in the file Data S1 – Source data as indicated in the STAR Methods Key Resource Table
Data and code availability
This paper does not report original code. Any additional information required to reanalyze the data reported in this paper is available from the lead contact upon request. Unprocessed data underlying the display items in the manuscript can be found in Supplemental Table Data S1- Source Data as also indicated in the key resources table.
References
- 1.Hotamisligil G.S. Foundations of immunometabolism and implications for metabolic health and disease. Immunity. 2017;47:406–420. doi: 10.1016/j.immuni.2017.08.009. [DOI] [PMC free article] [PubMed] [Google Scholar]
- 2.Mattson M.P., Longo V.D., Harvie M. Impact of intermittent fasting on health and disease processes. Ageing Res. Rev. 2017;39:46–58. doi: 10.1016/j.arr.2016.10.005. [DOI] [PMC free article] [PubMed] [Google Scholar]
- 3.Hojman P., Gehl J., Christensen J.F., Pedersen B.K. Molecular mechanisms linking exercise to cancer prevention and treatment. Cell Metab. 2018;27:10–21. doi: 10.1016/j.cmet.2017.09.015. [DOI] [PubMed] [Google Scholar]
- 4.Burzyn D., Kuswanto W., Kolodin D., Shadrach J.L., Cerletti M., Jang Y., Sefik E., Tan T.G., Wagers A.J., Benoist C., Mathis D. A special population of regulatory T cells potentiates muscle repair. Cell. 2013;155:1282–1295. doi: 10.1016/j.cell.2013.10.054. [DOI] [PMC free article] [PubMed] [Google Scholar]
- 5.Panduro M., Benoist C., Mathis D. T(reg) cells limit IFN-gamma production to control macrophage accrual and phenotype during skeletal muscle regeneration. Proc. Natl. Acad. Sci. USA. 2018;115:E2585–E2593. doi: 10.1073/pnas.1800618115. [DOI] [PMC free article] [PubMed] [Google Scholar]
- 6.Kuswanto W., Burzyn D., Panduro M., Wang K.K., Jang Y.C., Wagers A.J., Benoist C., Mathis D. Poor repair of skeletal muscle in aging mice reflects a defect in local, interleukin-33-dependent accumulation of regulatory T cells. Immunity. 2016;44:355–367. doi: 10.1016/j.immuni.2016.01.009. [DOI] [PMC free article] [PubMed] [Google Scholar]
- 7.von Boehmer H., Daniel C. Therapeutic opportunities for manipulating T(reg) cells in autoimmunity and cancer. Nat. Rev. Drug Discov. 2013;12:51–63. doi: 10.1038/nrd3683. [DOI] [PubMed] [Google Scholar]
- 8.Zaiss D.M.W., van Loosdregt J., Gorlani A., Bekker C.P.J., Gröne A., Sibilia M., van Bergen en Henegouwen P.M.P., Roovers R.C., Coffer P.J., Sijts A.J.A.M. Amphiregulin enhances regulatory T cell-suppressive function via the epidermal growth factor receptor. Immunity. 2013;38:275–284. doi: 10.1016/j.immuni.2012.09.023. [DOI] [PMC free article] [PubMed] [Google Scholar]
- 9.Zaiss D.M.W., Gause W.C., Osborne L.C., Artis D. Emerging functions of amphiregulin in orchestrating immunity, inflammation, and tissue repair. Immunity. 2015;42:216–226. doi: 10.1016/j.immuni.2015.01.020. [DOI] [PMC free article] [PubMed] [Google Scholar]
- 10.Minutti C.M., Drube S., Blair N., Schwartz C., McCrae J.C., McKenzie A.N., Kamradt T., Mokry M., Coffer P.J., Sibilia M., et al. Epidermal Growth factor receptor expression licenses type-2 helper T cells to function in a T cell receptor-independent fashion. Immunity. 2017;47:710–722.e6. doi: 10.1016/j.immuni.2017.09.013. [DOI] [PMC free article] [PubMed] [Google Scholar]
- 11.Pal M., Febbraio M.A., Whitham M. From cytokine to myokine: the emerging role of interleukin-6 in metabolic regulation. Immunol. Cell Biol. 2014;92:331–339. doi: 10.1038/icb.2014.16. [DOI] [PubMed] [Google Scholar]
- 12.Lancaster G.I., Febbraio M.A. The immunomodulating role of exercise in metabolic disease. Trends Immunol. 2014;35:262–269. doi: 10.1016/j.it.2014.02.008. [DOI] [PubMed] [Google Scholar]
- 13.Pedersen B.K., Febbraio M.A. Muscle as an endocrine organ: focus on muscle-derived interleukin-6. Physiol. Rev. 2008;88:1379–1406. doi: 10.1152/physrev.90100.2007. [DOI] [PubMed] [Google Scholar]
- 14.Rose-John S. IL-6 trans-signaling via the soluble IL-6 receptor: importance for the pro-inflammatory activities of IL-6. Int. J. Biol. Sci. 2012;8:1237–1247. doi: 10.7150/ijbs.4989. [DOI] [PMC free article] [PubMed] [Google Scholar]
- 15.Timper K., Denson J.L., Steculorum S.M., Heilinger C., Engström-Ruud L., Wunderlich C.M., Rose-John S., Wunderlich F.T., Brüning J.C. IL-6 improves energy and glucose homeostasis in obesity via enhanced central IL-6 trans-signaling. Cell Rep. 2017;19:267–280. doi: 10.1016/j.celrep.2017.03.043. [DOI] [PubMed] [Google Scholar]
- 16.Heink S., Yogev N., Garbers C., Herwerth M., Aly L., Gasperi C., Husterer V., Croxford A.L., Möller-Hackbarth K., Bartsch H.S., et al. Trans-presentation of IL-6 by dendritic cells is required for the priming of pathogenic T(H)17 cells. Nat. Immunol. 2017;18:74–85. doi: 10.1038/ni.3632. [DOI] [PMC free article] [PubMed] [Google Scholar]
- 17.Kleinert M., Parker B.L., Jensen T.E., Raun S.H., Pham P., Han X., James D.E., Richter E.A., Sylow L. Quantitative proteomic characterization of cellular pathways associated with altered insulin sensitivity in skeletal muscle following high-fat diet feeding and exercise training. Sci. Rep. 2018;8 doi: 10.1038/s41598-018-28540-5. [DOI] [PMC free article] [PubMed] [Google Scholar]
- 18.Pedersen L., Idorn M., Olofsson G.H., Lauenborg B., Nookaew I., Hansen R.H., Johannesen H.H., Becker J.C., Pedersen K.S., Dethlefsen C., et al. Voluntary running suppresses tumor growth through epinephrine- and IL-6-dependent NK cell mobilization and redistribution. Cell Metab. 2016;23:554–562. doi: 10.1016/j.cmet.2016.01.011. [DOI] [PubMed] [Google Scholar]
- 19.Manzanares G., Brito-da-Silva G., Gandra P.G. Voluntary wheel running: patterns and physiological effects in mice. Braz. J. Med. Biol. 2018;52 doi: 10.1590/1414-431X20187830. [DOI] [PMC free article] [PubMed] [Google Scholar]
- 20.Serr I., Scherm M.G., Zahm A.M., Schug J., Flynn V.K., Hippich M., Kälin S., Becker M., Achenbach P., Nikolaev A., et al. A miRNA181a/NFAT5 axis links impaired T cell tolerance induction with autoimmune type 1 diabetes. Sci. Transl. Med. 2018;10 doi: 10.1126/scitranslmed.aag1782. [DOI] [PMC free article] [PubMed] [Google Scholar]
- 21.Serr I., Fürst R.W., Achenbach P., Scherm M.G., Gökmen F., Haupt F., Sedlmeier E.M., Knopff A., Shultz L., Willis R.A., et al. Type 1 diabetes vaccine candidates promote human Foxp3(+)Treg induction in humanized mice. Nat. Commun. 2016;7 doi: 10.1038/ncomms10991. [DOI] [PMC free article] [PubMed] [Google Scholar]
- 22.Kalin S., Becker M., Ott V.B., Serr I., Hosp F., Mollah M.M.H., Keipert S., Lamp D., Rohner-Jeanrenaud F., Flynn V.K., et al. A Stat6/Pten axis links regulatory T cells with adipose tissue function. Cell Metab. 2017;26:475–492.e477. doi: 10.1016/j.cmet.2017.08.008. [DOI] [PMC free article] [PubMed] [Google Scholar]
- 23.Scherm M.G., Serr I., Zahm A.M., Schug J., Bellusci S., Manfredini R., Salb V.K., Gerlach K., Weigmann B., Ziegler A.G., et al. miRNA142-3p targets Tet2 and impairs Treg differentiation and stability in models of type 1 diabetes. Nat. Commun. 2019;10:5697. doi: 10.1038/s41467-019-13587-3. [DOI] [PMC free article] [PubMed] [Google Scholar]
- 24.Becker M., Serr I., Salb V.K., Ott V.B., Mengel L., Blüher M., Weigmann B., Hauner H., Tschöp M.H., Daniel C. Short-term cold exposure supports human Treg induction in vivo. Mol. Metab. 2019;28:73–82. doi: 10.1016/j.molmet.2019.08.002. [DOI] [PMC free article] [PubMed] [Google Scholar]
- 25.Jones J.T., Akita R.W., Sliwkowski M.X. Binding specificities and affinities of EGF domains for ErbB receptors. FEBS Lett. 1999;447:227–231. doi: 10.1016/s0014-5793(99)00283-5. [DOI] [PubMed] [Google Scholar]
- 26.Macdonald-Obermann J.L., Pike L.J. Different epidermal growth factor (EGF) receptor ligands show distinct kinetics and biased or partial agonism for homodimer and heterodimer formation. J. Biol. Chem. 2014;289:26178–26188. doi: 10.1074/jbc.M114.586826. [DOI] [PMC free article] [PubMed] [Google Scholar]
- 27.Delacher M., Imbusch C.D., Hotz-Wagenblatt A., Mallm J.P., Bauer K., Simon M., Riegel D., Rendeiro A.F., Bittner S., Sanderink L., et al. Precursors for nonlymphoid-tissue Treg cells reside in secondary lymphoid organs and are programmed by the transcription factor BATF. Immunity. 2020;52:295–312.e11. doi: 10.1016/j.immuni.2019.12.002. [DOI] [PMC free article] [PubMed] [Google Scholar]
- 28.Li C., DiSpirito J.R., Zemmour D., Spallanzani R.G., Kuswanto W., Benoist C., Mathis D. TCR transgenic mice reveal stepwise, multi-site acquisition of the distinctive fat-Treg phenotype. Cell. 2018;174:285–299.e12. doi: 10.1016/j.cell.2018.05.004. [DOI] [PMC free article] [PubMed] [Google Scholar]
- 29.Feuerer M., Herrero L., Cipolletta D., Naaz A., Wong J., Nayer A., Lee J., Goldfine A.B., Benoist C., Shoelson S., Mathis D. Lean, but not obese, fat is enriched for a unique population of regulatory T cells that affect metabolic parameters. Nat. Med. 2009;15:930–939. doi: 10.1038/nm.2002. [DOI] [PMC free article] [PubMed] [Google Scholar]
- 30.Lahl K., Loddenkemper C., Drouin C., Freyer J., Arnason J., Eberl G., Hamann A., Wagner H., Huehn J., Sparwasser T. Selective depletion of Foxp3+ regulatory T cells induces a scurfy-like disease. J. Exp. Med. 2007;204:57–63. doi: 10.1084/jem.20061852. [DOI] [PMC free article] [PubMed] [Google Scholar]
- 31.Holloszy J.O., Oscai L.B., Don I.J., Molé P.A. Mitochondrial citric acid cycle and related enzymes: adaptive response to exercise. Biochem. Biophys. Res. Commun. 1970;40:1368–1373. doi: 10.1016/0006-291x(70)90017-3. [DOI] [PubMed] [Google Scholar]
- 32.Molinero A., Fernandez-Perez A., Mogas A., Giralt M., Comes G., Fernandez-Gayol O., Vallejo M., Hidalgo J. Role of muscle IL-6 in gender-specific metabolism in mice. PLoS One. 2017;12 doi: 10.1371/journal.pone.0173675. [DOI] [PMC free article] [PubMed] [Google Scholar]
- 33.Bothe G.W., Haspel J.A., Smith C.L., Wiener H.H., Burden S.J. Selective expression of Cre recombinase in skeletal muscle fibers. Genesis. 2000;26:165–166. [PubMed] [Google Scholar]
- 34.Keller C., Steensberg A., Hansen A.K., Fischer C.P., Plomgaard P., Pedersen B.K. Effect of exercise, training, and glycogen availability on IL-6 receptor expression in human skeletal muscle. J. Appl. Physiol. 2005;99:2075–2079. doi: 10.1152/japplphysiol.00590.2005. [DOI] [PubMed] [Google Scholar]
- 35.Nish S.A., Schenten D., Wunderlich F.T., Pope S.D., Gao Y., Hoshi N., Yu S., Yan X., Lee H.K., Pasman L., et al. T cell-intrinsic role of IL-6 signaling in primary and memory responses. eLife. 2014;3 doi: 10.7554/eLife.01949. [DOI] [PMC free article] [PubMed] [Google Scholar]
- 36.Xu E., Pereira M.M.A., Karakasilioti I., Theurich S., Al-Maarri M., Rappl G., Waisman A., Wunderlich F.T., Brüning J.C. Temporal and tissue-specific requirements for T-lymphocyte IL-6 signalling in obesity-associated inflammation and insulin resistance. Nat. Commun. 2017;8 doi: 10.1038/ncomms14803. [DOI] [PMC free article] [PubMed] [Google Scholar]
- 37.Sawada S., Scarborough J.D., Killeen N., Littman D.R. A lineage-specific transcriptional silencer regulates CD4 gene expression during T lymphocyte development. Cell. 1994;77:917–929. doi: 10.1016/0092-8674(94)90140-6. [DOI] [PubMed] [Google Scholar]
- 38.Wunderlich F.T., Ströhle P., Könner A.C., Gruber S., Tovar S., Brönneke H.S., Juntti-Berggren L., Li L.S., van Rooijen N., Libert C., et al. Interleukin-6 signaling in liver-parenchymal cells suppresses hepatic inflammation and improves systemic insulin action. Cell Metab. 2010;12:237–249. doi: 10.1016/j.cmet.2010.06.011. [DOI] [PubMed] [Google Scholar]
- 39.Saul D., Kosinsky R.L. Dextran Sodium sulfate-induced colitis as a model for sarcopenia in mice. Inflamm. Bowel Dis. 2020;26:56–65. doi: 10.1093/ibd/izz127. [DOI] [PubMed] [Google Scholar]
- 40.Joe A.W.B., Yi L., Natarajan A., Le Grand F., So L., Wang J., Rudnicki M.A., Rossi F.M.V. Muscle injury activates resident fibro/adipogenic progenitors that facilitate myogenesis. Nat. Cell Biol. 2010;12:153–163. doi: 10.1038/ncb2015. [DOI] [PMC free article] [PubMed] [Google Scholar]
- 41.Wosczyna M.N., Konishi C.T., Perez Carbajal E.E., Wang T.T., Walsh R.A., Gan Q., Wagner M.W., Rando T.A. Mesenchymal stromal cells are required for regeneration and homeostatic maintenance of skeletal muscle. Cell Rep. 2019;27:2029–2035.e5. doi: 10.1016/j.celrep.2019.04.074. [DOI] [PMC free article] [PubMed] [Google Scholar]
- 42.Keefe A.C., Lawson J.A., Flygare S.D., Fox Z.D., Colasanto M.P., Mathew S.J., Yandell M., Kardon G. Muscle stem cells contribute to myofibres in sedentary adult mice. Nat. Commun. 2015;6:7087. doi: 10.1038/ncomms8087. [DOI] [PMC free article] [PubMed] [Google Scholar]
- 43.Mahdy M.A.A., Lei H.Y., Wakamatsu J.I., Hosaka Y.Z., Nishimura T. Comparative study of muscle regeneration following cardiotoxin and glycerol injury. Ann. Anat. 2015;202:18–27. doi: 10.1016/j.aanat.2015.07.002. [DOI] [PubMed] [Google Scholar]
- 44.Tidball J.G., Villalta S.A. Regulatory interactions between muscle and the immune system during muscle regeneration. Am. J. Physiol. Regul. Integr. Comp. Physiol. 2010;298:R1173–R1187. doi: 10.1152/ajpregu.00735.2009. [DOI] [PMC free article] [PubMed] [Google Scholar]
- 45.Chazaud B. Inflammation and skeletal muscle regeneration: leave it to the macrophages. Trends Immunol. 2020;41:481–492. doi: 10.1016/j.it.2020.04.006. [DOI] [PubMed] [Google Scholar]
- 46.Webster K.E., Walters S., Kohler R.E., Mrkvan T., Boyman O., Surh C.D., Grey S.T., Sprent J. In vivo expansion of T reg cells with IL-2-mAb complexes: induction of resistance to EAE and long-term acceptance of islet allografts without immunosuppression. J. Exp. Med. 2009;206:751–760. doi: 10.1084/jem.20082824. [DOI] [PMC free article] [PubMed] [Google Scholar]
- 47.Colomiere M., Ward A.C., Riley C., Trenerry M.K., Cameron-Smith D., Findlay J., Ackland L., Ahmed N. Cross talk of signals between EGFR and IL-6R through JAK2/STAT3 mediate epithelial-mesenchymal transition in ovarian carcinomas. Br. J. Cancer. 2009;100:134–144. doi: 10.1038/sj.bjc.6604794. [DOI] [PMC free article] [PubMed] [Google Scholar]
- 48.Stolarczyk M., Amatngalim G.D., Yu X., Veltman M., Hiemstra P.S., Scholte B.J. ADAM17 and EGFR regulate IL-6 receptor and amphiregulin mRNA expression and release in cigarette smoke-exposed primary bronchial epithelial cells from patients with chronic obstructive pulmonary disease (COPD) Physiol. Rep. 2016;4 doi: 10.14814/phy2.12878. [DOI] [PMC free article] [PubMed] [Google Scholar]
- 49.Muñoz-Cánoves P., Scheele C., Pedersen B.K., Serrano A.L. Interleukin-6 myokine signaling in skeletal muscle: a double-edged sword? FEBS J. 2013;280:4131–4148. doi: 10.1111/febs.12338. [DOI] [PMC free article] [PubMed] [Google Scholar]
- 50.Zhang C., Li Y., Wu Y., Wang L., Wang X., Du J. Interleukin-6/signal transducer and activator of transcription 3 (STAT3) pathway is essential for macrophage infiltration and myoblast proliferation during muscle regeneration. J. Biol. Chem. 2013;288:1489–1499. doi: 10.1074/jbc.M112.419788. [DOI] [PMC free article] [PubMed] [Google Scholar]
- 51.Wang Y., van Boxel-Dezaire A.H.H., Cheon H., Yang J., Stark G.R. STAT3 activation in response to IL-6 is prolonged by the binding of IL-6 receptor to EGF receptor. Proc. Natl. Acad. Sci. USA. 2013;110:16975–16980. doi: 10.1073/pnas.1315862110. [DOI] [PMC free article] [PubMed] [Google Scholar]
- 52.Pallandre J.R., Brillard E., Créhange G., Radlovic A., Remy-Martin J.P., Saas P., Rohrlich P.S., Pivot X., Ling X., Tiberghien P., Borg C. Role of STAT3 in CD4+CD25+FOXP3+ regulatory lymphocyte generation: implications in graft-versus-host disease and antitumor immunity. J. Immunol. 2007;179:7593–7604. doi: 10.4049/jimmunol.179.11.7593. [DOI] [PubMed] [Google Scholar]
- 53.Hossain D.M.S., Panda A.K., Manna A., Mohanty S., Bhattacharjee P., Bhattacharyya S., Saha T., Chakraborty S., Kar R.K., Das T., et al. Retracted: FoxP3 acts as a cotranscription factor with STAT3 in tumor-induced regulatory T cells. Immunity. 2013;39:1057–1069. doi: 10.1016/j.immuni.2013.11.005. [DOI] [PubMed] [Google Scholar]
- 54.Little H.C., Tan S.Y., Cali F.M., Rodriguez S., Lei X., Wolfe A., Hug C., Wong G.W. Multiplex quantification identifies novel exercise-regulated myokines/cytokines in plasma and in glycolytic and oxidative skeletal muscle. Mol. Cell. Proteomics. 2018;17:1546–1563. doi: 10.1074/mcp.RA118.000794. [DOI] [PMC free article] [PubMed] [Google Scholar]
- 55.Minutti C.M., Modak R.V., Macdonald F., Li F., Smyth D.J., Dorward D.A., Blair N., Husovsky C., Muir A., Giampazolias E., et al. A macrophage-pericyte axis directs tissue restoration via amphiregulin-induced transforming growth factor beta activation. Immunity. 2019;50:645–654.e6. doi: 10.1016/j.immuni.2019.01.008. [DOI] [PMC free article] [PubMed] [Google Scholar]
- 56.Radigan K.A., Nicholson T.T., Welch L.C., Chi M., Amarelle L., Angulo M., Shigemura M., Shigemura A., Runyan C.E., Morales-Nebreda L., et al. Influenza A virus infection induces muscle wasting via IL-6 regulation of the E3 ubiquitin ligase atrogin-1. J. Immunol. 2019;202:484–493. doi: 10.4049/jimmunol.1701433. [DOI] [PMC free article] [PubMed] [Google Scholar]
- 57.Li S., Li W., Jiang W., He L., Peng Q., Wang G., Lu X. The efficacy of tocilizumab in the treatment of patients with refractory immune-mediated necrotizing myopathies: an open-label pilot study. Front. Pharmacol. 2021;12 doi: 10.3389/fphar.2021.635654. [DOI] [PMC free article] [PubMed] [Google Scholar]
- 58.Quintana A., Erta M., Ferrer B., Comes G., Giralt M., Hidalgo J. Astrocyte-specific deficiency of interleukin-6 and its receptor reveal specific roles in survival, body weight and behavior. Brain Behav. Immun. 2013;27:162–173. doi: 10.1016/j.bbi.2012.10.011. [DOI] [PubMed] [Google Scholar]
- 59.Miller M., Brielmeier M. Environmental samples make soiled bedding sentinels dispensable for hygienic monitoring of IVC-reared mouse colonies. Lab. Anim. 2018;52:233–239. doi: 10.1177/0023677217739329. [DOI] [PubMed] [Google Scholar]
- 60.Stringer C., Wang T., Michaelos M., Pachitariu M. Cellpose: a generalist algorithm for cellular segmentation. Nat. Methods. 2021;18:100–106. doi: 10.1038/s41592-020-01018-x. [DOI] [PubMed] [Google Scholar]
- 61.Schindelin J., Arganda-Carreras I., Frise E., Kaynig V., Longair M., Pietzsch T., Preibisch S., Rueden C., Saalfeld S., Schmid B., et al. Fiji: an open-source platform for biological-image analysis. Nat. Methods. 2012;9:676–682. doi: 10.1038/nmeth.2019. [DOI] [PMC free article] [PubMed] [Google Scholar]
- 62.Waisman A., Norris A.M., Elías Costa M., Kopinke D. Automatic and unbiased segmentation and quantification of myofibers in skeletal muscle. Sci. Rep. 2021;11 doi: 10.1038/s41598-021-91191-6. [DOI] [PMC free article] [PubMed] [Google Scholar]
Associated Data
This section collects any data citations, data availability statements, or supplementary materials included in this article.
Supplementary Materials
All values used to generate the graphs and uncropped images of representative Western blots in the paper can be found in the file Data S1 – Source data as indicated in the STAR Methods Key Resource Table
Data Availability Statement
This paper does not report original code. Any additional information required to reanalyze the data reported in this paper is available from the lead contact upon request. Unprocessed data underlying the display items in the manuscript can be found in Supplemental Table Data S1- Source Data as also indicated in the key resources table.