

Abstract
Protein–DNA interactions play an important role in various biological processes such as gene expression, replication, and transcription. Understanding the important features that dictate the binding affinity of protein-DNA complexes and predicting their affinities is important for elucidating their recognition mechanisms. In this work, we have collected the experimental binding free energy (ΔG) for a set of 391 Protein-DNA complexes and derived several structure-based features such as interaction energy, contact potentials, volume and surface area of binding site residues, base step parameters of the DNA and contacts between different types of atoms. Our analysis on relationship between binding affinity and structural features revealed that the important factors mainly depend on the number of DNA strands as well as functional and structural classes of proteins. Specifically, binding site properties such as number of atom contacts between the DNA and protein, volume of protein binding sites and interaction-based features such as interaction energies and contact potentials are important to understand the binding affinity. Further, we developed multiple regression equations for predicting the binding affinity of protein-DNA complexes belonging to different structural and functional classes. Our method showed an average correlation and mean absolute error of 0.78 and 0.98 kcal/mol, respectively, between the experimental and predicted binding affinities on a jack-knife test. We have developed a webserver, PDA-PreD (Protein-DNA Binding affinity predictor), for predicting the affinity of protein-DNA complexes and it is freely available at https://web.iitm.ac.in/bioinfo2/pdapred/
Keywords: protein–DNA complex, Binding free energy, Contact potentials, Structure-based features
1. Introduction
Protein-DNA interactions are essential components for all biological systems. These interactions control/regulate replication, repair, methylation, transcription and maintain the genome stability [1]. Numerous studies have been carried out to understand the structure–function relationship of protein-DNA complexes such as identification of DNA binding proteins, predicting the binding site residues, binding affinity of protein-DNA complexes and recognition mechanism of protein-nucleic acid complexes [2–7].
The function of a protein-DNA complex is dictated by its binding affinity [8], which is quantitatively measured using dissociation constant (Kd) and binding free energy (ΔG). Understanding the affinity of protein-DNA interactions is important to study the effects on gene expressions, delineate the recognition mechanism based on interactions between protein and DNA and so on [9,10]. It has a broad spectrum of applications such as designing complexes with the desired affinities, developing prediction methods for the target sites, and quantitative simulation of gene regulation networks.
Experimentally, binding affinities of protein-nucleic acid complexes are studied with electrophoretic mobility shift assay, filter binding assay, fluorescence spectroscopy, isothermal titration calorimetry, and surface plasmon resonance. These experimental data are compiled in ProNAB database, which contains more than 20,000 entries on binding affinities of protein-nucleic acid complexes and their mutants [11].
Computationally, Protein-DNA binding affinities are studied through molecular dynamics simulations, statistical methods and machine learning techniques [12]. Barissi et al. [13] developed a physics-based machine learning method, DNAffinity, for predicting the binding affinity of transcription factors using the features derived from molecular dynamics stimulations. Rastogi et al. [10] proposed a method to quantify the sequence-affinity relationship by analyzing data from DNA sequencing experiments to comprehensively probe protein-DNA interactions. Yang et al. [14] developed a structure-based machine learning method, PredDBA, for predicting the binding affinity of protein-DNA complexes using a limited set of non-redundant complexes. Most of these methods are focused on a specific protein-DNA complex or a small set of data. In addition, the performance of available methods is not uniform in different structural and functional classes of protein-DNA complexes. On the other hand, the availability of protein-DNA binding affinity data in ProNAB database aid to develop reliable methods for binding affinity prediction. Understanding the binding affinity is also crucial for structure modeling of protein-DNA complexes [15].
In this work, we constructed a non-redundant dataset for binding affinities of protein-DNA complexes with known three-dimensional structures. We classified the complexes based on their structural and functional classes, and derived features at three levels such as protein, DNA and protein-DNA interactions. These features are related with binding affinity using machine learning techniques. Our method showed a correlation and mean absolute error of 0.78 and 0.98 kcal/mol, in jack-knife test, respectively. The salient features of important structural parameters and performance of the method based on structural and functional classifications are discussed.
2. Materials and methods
2.1. Dataset
We obtained the binding affinity of protein-DNA complexes from ProNAB database using the following criteria: (i) experimentally known binding affinity (ΔG), (ii) known 3D structure and (iii) non-redundant complex structures. ProNAB is a well-curated database with the highest number of protein-DNA binding affinity data. In some complexes, multiple binding affinity values were reported for the same protein-DNA complex, determined from different experimental methods or conditions such as pH, temperature, or buffer. In such cases, the affinity determined at physiological conditions (pH: 7; T: 298 K) was selected. The average ΔG was considered for the complexes where multiple data were reported in the literature. Using the above criteria, we obtained the binding affinity of 391 complexes. These complexes were grouped into different classes based on their structure (all-α: 113; all-β: 45; αβ: 181 and others: 36), function (Regulatory: 187 and others: 152) and percentage of binding site residues. The structural and functional classification were obtained from NDB [16].
2.2. Development of features
We derived a set of 117 features from protein-DNA complex structures. Features were grouped as (i) protein-based, (ii) DNA-based and (iii) interactions between protein and DNA.
2.3. Protein-based features
Accessible surface area of polar and non-polar atoms in the interface of the protein using NACCESS [17].
Residue depth of binding site residues using the python package, Bio.PDB.
Volume and surface area at the binding site of the protein using 3 V server [18].
Percentage of helix, sheet and coil at the binding interface of the protein.
Total Accessible surface area of residues in the interface of the apo-protein and in the complex using NACCESS
Number of polar, non-polar and charged residues in the binding interface
Number of C, N, O, S atoms in the interface.
2.4. DNA-based features
Number of P, O, N, C atoms in the interface.
Accessible surface area of nucleotides in the interface of apo-DNA and in the complex using NACCESS
Base step parameters obtained using the webserver w3DNA [19], which includes shift, slide, rise, tilt, roll and twist of the DNA.
2.5. Features based on protein-DNA interactions
Interaction energy between protein and DNA, which includes van der Waals and electrostatic energies.
Interaction energy due to main chain-main chain (mc-mc), side chain-side chain (sc-sc), main chain-side chain (mc-sc) and side chain - main chain (sc-mc) of protein and DNA.
Number and percentage of atom contacts between protein and DNA (OC, NO, ON, NP, CP, CC, NC, OP, OO, CN, NN, SN, SC, SO and SP).
Residue based contact potentials of protein-DNA complexes, obtained with a cut off distance of 3.5 Å and 6 Å.
Atom based contact potentials with a cut off 3.5 Å.
Accessible surface area of interface residues in a protein, DNA and overall.
Accessible surface area of polar and non-polar residues in the interface of protein-DNA complexes, and ASA difference of interface residues between uncomplex and complex forms.
Energetic parameters of protein-DNA complexes obtained using FOLDX [20].
2.5.1. Interaction energy
The interaction energy of protein-DNA complexes was calculated using the formula [21]
| (1) |
The total interaction energy is calculated as the sum of van der Waals and electrostatic interaction energies. We also calculated the interaction energy contributed by the main chain and side chain atoms such as interaction energy due to main chain-main chain, main chain-side chain, side chain-main chain and side chain-side chain atoms of protein and DNA respectively.
2.5.2. Development of contact potentials
We constructed a non-redundant dataset of 989 protein-DNA complexes with a sequence identity of ≤ 25% for developing atom–atom and amino acid residue-nucleotide contact potentials.
2.5.3. Atom propensity
We computed the preference of the interacting atoms at the interface of a protein-DNA complex as described in Shanmugam et al. [22]. It is given by
| (2) |
where, Nij is the number of contacts of type ‘i’ in protein and ‘j’ in DNA. ni and nj are total number of atoms of type i and j in protein and DNA, respectively. NPD, np and nd are the number of interacting atoms in the protein-DNA interface, number of atoms in proteins and number of atoms in DNA, respectively.
2.5.4. Residue propensity and contact potentials
We have computed the propensity of amino acid-nucleotide contacts between protein and DNA using the equation [23]:
| (3) |
where Nij is the total number of contacts between base i and amino-acid residue j, and Tj is the total number of residue j in the whole data set. We have computed the propensities for the distance cut-off of 3.5 and 6 Å, which are widely used in the literature.
The propensity has been converted into potentials using the equation [23]:
| (4) |
where R is the gas constant and T is the temperature.
2.6. Development of multiple regression models
We have developed multiple regression equations to relate the binding affinity with different features developed from protein-DNA complexes. It is defined as,
| (5) |
where, i is the number of observations, yi is the dependent variable (binding affinity), Xi are the structure-based parameters, β0, β1 … βp are regression coefficients and ε is the error term of the model.
2.7. Procedure for feature selection
We have carried out an exhaustive systematic search for all possible combinations of four features and selected the best combination based on correlation. Further, additional features were added until there was no increase in correlation (r) and the number of features reaches the square root of the number of data points. The selected features were used for the development of the final model. We have utilized the python machine learning package scikit-learn for constructing linear regression models [24]. A similar procedure was used to develop models for all the classes.
2.8. Assessment of prediction performance
The performance of the method was assessed using Pearson (r) and Spearman correlation coefficients, which explain the relationship between the experimental and predicted binding affinities, and mean absolute error (MAE) to examine the absolute difference between predicted and experimental affinity values using the SciPy package of python [25]. The model was further validated using a jack-knife test, where regression equations were developed using (n − 1) data points and used the same to predict the ΔG of the left-out complex, recursively.
3. Results and discussion
3.1. Analysis of binding affinity of protein-DNA complexes
We have analyzed the binding affinity of 391 protein-DNA complexes and the distribution of ΔG values is shown in Fig. 1. We observed that ΔG ranges from −20 kcal/mol to −4 kcal/mol and 70% of the complexes have the ΔG of −11 to −7 kcal/mol. The complexes 1P47 (Zif268-DNA complex) and 4DTM (RB69 DNA Polymerase-DNA complex) have the highest and lowest affinities of −20.0 kcal/mol and −3.9 kcal/mol, respectively.
Fig. 1.

Distribution of experimental binding affinity (ΔG) in a set of 391 protein-DNA complexes.
Further analysis revealed that 67% of residues in Zif268 are interacting with DNA in 1P47 whereas only 20% are at the interface of 4DTM. In addition, 1P47 has twice the number of charged residues at the interface as well as more interface area compared to 4DTM. Fig. 2 shows the protein atoms, which are in contact with the DNA in both high (1P47) and low affinity (4DTM) complexes. Interestingly, 1p47 has more polar atoms and spanned with larger interface area compared to 4DTM, which has more non-polar residues and less interface area.
Fig. 2.

Examples for high and low affinity complexes, showing the interactions between protein and DNA: (a) high affinity complex (1P47) with larger interface area and more charged contacts (blue) and (b) low affinity complex (4DTM) with more non-polar contacts (green) and comparatively less dispersed area of interactions.
We explored the binding affinities of protein-DNA complexes based on structural and functional classes and the results are presented in Supplementary Fig. S1. The analysis revealed that the range of ΔG for all-α, all-β and mixed class is −13.1 to −5.9 kcal/mol, −14.4 to −5.8 kcal/mol and −20.0 to −3.9 kcal/mol, respectively. Based on functional classification, the range is −20.0 to −4.7 kcal/mol for regulatory and −17.4 to −3.9 kcal/mol for other complexes.
3.2. Atomic contact potentials
We have computed the propensity of atomic contacts at the interface of protein-DNA complexes (Eqn. (2)).These propensity values were converted to contact potentials (Eqn. (4)) and the results are presented in Supplementary Table S1. We observed that N-O atom pairs are the most preferred ones with the lowest energy of −0.97 kcal/mol, which are involved in electrostatic interactions. Further, contacts between C and O atoms between protein and DNA, occur more frequently at the interface of the protein-DNA complexes and are energetically favorable with a contact potential of −0.28 kcal/mol. Interestingly, similar results are also reported for protein-carbohydrate complexes, with preferred CO contacts between proteins and carbohydrates [22].
3.3. Amino acid-nucleotide contact potentials
We have computed the preference of amino acid-nucleotide contacts between protein and DNA and the results obtained with a distance cutoff of 3.5 Å are presented in Supplementary Table S2. We observed that all the four bases (A, T, G, C) prefer to interact with the positive charged amino acids Arg (20–25%) and Lys (14–16%), along with higher preference for Arg compared to Lys, which is similar to the observations reported in [23]. Further, Cytosine and Adenine tend to prefer most of the polar and charged amino acids such as Arg, Lys, Tyr, Ser, Thr and Asn at the interface. In addition, Thymine occurred most frequently at the protein-DNA interface, which agrees well with the previous result reported by Meysman et al. [26]. In addition, Cys, Asp, Met are less favored at the interfaces of protein-DNA complexes.
We calculated amino acid-base propensities from the number of contacts, and further obtained the contact potentials, and the results are presented in the Table 1. Overall, Thymine-Trp interaction is energetically favorable at the interface with −2.25 kcal/mol, showing the importance of π-π interactions [27]. Further, Trp-Thymine has the strongest interaction among other aromatic amino acids Phe and Tyr. Frequently occurring amino acids Arg and Lys have the interaction energy of −0.93 and −0.91 kcal/mol, respectively with Thymine.
Table 1.
Amino acid-nucleotide contact potential for protein-DNA complexes.
| DNA bases Amino acids | G | C | A | T |
|---|---|---|---|---|
| Ala | −0.65 | −0.46 | −0.73 | −1.00 |
| Arg | −0.81 | −0.63 | −0.85 | −0.93 |
| Asn | −0.98 | −0.83 | −1.12 | −1.25 |
| Asp | −0.90 | −0.92 | −0.93 | −0.87 |
| Cys | −1.89 | −1.59 | −1.66 | −1.66 |
| Gln | −0.89 | −0.93 | −1.15 | −1.23 |
| Glu | −0.62 | −0.67 | −0.76 | −0.84 |
| Gly | −0.91 | −0.74 | −0.79 | −1.01 |
| His | −1.44 | −1.19 | −1.38 | −1.65 |
| Ile | −0.70 | −0.72 | −0.89 | −0.90 |
| Leu | −0.39 | −0.31 | −0.42 | −0.83 |
| Lys | −0.73 | −0.61 | −0.80 | −0.91 |
| Met | −1.31 | −1.11 | −1.56 | −1.62 |
| Phe | −0.97 | −0.85 | −1.12 | −1.34 |
| Pro | −0.99 | −0.77 | −1.14 | −1.26 |
| Ser | −0.81 | −0.66 | −0.85 | −0.99 |
| Thr | −0.92 | −0.69 | −0.96 | −1.07 |
| Trp | −1.47 | −1.49 | −1.93 | −2.25 |
| Tyr | −1.03 | −0.89 | −1.27 | −1.40 |
| Val | −0.74 | −0.52 | −0.84 | −0.94 |
3.4. Relationship between structure-based features and the binding affinity
We have related the parameters derived from structures of proteins, DNA and protein-DNA complexes (Materials and methods) with binding affinities to explore the relationship between them. Interestingly, although the direct correlation between each property and binding affinity is poor, we observed an increase in specific properties with different ranges of binding affinities.
The features related to binding interface of protein-DNA complexes such as contact potentials and total number of polar residues directly relate with protein-DNA binding affinity. Fig. 3 shows the data obtained with specific parameters such as (i) contact potentials at 3.5 Å (Fig. 3a) and (ii) number of polar residues in the interface of protein-DNA complexes (Fig. 3b). We observed that the average contact potentials (3.5 Å) of the complexes decreases from −31.95 to −8.22 kcal/mol with the decrease in the affinity range of the complex from −20 to −16 kcal/mol and −8 to −4 kcal/mol (Fig. 3a). For the complexes with the binding affinity of −20 to −16 kcal/mol and −8 to −4 kcal/mol, the average number of polar residues are 82 and 43 (Fig. 3b), respectively. Inspection of results revealed that the average number of polar residues and contact potential decreases approximately two and four folds with the decrease in affinity in the range of −20 to −16 kcal/mol to −8 to −4 kcal/mol.
Fig. 3.

Variation of structural features of protein-DNA complexes at various ranges of binding free energies as (a) contact potentials at 3.5 Å and (b) number of polar residues in the interface of protein-DNA complexes.
3.5. Prediction of binding affinity
3.5.1. Single property correlation
We related the binding affinity of 391 protein-DNA complexes with each feature derived from protein-DNA complexes and obtained a maximum correlation (r) of 0.21. Earlier studies showed that the classification of protein–protein/protein-nucleic acid complexes based on structure and function improved the correlation for understanding the relationship between sequence/structural features with binding affinity [14,28–30]. Hence, we classified the dataset based on functional and structural classes of proteins as well as number of binding site residues with the condition that sufficient number of data are present in each class. Table 2 shows the correlation between structural features and binding affinity of protein-DNA complexes belonging to of different classes.
Table 2.
Best single property correlation for different classes of protein-DNA complexes.
| DNA strand | Structural class | Functional class | % Binding site residues | Feature | N | Maximum correlation (r) |
|---|---|---|---|---|---|---|
| Single stranded DNA (ssDNA) | Sidechain Hydrogen bond energy | 16 | 0.75 | |||
| Double stranded DNA (dsDNA) | all-α | Regulatory | High | Tilt of each strand of DNA | 48 | 0.44 |
| all-α | Regulatory | Low | Percentage of NN contacts between the protein and DNA | 36 | 0.45 | |
| all-α | Not-regulatory | Percentage of beta sheet in the binding site | 29 | 0.51 | ||
| all-β | Regulatory | Contact potential calculated with binding site cut off 3.5 Å | 24 | 0.58 | ||
| all-β | Not-regulatory | Number of Interface Residues Clashing | 21 | 0.54 | ||
| αβ | Regulatory | High | Electrostatic interaction | 44 | 0.61 | |
| αβ | Regulatory | Low | van der Waals clashes among the protein residues at the interface of the complex | 35 | 0.43 | |
| αβ | Not-regulatory | High | Contact potential calculated with binding site cutoff 6 Å | 49 | 0.41 | |
| αβ | Not-regulatory | Low | Percentage of atom contacts between N and C atoms of protein and DNA | 53 | 0.35 | |
| Others | van der Waals clashes among the DNA residues at the interface of the complex | 36 | 0.41 |
N: number of complexes; αβ includes α + β and α/β classes of proteins.
The classification of protein-DNA complexes based on structure, function and percentage of binding site residues improved the correlation in the range of 0.35–0.75. In single-stranded DNA, we obtained a maximum correlation of 0.75 between energy due to side chain hydrogen bonds and binding affinity (Fig. 4). Interestingly, previous study showed that hydrogen bonds at the interface are the major contributors to protein–ssDNA binding affinity [31]. In addition, electrostatic interactions, which are favored by the highly negatively charged surface of DNA with positive charged amino acid residues also showed a correlation of 0.61 in the αβ-regulatory with high percentage of binding site residues. In all-β-regulatory complexes contact potentials showed the highest correlation of 0.58.
Fig. 4.

Relationship between side chain hydrogen bond energy and experimental binding affinity of protein-single stranded DNA complexes.
3.5.2. Multiple regression technique for predicting the binding affinity
We have utilized multiple regression technique to combine the features for predicting the binding affinity and the results are presented in Table 3. The selected features and regression equations obtained for each class are presented in Supplementary Table S3 and Supplementary Table S4, respectively. We observed that the correlation lies in the range of 0.77 to 0.98 with MAE in the range of 0.16 to 1.27 kcal/mol in all the sub classes in the training set. Further, on evaluating the model with jack-knife test, we obtained a correlation in the range of 0.64 to 0.96 with MAE of 0.24 to 1.53 kcal/mol. Overall, our method could relate the binding affinity of 391 complexes with a correlation of 0.86 and MAE of 0.76 kcal/mol on training, and a correlation of 0.78 and MAE of 0.98 kcal/mol, in jack-knife test. The relationship between experimental and predicted binding affinities are shown in Fig. 5, and for all the individual classes of protein-DNA complexes are provided in Supplementary Fig. S2. Further, we have examined the performance using 10-fold cross validation and the results are presented in Supplementary Table S5. Our method showed an average correlation and MAE of 0.75 and 1.02 kcal/mol, respectively.
Table 3.
Prediction of experimental ΔG using multiple linear regression technique.
| Classes | N | Features | Self-consistency | Jack-knife test | ||||||
|---|---|---|---|---|---|---|---|---|---|---|
| r | MAE | p-value | spearman | r | MAE | p-value | spearman | |||
| ssDNA | 16 | 4 | 0.98 | 0.16 | 9.01E-11 | 0.94 | 0.96 | 0.24 | 6.99E-09 | 0.93 |
| dsDNA | ||||||||||
| all-α-regulatory-high | 48 | 7 | 0.81 | 1.02 | 4.85E-12 | 0.75 | 0.72 | 1.22 | 6.81E-09 | 0.65 |
| all-α-regulatory-low | 36 | 6 | 0.84 | 0.74 | 1.27E-10 | 0.79 | 0.75 | 0.94 | 1.77E-07 | 0.68 |
| all-α-not regulatory | 29 | 5 | 0.81 | 0.84 | 8.70E-08 | 0.77 | 0.68 | 1.11 | 0.000047 | 0.68 |
| all-β-regulatory | 24 | 5 | 0.93 | 0.64 | 3.66E-11 | 0.93 | 0.81 | 1.04 | 0.000002 | 0.86 |
| all-β-not regulatory | 21 | 5 | 0.96 | 0.43 | 1.27E-11 | 0.89 | 0.92 | 0.61 | 5.41E-09 | 0.84 |
| αβ-regulatory-high | 44 | 7 | 0.89 | 0.79 | 4.69E-16 | 0.76 | 0.80 | 1.01 | 7.14E-11 | 0.67 |
| αβ-regulatory-low | 35 | 6 | 0.86 | 0.72 | 2.62E-11 | 0.83 | 0.79 | 0.89 | 2.36E-08 | 0.76 |
| αβ-not-regulatory-high | 49 | 7 | 0.77 | 1.27 | 1.54E-10 | 0.70 | 0.64 | 1.53 | 8.27E-07 | 0.63 |
| αβ-not regulatory-low | 53 | 7 | 0.81 | 1.1 | 1.85E-13 | 0.75 | 0.74 | 1.32 | 2.44E-10 | 0.69 |
| Others | 36 | 6 | 0.82 | 0.67 | 7.66E-10 | 0.77 | 0.75 | 0.83 | 1.84E-07 | 0.67 |
Fig. 5.

A scatter plot showing the relationship between experimental and predicted binding affinities on jack-knife test.
3.6. Analysis of features important for binding affinity of protein-DNA complexes
The features selected in each class of protein-DNA complexes to predict the binding affinity are presented in Supplementary Table S3. Further, we grouped these features based on interaction energy, structural features, percentage of secondary structures, accessible surface area and base step parameters, and the results are shown in Table 4 under different categories such as protein-based, DNA-based and interaction-based. We observed that interaction-based features are important in most of the models (except all-α-regulatory-high and αβ-regulatory-low). Single-stranded DNA class mainly depends on interaction-based features whereas DNA-based features are dominant in αβ-regulatory-low class.
Table 4.
Comparison of features used in each classification model.
| Single Stranded-DNA | all-α-regulatory-high | all-α-regulatory-low | all-α-not-regulatory |
|---|---|---|---|
|
Interaction-based features Ionization Energy Electrostatic energy Number of interface atoms van der Waals energy |
Protein-based features Volume ASA % secondary structure Helix dipole DNA-based features Base step parameters |
Protein-based features Volume DNA-based features Base step parameters Interaction-based features Torsional clash Atomic contacts |
Interaction-based features
Torsional clash Protein-based features % secondary structure DNA-based features Base step parameters |
| all-β-regulatory | all-β-not regulatory | αβ -regulatory-high | αβ -regulatory-low |
|
Interaction-based features Atomic contacts ASA Contact potential |
Interaction-based features
ASA Protein-based features % secondary structure |
Interaction-based features ASA Electrostatic energy Atomic contacts Protein-based features Residue depth |
DNA-based features
Base step parameters |
| αβ-not regulatory-high | αβ-not regulatory-low | others | |
|
Interaction-based features Contact Potential ASA DNA-based features Base step parameters Protein-based features % secondary structure |
Interaction-based features Atomic contacts van der Waals energy Solvation energy Interaction energy Ionization Energy Hydrogen bond |
Interaction-based features Interaction Energy Solvation energy Atomic contacts DNA-based features ASA |
|
The features present in 2 or more classes are shown in italics.
We observed that base step parameters and accessible surface area are important to predict the binding affinity in most of the classes of protein-DNA complexes. In addition, atomic contacts and contact potentials are identified in mixed class proteins (αβ). Interestingly, non-regulatory proteins belonging to mixed class is dominated with interaction energies. This analysis reveals the importance of specific features common to several classes of protein-DNA complexes. Detailed analysis of each class is provided in Supplementary information.
3.7. Comparison of our method with PreDBA
Yang et al. [14] developed a machine-based learning model, PreDBA, to predict the protein-DNA binding affinity, which was trained on 100 non-redundant complexes. To compare our predictions with PreDBA, we tested the model developed in Yang et al. [14] with our dataset. We excluded the redundant protein-DNA complexes that are used in their training dataset and obtained a test dataset of 225 complexes. PreDBA provides the binding affinity for each chain of the protein against each strand of DNA. Hence, protein-DNA complexes with more than one protein or DNA chain, we computed the affinity for all the possible combinations of DNA and protein pairs and considered the closest prediction to the experimental binding affinity to estimate the correlation/MAE. Fig. 6 shows the relationship between experimental and predicted binding affinities obtained with PreDBA (Fig. 6a) and in the present work (Fig. 6b).
Fig. 6.

Prediction of protein-DNA binding affinity in a set of 225 non-redundant complexes (a) PreDBA and b) present work.
We observed that our method predicted with an average correlation of 0.76 and MAE of 0.98 kcal/mol, while average correlation of PreDBA was 0.32 with MAE of 1.86 kcal/mol. The improved performance in our method is mainly due to the classification of complexes and the availability of experimental affinity for a large number of protein-DNA complexes in ProNAB database [11]. Supplementary Table S6 shows the results for each class of protein-DNA complexes based on structure and function.
3.8. Prediction on the web
We have developed a web server, PDA-PreD, for predicting the binding affinity of protein–DNA complexes. It takes the protein–DNA complex structure in PDB format or the PDB ID as input. The output includes the predicted value of binding affinity ΔG and the dissociation constant (Kd) computed using the equation, ΔG = -RT ln(Kd). The web server is freely accessible at https://web.iitm.ac.in/bioinfo2/pdapred/.
3.9. Case study with DNA Polymerase I -DNA complex
We have explored the binding affinity of DNA Polymerase I-DNA complex (2HHU) using structural features identified in this work. It belongs to αβ non-regulatory class with binding site residues less than the average. It has the experimental binding affinity of −4.03 kcal/mol and our model predicted the affinity as −4.33 kcal/mol, which shows a good agreement. Fig. 7 shows the interactions between the sugar-phosphate backbone of the DNA and the protein. We analyzed the individual features used in the model to predict the binding affinity of the complex. Our analysis showed that it has high percentage of CO atom contacts with preferred atomic contact potentials, backbone hydrogen bond energy of −10.6 kcal/mol and favorable van der Waals and total interaction energies of −24.5 kcal/mol and −162.3 kcal/mol, respectively. The combination of these parameters could correctly predict the binding affinity of the complex with a deviation of 0.3 kcal/mol.
Fig. 7.
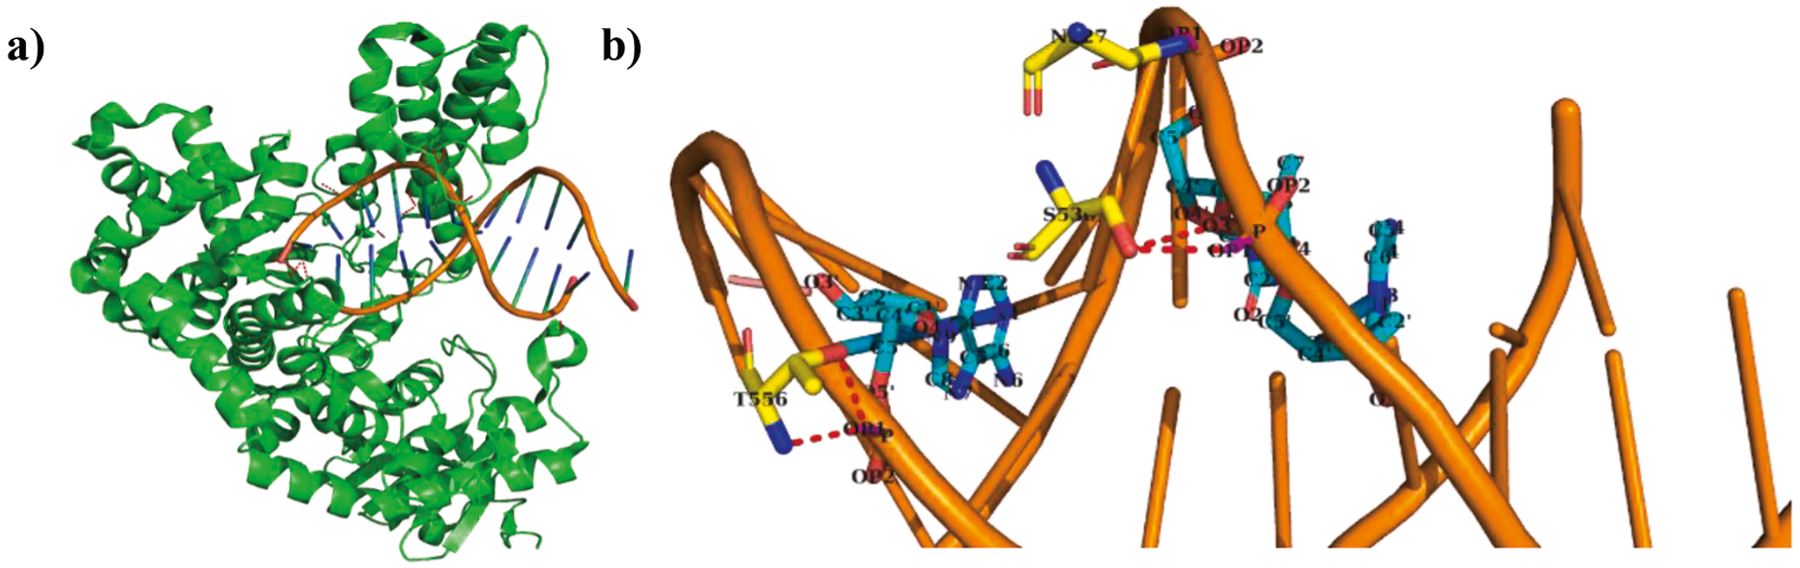
a) Structure of DNA Polymerase I-DNA complex (2HHU), b) Interaction between the sugar-phosphate backbone of the DNA (in orange) and amino acid residues (in yellow) in the protein. The backbone phosphate is highlighted in magenta, and the hydrogen bond interactions are shown in red dotted lines.
4. Conclusions
We have systematically analyzed the relationship between structural features of protein, DNA as well as interaction energy, and binding affinity of protein-DNA complexes. Our analysis showed that interaction energy, contact potential, number of interface atoms, ASA of protein and DNA, surface area and volume of the protein, and DNA base step parameters are important to understand the binding affinity. Further, classification of complexes based on structure, function and binding site residues are important to account the binding affinity. We have developed multiple regression-based methods for predicting the binding affinities of the protein-DNA complexes and our method showed an average correlation of 0.78 and MAE of 0.98 in a jack-knife test, which are better than other existing methods in the literature. We have developed a web server for predicting the binding affinity and it will be useful for large scale analysis and developing strategies for therapeutic targets.
Supplementary Material
Acknowledgements
We acknowledge the Indian Institute of Technology Madras and Purdue University for computational facilities. We thank all the members from Protein Bioinformatics Lab for providing valuable suggestions and Rahul Nikam for helping with the web server. Ms. Divya Sharma is acknowledged for critical reading of the manuscript. The work is partially supported by the Science and Engineering Research Board (SERB), Ministry of Science and Technology, Government of India to MMG (No. CRG/2020/000314) and Overseas Visiting Doctoral Fellowship program (OVDF 2022) to HK. DK acknowledges support from the National Institutes of Health (R01GM123055, R01GM133840, 3R01GM133840-02S1) and the National Science Foundation (DMS2151678, DBI2003635, CMMI1825941, DBI2146026, IIS2211598, and MCB1925643) of USA.
Footnotes
Declaration of Competing Interest
The authors declare that they have no known competing financial interests or personal relationships that could have appeared to influence the work reported in this paper.
CRediT authorship contribution statement
K. Harini: Methodology, Software, Writing – original draft. Daisuke Kihara: Methodology. M. Michael Gromiha: Conceptualization, Methodology, Supervision.
Appendix A. Supplementary data
Supplementary data to this article can be found online at https://doi.org/10.1016/j.ymeth.2023.03.002.
Data availability
Data will be made available on request.
References
- [1].Wu Y, Lu J, Kang T, Human single-stranded DNA binding proteins: guardians of genome stability, Acta Biochim. Biophy. Sin 48 (7) (2016) 671–677. [DOI] [PubMed] [Google Scholar]
- [2].Gromiha MM, Nagarajan R, Computational approaches for predicting the binding sites and understanding the recognition mechanism of protein-DNA complexes, Adv. Protein Chem. Struct. Biol 91 (2013) 65–99. [DOI] [PubMed] [Google Scholar]
- [3].Nagarajan R, Ahmad S, Gromiha MM, Novel approach for selecting the best predictor for identifying the binding sites in DNA binding proteins, Nucleic Acids Res. 41 (16) (2013) 7606–7614. [DOI] [PMC free article] [PubMed] [Google Scholar]
- [4].Si J, Zhao R, Wu R, An overview of the prediction of protein DNA-binding sites, Int. J. Mol. Sci 16 (3) (2015) 5194–5215. [DOI] [PMC free article] [PubMed] [Google Scholar]
- [5].Aderinwale T, Christoffer CW, Sarkar D, Alnabati E, Kihara D, Computational structure modeling for diverse categories of macromolecular interactions, Curr. Opin. Struct. Biol 64 (2020) 1–8. [DOI] [PMC free article] [PubMed] [Google Scholar]
- [6].Gromiha MM, Protein Interactions: computational methods, analysis and applications, World Scientific, Singapore, 2020. [Google Scholar]
- [7].Zhang Y, Bao W, Cao Y, Cong H, Chen B, Chen Y, A survey on protein-DNA-binding sites in computational biology, Brief. Funct. Genomics 21 (5) (2022) 357–375. [DOI] [PubMed] [Google Scholar]
- [8].Crocker J, Noon EP, Stern DL, The Soft Touch: Low-Affinity Transcription Factor Binding Sites in Development and Evolution, Curr. Top. Dev. Biol 117 (2016) 455–469. [DOI] [PubMed] [Google Scholar]
- [9].Ladbury JE, Counting the calories to stay in the groove, Structure 3 (7) (1995) 635–639. [DOI] [PubMed] [Google Scholar]
- [10].Rastogi C, Rube HT, Kribelbauer JF, Crocker J, Loker RE, Martini GD, Laptenko O, Freed-Pastor WA, Prives C, Stern DL, Mann RS, Bussemaker HJ, Accurate and sensitive quantification of protein-DNA binding affinity, Proc. Natl. Acad. Sci. U.S.A 115 (16) (2018). [DOI] [PMC free article] [PubMed] [Google Scholar]
- [11].Harini K, Srivastava A, Kulandaisamy A, Gromiha MM, ProNAB: database for binding affinities of protein-nucleic acid complexes and their mutants, Nucleic Acids Res. 50 (D1) (2022) D1528–D1534. [DOI] [PMC free article] [PubMed] [Google Scholar]
- [12].Pant P, Pathak A, Jayaram B, Bicyclo-DNA mimics with enhanced protein binding affinities: insights from molecular dynamics simulations, J. Biomol. Struct. Dyn (2022) 1–8. [DOI] [PubMed] [Google Scholar]
- [13].Barissi S, Sala A, Wieczór M, Battistini F, Orozco M, DNAffinity: a machine-learning approach to predict DNA binding affinities of transcription factors, Nucleic Acids Res. 50 (16) (2022) 9105–9114. [DOI] [PMC free article] [PubMed] [Google Scholar]
- [14].Yang W, Deng L, PreDBA: A heterogeneous ensemble approach for predicting protein-DNA binding affinity, Sci. Rep 10 (1) (2020) 1278. [DOI] [PMC free article] [PubMed] [Google Scholar]
- [15].Christoffer C, Kihara D, Domain-Based Protein Docking with Extremely Large Conformational Changes, J. Mol. Biol 434 (21) (2022) 167820. [DOI] [PMC free article] [PubMed] [Google Scholar]
- [16].Narayanan BC, Westbrook J, Ghosh S, Petrov AI, Sweeney B, Zirbel CL, Leontis NB & Berman HM (2014) The Nucleic Acid Database: new features and capabilities. Nucleic Acids research.,42, D114–122. [DOI] [PMC free article] [PubMed] [Google Scholar]
- [17].Hubbard SJ, Thornton JM, NACCESS, University College London, Department of Biochemistry and Molecular Biology, 1993.
- [18].Voss NR, Gerstein M, 3V: cavity, channel and cleft volume calculator and extractor, Nucleic Acids Res. 38 (Web Server) (2010) W555–W562. [DOI] [PMC free article] [PubMed] [Google Scholar]
- [19].Li S, Olson WK, Lu XJ, Web 3DNA 2.0 for the analysis, visualization, and modeling of 3D nucleic acid structures, Nucleic Acids Res. 47 (W1) (2019) W26–W34. [DOI] [PMC free article] [PubMed] [Google Scholar]
- [20].Schymkowitz J, Borg J, Stricher F, Nys R, Rousseau F, Serrano L, The FoldX web server: an online force field, Nucleic Acids Res. 33 (Web Server) (2005) W382–W388. [DOI] [PMC free article] [PubMed] [Google Scholar]
- [21].Cornell WD, Cieplak P, Bayly CI, Gould IR, Merz KM, Ferguson DM, Spellmeyer DC, Fox T, Caldwell JW, Kollman PA, A second generation force field for the simulation of proteins, nucleic acids, and organic molecules, J. Am. Chem. Soc 117 (19) (1995) 5179–5197. [Google Scholar]
- [22].Siva Shanmugam NR, Jino Blessy J, Veluraja K, Gromiha MM, Prediction of protein-carbohydrate complex binding affinity using structural features, Brief. Bioinform 22 (4) (2021) bbaa319. [DOI] [PubMed] [Google Scholar]
- [23].Kono H, Sarai A, Structure-based prediction of DNA target sites by regulatory proteins, Proteins 35 (1) (1999) 114–131. [PubMed] [Google Scholar]
- [24].Pedregosa F, Varoquaux G, Gramfort A, Michel V, Thirion B, Grisel O, Blondel M, Prettenhofer P, Weiss R, Dubourg V, VanderPlas J, Passos A, Cournapeau D, Brucher M, Perrot M, Duchesnay E, Scikit-learn: machine learning in python, J Machine Learning Res 12 (2011) 2825–2830. [Google Scholar]
- [25].Virtanen P, Gommers R, Oliphant TE, Haberland M, Reddy T, Cournapeau D, Burovski E, Peterson P, Weckesser W, Bright J, van der Walt SJ, Brett M, Wilson J, Millman KJ, Mayorov N, Nelson ARJ, Jones E, Kern R, Larson E, Carey CJ, Polat İ, Feng Y, Moore EW, VanderPlas J, Laxalde D, Perktold J, Cimrman R, Henriksen I, Quintero EA, Harris CR, Archibald AM, Ribeiro AH, Pedregosa F, van Mulbregt P, SciPy 1.0: Fundamental Algorithms for Scientific Computing in Python, Nat. Methods 17 (3) (2020) 261–272. [DOI] [PMC free article] [PubMed] [Google Scholar]
- [26].Meysman P, Zhou C, Cule B, Goethals B, Laukens K, Mining the entire Protein DataBank for frequent spatially cohesive amino acid patterns, BioData mining 8 (2015) 4. [DOI] [PMC free article] [PubMed] [Google Scholar]
- [27].Wilson KA, Kellie JL, Wetmore SD, DNA-protein π-interactions in nature: abundance, structure, composition and strength of contacts between aromatic amino acids and DNA nucleobases or deoxyribose sugar, Nucleic Acids Res. 42 (10) (2014) 6726–6741. [DOI] [PMC free article] [PubMed] [Google Scholar]
- [28].Yugandhar K, Gromiha MM, Feature selection and classification of protein-protein complexes based on their binding affinities using machine learning approaches, Proteins 82 (9) (2014) 2088–2096. [DOI] [PubMed] [Google Scholar]
- [29].Jemimah S, Sekijima M, Gromiha MM, ProAffiMuSeq: sequence-based method to predict the binding free energy change of protein-protein complexes upon mutation using functional classification, Bioinformatics (Oxford, England) 36 (6) (2020) 1725–1730. [DOI] [PubMed] [Google Scholar]
- [30].Deng L, Yang W, Liu H, PredPRBA: Prediction of Protein-RNA Binding Affinity Using Gradient Boosted Regression Trees, Front. Genet 10 (2019) 637. [DOI] [PMC free article] [PubMed] [Google Scholar]
- [31].Lin M, Malik FK, Guo JT, A comparative study of protein-ssDNA interactions, NAR genomics and bioinformatics 3 (1) (2021) lqab006. [DOI] [PMC free article] [PubMed] [Google Scholar]
Associated Data
This section collects any data citations, data availability statements, or supplementary materials included in this article.
Supplementary Materials
Data Availability Statement
Data will be made available on request.