

Abstract
The effect of anti‐HIV‐1 antibodies on complement activation at the surface of infected cells remains partly understood. Here, we show that a subset of anti‐Envelope (Env) broadly neutralizing antibodies (bNAbs), targeting the CD4 binding site and the V3 loop, triggers C3 deposition and complement‐dependent cytotoxicity (CDC) on Raji cells engineered to express high surface levels of HIV‐1 Env. Primary CD4 T cells infected with laboratory‐adapted or primary HIV‐1 strains and treated with bNAbs are susceptible to C3 deposition but not to rapid CDC. The cellular protein CD59 and viral proteins Vpu and Nef protect infected cells from CDC mediated by bNAbs or by polyclonal IgGs from HIV‐positive individuals. However, complement deposition accelerates the disappearance of infected cells within a few days of culture. Altogether, our results uncover the contribution of complement to the antiviral activity of anti‐HIV‐1 bNAbs.
Keywords: broadly neutralizing antibodies, complement, HIV‐1
Subject Categories: Immunology; Microbiology, Virology & Host Pathogen Interaction
Anti‐HIV‐1 antibodies trigger complement deposition at the surface of infected cells. Some viral and cellular components independently limit complement activation after infection, preventing rapid cell lysis, although coated cells disappear faster than non‐coated cells.
Introduction
The complement is a network of proteins initially described for its ability to induce cell toxicity 1. Due to its ancestral origin, the complement is highly intricated within innate and adaptive immune systems 2. The three canonical mechanisms of complement activation, known as classical, alternative and lectin pathways, converge to the proteolytic cleavage of component 3 (C3) into C3a and C3b. The Fc regions of membrane‐bound antibody multimers initiate the classical pathway 3. Covalent binding of C3b on targeted membranes promotes different events. Cleaved forms of complement proteins are recognized by complement receptors (CRs), expressed by numerous immune cells, such as macrophages, NK cells, or dendritic cells (DC) 4. CRs cooperate with Fc receptors (FcR) to modulate immune responses against antibody‐decorated targets 5. Complement deposition at the plasma membrane triggers intrinsic signaling pathways impacting cell fate or activation 6, 7, 8. C3 deposition may lead to the assembly of the C5b‐9 complex, also termed the membrane attack complex (MAC), that induces membrane disruption and cell death 9. Intracellular sensing of complement C3 also activates cell autonomous immunity 10.
The HIV‐1 glycoproteins gp120 and gp41 assemble as a trimer to form the viral envelope (Env). Recognition of the receptor CD4 reorganizes Env to allow fusion by exposing the fusion peptide of gp41. Env exists in at least two conformations, a native “close” configuration and a CD4‐bound “open” conformation (reviewed in 11). Numerous broadly neutralizing monoclonal antibodies (bNAbs) targeting the HIV‐1 Env glycoprotein have been isolated 12, 13. These antibodies target the CD4 binding site (CD4bs), the N‐glycans of V1/V2 and V3 loops, the gp41 membrane proximal external region (MPER), and the gp120/gp41 interface 12. In animal models, infusion of bNAbs protects against HIV‐1 acquisition, decreases viral load 14, 15, modulates host immune responses 16, 17, and, when associated to latency‐reversal agents, delays viral rebound after treatment interruption 18, 19. At least nine bNAbs are currently under clinical evaluation, either alone or in combination, and display antiviral activity in humans 20.
The activity of bNAbs goes beyond neutralization. Their Fc region is required for optimal in vivo efficacy 21, 22, 23. bNAbs kill HIV‐1‐infected cells by inducing antibody‐dependent cellular cytotoxicity (ADCC) 24, 25 and mediate antibody‐dependent cellular phagocytosis 26. A growing body of evidence highlights the importance of complement in antibody‐based therapies 27. However, little is known about the ability of bNAbs to activate the complement system, and how this activation may modulate their function.
HIV‐1 virions are vulnerable to complement‐mediated lysis (i.e., virolysis) 28, 29. Plasma from HIV‐1‐infected individuals mediates virolysis 30, 31. During primary infection, virolysis inversely correlates with viremia, suggesting that it may limit viral replication 30. However, HIV‐1 counteracts virolysis by incorporating host proteins CD55 and CD59 during budding 32, 33. CD55 prevents the formation of C4b2a and C3bBb C3‐convertases, whereas CD59 interferes with MAC assembly. HIV‐1 may also take advantage of the complement pathway 34. C3 opsonization of virions favors the infection of CR‐expressing cells and leads to HIV‐1 persistence in germinal centers (GC) by trapping viral particles on follicular DC 34.
Upon infection, cell lines display variable susceptibility to complement‐dependent cytotoxicity (CDC) mediated by anti‐HIV antibodies 35, 36, 37, 38, 39. This may be explained by the inconstant capacity of polyclonal IgGs to recognize cell‐associated Env, and by various levels of CD46, CD55, and CD59 expressed in different cells 32, 40, 41. Cells that have captured viral material 42, 43, or at an early stage of infection, have been proposed to be the main target of CDC 35. Anti‐V1/V2 glycans 35 and anti‐V3 antibodies 36, 44 were suggested to be better CDC inducers than other antibodies. Yet, the impact of the most recent bNAbs on the complement pathway has not been thoroughly analyzed.
Here, we investigated how bNAbs and polyclonal antibodies activate the complement at the surface of infected cells. Using Env‐expressing cell lines and infected primary CD4 T cells, we measured C3 deposition and CDC induction. We report that only a subset of bNAbs, targeting the CD4 binding site and the V3 loop, triggers efficient C3 deposition. The Fc mutation E430G increases complement activity of HIV‐1 bNAbs. Infected primary T cells treated with these bNAbs and decorated with C3 are not sensitive to CDC. The viral accessory proteins Vpu and Nef down‐modulate Env levels and C3 deposition at the plasma membrane, whereas the cellular protein CD59 prevents rapid lysis of infected cells. However, complement‐coated infected cells disappear within a few days of culture.
Results
Identification of complement‐activating anti‐Env antibodies
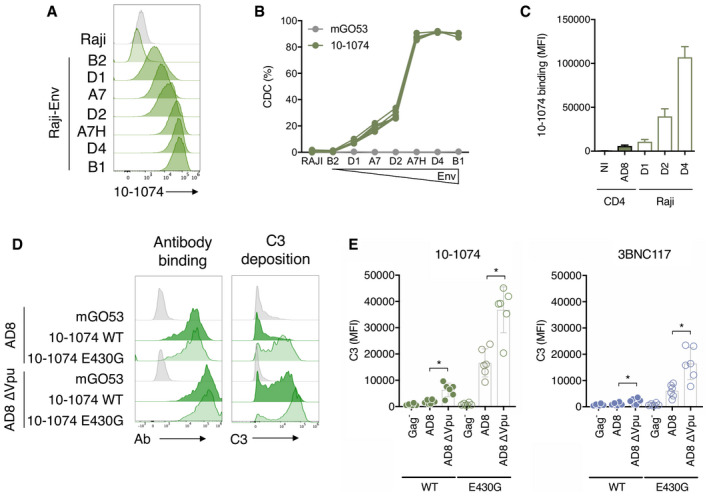
We selected a panel of 22 neutralizing (bNAb) and non‐neutralizing (nnAb) antibodies targeting various epitopes of HIV‐1 Env (Appendix Table S1) to study their ability to activate the complement pathway. We engineered a Raji B cell derivative stably expressing high levels of YU2‐Env (Raji‐Env cells). We chose Raji cells because (i) they lack CD4 and Env is not fusogenic in the absence of CD4, (ii) they do not express CD59, making them highly sensitive to complement lysis, and (iii) treatment with the anti‐CD20 antibody rituximab (RTX) triggers complement activation in Raji cells 45, providing a convenient positive control. Env present at the surface of Raji cells was correctly folded and functional, as demonstrated by the formation of syncytia after co‐culture with CD4+ T cells (not shown). As complement activation requires antibody binding, we first evaluated by flow cytometry the ability of our panel of antibodies to recognize Raji‐Env cells (Fig 1A and B). We used RTX as a positive control. At 15 μg ml−1, anti‐Env antibodies bound to Raji‐Env cells with different intensities, when compared to the isotype control (Fig 1A and B). The three anti‐V3 and two of the CD4bs bNAbs (N6 and 3BNC117) displayed a high median fluorescence intensity (MFI) of binding (Fig 1B). The bNAbs targeting V1/V2, gp120/41 interface, and MPER, as well as the nnAbs were less efficient binders. The anti‐HIV antibodies did not bind to parental Raji cells (not shown).
Figure 1. A subset of anti‐HIV‐1 antibodies triggers C3 deposition and CDC of Env‐expressing cells.
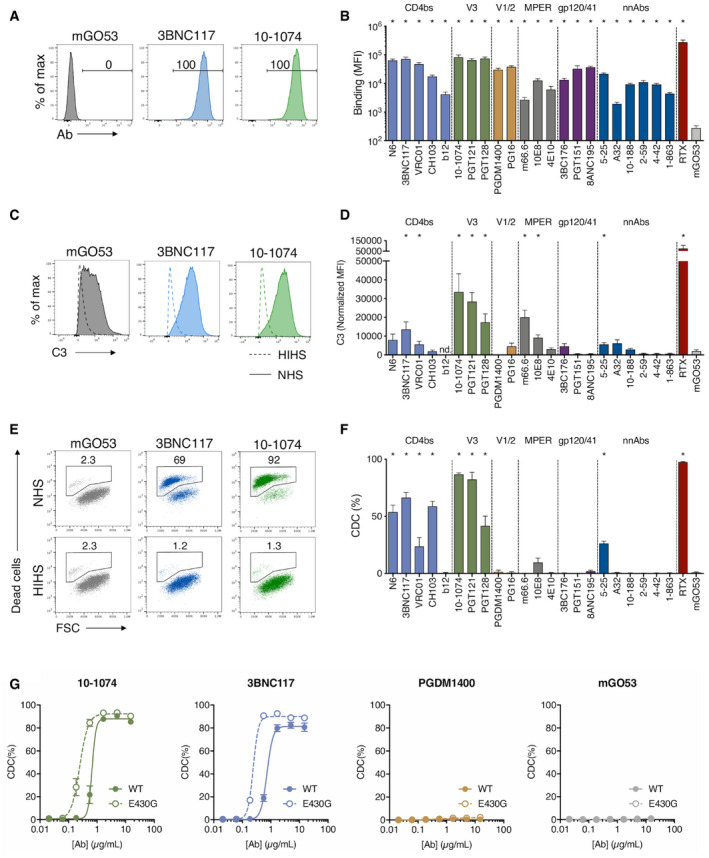
- Raji cells stably expressing HIV‐1 YU‐2 Env (Raji‐Env) were stained with bNAbs (10‐1074 or 3BNC117) or isotype control (mGO53) and analyzed by flow cytometry. The numbers indicate the % of positive cells. One representative experiment is shown.
- Binding of the 24 indicated antibodies to the surface of Raji‐Env cells. Results are expressed as the median fluorescence intensity (MFI) of staining. n = 6 independent experiments.
- Raji‐Env cells were incubated with indicated antibodies and either normal (NHS) or heat‐inactivated (HIHS) human serum. After 1 h, surface levels of C3 were analyzed by flow cytometry. One representative experiment is shown.
- C3 deposition by the 24 indicated antibodies. For each antibody, a normalized MFI is calculated by subtracting the MFI of the “no antibody” condition. (nd. not done). n = 3 donors of serum.
- Raji‐Env cells were incubated with indicated antibodies and either normal (NHS) or heat‐inactivated (HIHS) human serum. After 24 h, cell death was determined by flow cytometry. The numbers indicate the percentage of dead cells. One representative experiment is shown.
- CDC induction by the 24 indicated antibodies. The % of CDC was calculated as the relative percentage of dead cells compared to the “no antibody” condition. n = 3 donors of serum.
- Raji‐Env cells were incubated for 24 h with NHS and indicated concentrations of WT or E430G mutant bNAbs (10‐1074, 3BNC117, or PGDM1400) or isotype control (mGO53). Cell death was measured by flow cytometry, and the % of CDC was calculated as the relative % of dead cells compared to the “no antibody” condition. n = 3 donors of serum.
Complement activation was then evaluated by exposing the cells to antibodies and normal human serum (NHS) as a source of complement (Fig 1C–F). Cells cultivated without NHS or with heat‐inactivated human serum (HIHS) were used as negative controls (Fig EV1A and B, and not shown). The activation of C3 was assessed by measuring C3b/iC3b deposition (later referred to as C3 deposition) by flow cytometry after 1 h (Fig 1C and D), and CDC was assessed by measuring the appearance of dead cells 24 h later (Fig 1E and F). The efficiency of C3 deposition varied with the antibodies, the more potent being those targeting the V3 loop, as well as some CD4bs and MPER bNAbs (Fig 1C and D). No detectable C3 deposition was observed in cells treated with antibodies and HIHS (Fig EV1A) or in the absence of anti‐Env antibodies (Fig 1C and D). CDC induction was even more selective, as only bNAbs targeting the CD4bs and V3 loop triggered a large extent of cell death (Fig 1E and F). MPER bNAbs display no or limited CDC. Of note, m66.6, an anti‐MPER antibody known to be polyreactive against self and non‐self antigens 46, displayed C3 deposition in the absence of CDC. The two V1/V2 and the three gp120/41 interface bNAbs tested triggered neither C3 deposition nor CDC, despite a strong binding at the surface.
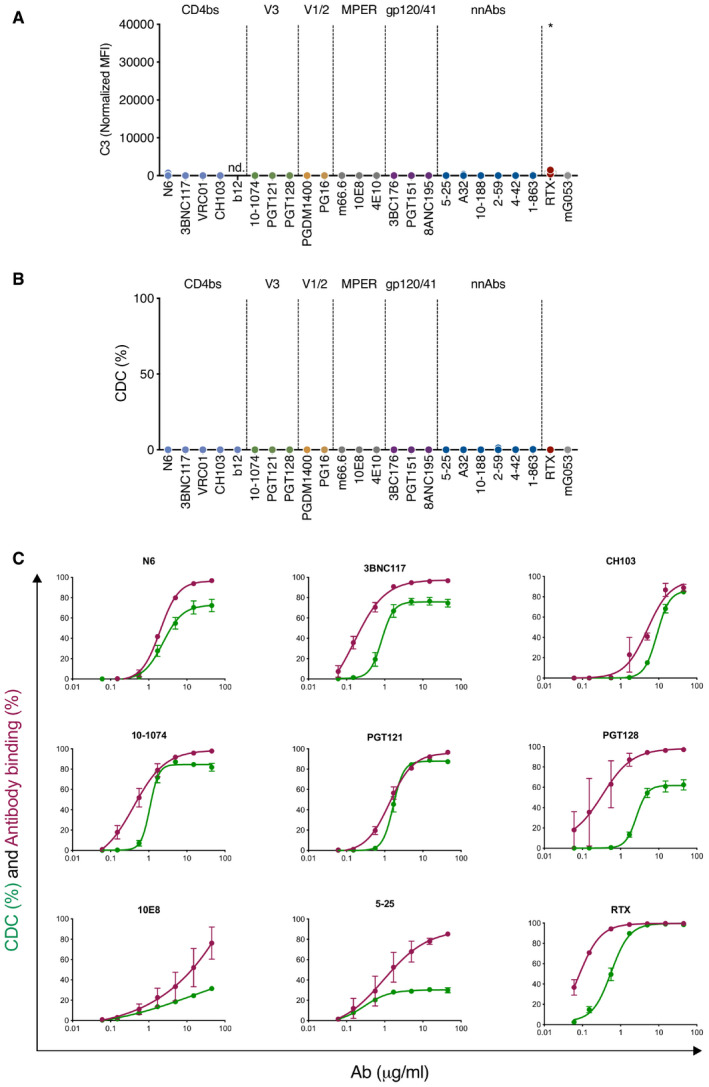
Figure EV1. Controls with heat‐inactivated sera and dose–response analysis of a panel of anti‐HIV‐1 Env antibodies.
-
A, BRaji‐Env cells were incubated 24 h with the indicated antibody and HIHS. After 1 h, C3 surface levels were analyzed by flow cytometry (A). For each antibody, a normalized MFI is calculated by subtracting the MFI of the “no antibody” condition. (nd. not done; n = 3 donors of serum). After 24 h, cell death was determined by flow cytometry (B). The % of CDC was calculated as the relative percentage of dead cells compared to the “no antibody” condition (n = 3 donors of serum).
-
CGreen: Raji‐Env cells were cultured for 24 h with the indicated concentration of each antibody and NHS (n = 6). The % of CDC was calculated as the relative percentage of dead cells compared to the “no antibody” condition. Purple: Raji‐Env cells were incubated with the indicated concentration of each antibody, and the antibody surface levels were determined by flow cytometry. Results are expressed as the % of cells bound by the antibody.
To further characterize these antibodies, we performed a dose–response analysis of their Env‐binding and CDC activities (Fig EV1C). Both were dose‐dependent, with EC50 varying with the antibodies. All antibodies plateaued at 15 μg ml−1, with different levels of CDC (Appendix Table S2). We also visualized CDC in real time by time‐lapse microscopy. The addition of propidium iodide (PI), which stains the nucleus of dying cells, allowed to follow the fate of Raji‐Env cells. In the presence of 10‐1074 and NHS, cell death occurred in most cells in about 3 h (Movie EV1).
We then sought to enhance the CDC activity of some of these antibodies by introducing a Fc point mutation (E430G) that favors hexamer organization and subsequent complement activation 47. We chose two CDC‐activating antibodies targeting distinct epitopes (3BNC117 and 10‐1074) and one CDC‐incompetent antibody (PGDM1400; Fig 1G). Introduction of the E430G mutation decreased the EC50 by threefold for both 3BN117 and 10‐1074 (from 0.73 to 0.24 μg ml−1 and from 0.67 to 0.25 μg ml−1, respectively), and increased the plateau of 3BNC117 (from 81 to 90% of cell death). The E430G mutation did not rescue CDC activation by PGDM1400, highlighting the inability of this antibody to trigger complement attack.
Altogether, these results show that anti‐Env antibodies differ in their capacity to activate the complement. Only eight out of 22 antibodies triggered efficient C3 deposition and CDC. The most potent bNAbs target the CD4bs and the V3 loop. Modifying the Fc region can increase the CDC activity.
C3 deposition at the surface of HIV‐1‐infected primary CD4 T cells
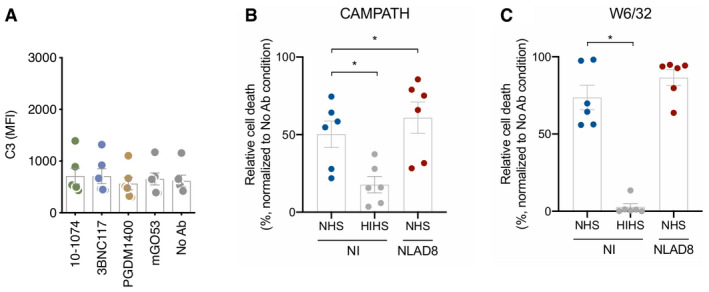
Raji‐Env cells do not recapitulate the complexity of HIV‐1‐infected cells as they express high levels of Env and lack other viral proteins. Moreover, they do not express CD59, one key regulator of CDC. We thus measured complement activation at the surface of HIV‐1‐infected primary CD4 T cells. We first used the laboratory‐adapted R5‐tropic strain NLAD8. Based on the screen in Raji‐Env cells, we selected antibodies that differ in their ability to activate the complement (3BNC117, 10‐1074, and PGDM1400). We first measured by flow cytometry the capacity of these antibodies to bind the surface of HIV‐1‐infected (Gag+) cells (Fig 2A). As previously reported 24, 43, 3BNC117, 10‐1074, and PGDM1400 efficiently recognized Gag+ cells, and not bystander Gag− cells (Fig 2A). The antibodies stained more than 75% of infected cells (Fig 2A). The highest and lowest MFIs were obtained with 10‐1074 and PGDM1400, respectively (Fig 2B). We next cultivated infected cells in the presence of antibodies and NHS to allow complement activation. We measured C3 deposition (Fig 2C and D) and MAC formation (C5b‐9 deposition; Fig 2E and F) on Gag+ cells by flow cytometry. We quantified CDC by assessing the disappearance of infected cells, as previously performed in ADCC assays (Fig 2G and H) 48. 3BNC117 and 10‐1074 triggered C3 and C5b‐9 deposition at the surface of Gag+ cells, when compared to controls (Fig 2D and F). Complement deposition was not detectable on bystander Gag− cells (Fig EV2A). PGDM1400, which did not trigger complement deposition in Raji‐Env cells, was also inactive in T cells (Fig 2D and F). The frequency of infected cells similarly decreased after 24 h of culture with bNAbs and NHS or HIHS, likely reflecting the neutralizing activity of the antibodies (Fig 2G). We used the HIHS condition to calculate the relative disappearance of infected cells (see Methods). Using seven different donors of primary CD4 T cells, we did not detect CDC activity (Fig 2H). This absence of CDC was not due to an intrinsic resistance of primary CD4 T cells, as anti‐HLA‐A/B/C (W6/32) and anti‐CD52 (CAMPATH‐1) antibodies triggered efficient CDC in non‐infected cells (Fig EV2B and C). These two antibodies were also active in infected cells, indicating that HIV‐1 infection does not render cells resistant to CDC (Fig EV2B and C).
Figure 2. bNAbs allow complement deposition on HIV‐1‐infected CD4 T cells.
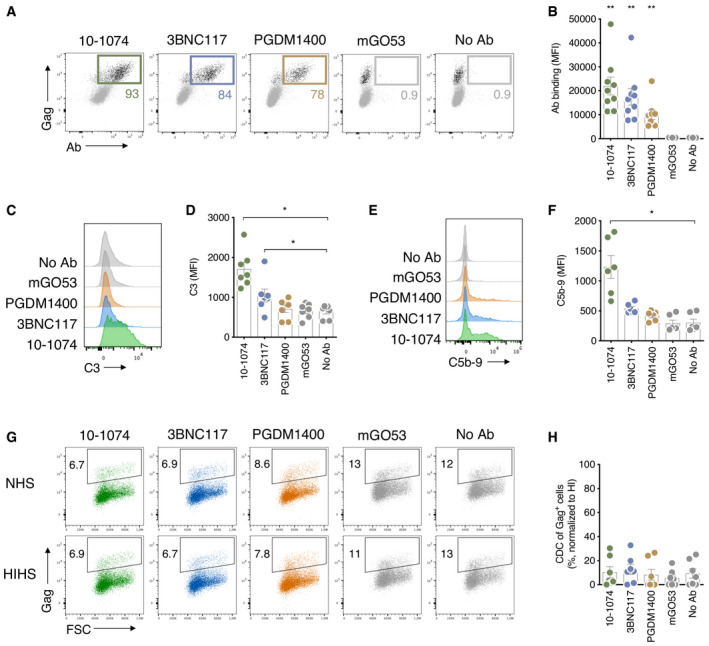
- Activated primary CD4 T cells were infected by HIV‐1 (strain NLAD8) and subjected to antibody binding assay. The numbers indicate the % of Gag+ cells that are decorated by the indicated antibodies. One representative experiment is shown.
- Antibody binding at the surface of HIV‐1‐infected primary CD4 T cells. Results are expressed as median fluorescence intensity (MFI) of staining on infected (Gag+) cells. Each dot represents a single donor of CD4 T cells. n = 9 donors of CD4 T cells.
- HIV‐1‐infected (strain NLAD8) CD4 T cells were cultured with the indicated antibody and NHS. After 24 h, the surface levels of C3 on infected cells (Gag+) were determined by flow cytometry. One representative experiment is shown.
- C3 surface levels at the surface of HIV‐1‐infected primary CD4 T cells. Results are expressed as MFI of staining on infected (Gag+) cells. Each dot represents a single donor of CD4 T cells. n = 7 donors of CD4 T cells.
- HIV‐1‐infected CD4 T cells (strain NLAD8) were cultured with the indicated antibody and normal (NHS) or heat‐inactivated (HIHS) human serum. After 24 h, the surface levels of C5b‐9 (MAC) on infected (Gag+) cells were determined by flow cytometry. One representative experiment is shown.
- C5b‐9 (MAC) surface levels on HIV‐1‐infected cells (strain NLAD8). Results are expressed as MFI of staining on infected (Gag+) cells. Each dot represents a single donor of CD4 T cells. n = 6 donors of CD4 T cells.
- HIV‐1‐infected CD4 T cells (strain NLAD8) were cultured with the indicated antibody and NHS or HIHS to determine complement‐mediated cytotoxicity. After 24 h, the percentage of infected (Gag+) cells in each condition was determined by flow cytometry. One representative experiment is shown.
- Complement‐mediated cytotoxicity of HIV‐1‐infected CD4 T cells (strain NLAD8). For each antibody, the % of CDC was calculated at 24 h as the % of disappearance of Gag+ cells in NHS compared to HIHS. Each dot represents a single donor of CD4 T cells. n = 7 donors of CD4 T cells.
Figure EV2. Primary CD4 T cells are sensitive to CDC triggered by antibodies targeting cellular proteins.
-
AHIV‐1‐infected (strain NLAD8) CD4 T cells were cultured with the indicated antibody and NHS. After 24 h, the surface levels of C3 on non‐infected bystander cells (Gag−) were determined by flow cytometry. Results are expressed as MFI of staining. Each dot represents a single donor of CD4 T cells/NHS combination. n = 3 donors of CD4 T cells.
-
B, CNon‐infected or HIV‐1‐infected (strain NLAD8) CD4 T cells were cultured with W6/32 (anti‐HLA‐A) or CAMPATH (anti‐CD52) and NHS or HIHS for 24 h. The % of CDC was calculated as the relative percentage of dead cells compared to the “no antibody” condition. Each dot represents a single donor of CD4 T cells. n = 6 donors of CD4 T cells.
Overall, these results show that anti‐Env antibodies can trigger C3 deposition and MAC formation at the surface of primary HIV‐1‐infected CD4 T cells. Complement deposition by bNAbs does not lead to rapid cell lysis.
Env levels and Vpu regulate C3 deposition by bNAbs
HIV‐1 regulates Env expression at the cell surface, limiting antibody binding and ADCC 48. We thus hypothesized that Env levels may modulate C3 deposition and CDC. We generated Raji‐Env clones stably expressing various levels of viral glycoproteins, as observed by the increase in the MFI of 10‐1074 binding (Fig 3A). Of note, 10‐1074 does not bind to parental Raji cells (Fig 3A). We measured the ability of 10‐1074 (15 μg ml−1) to trigger CDC in these cells (Fig 3B). The efficacy of C3 deposition and CDC increased with the surface levels of Env (Fig 3B and not shown). We selected three Raji‐Env clones with low (D1), intermediate (D2), and high (D4) Env levels and compared these levels to those found at the surface of HIV‐1‐infected primary CD4 T cells (Fig 3C). Infected primary CD4 T cells exposed a lower amount of Env than the clone D1, which was poorly sensitive to CDC. This suggests that the quantity of Env exposed at the surface of infected T cells is too low to allow CDC induction by 10‐1074.
Figure 3. Low Env levels on HIV‐1‐infected CD4 T cells limit complement deposition.
- Raji‐Env cells were subcloned to obtain cell lines expressing increasing amounts of Env. Env surface levels were determined by the binding of 10‐1074 and measured by flow cytometry. One representative experiment is shown.
- Parental Raji cells and the different Raji‐Env clones were cultured with 10‐1074 or an isotype control (mGO53) and NHS for 24 h. The % of CDC was calculated as the relative percentage of dead cells compared to the “no antibody” condition. n = 3 donors of serum.
- Non‐infected (NI) and HIV‐1‐infected primary CD4 T cells (strain NLAD8) as well as three Raji‐Env clones (D1, D2 and D4) were incubated with 10‐1074, and antibody surface levels were analyzed by flow cytometry. Results are expressed as median fluorescence (MFI) of staining in total cells (Raji, n = 3 independent experiments) or in infected (Gag+) cells (CD4 T cells, n = 5 donors).
- HIV‐ or HIV∆Vpu‐infected CD4 T cells (strain NLAD8) were subjected to antibody binding with indicated antibodies, and surface levels were determined by flow cytometry (left panel). The staining obtained with mGO53 was similar to the background signal observed on unstained cells. Infected cells were cultured with the indicated antibodies and NHS for 24 h, and the C3 surface levels on infected (Gag+) cells were determined by flow cytometry (right panel). One representative experiment is shown.
- HIV‐ or HIV∆Vpu‐infected CD4 T cells (strain NLAD8) were incubated with NHS and either 10‐1074 (left panel) or 3BNC117 (right panel). Both WT‐ or E430G‐mutated antibodies were used. After 24 h, C3 surface levels on infected cells were analyzed by flow cytometry. Results are expressed as MFI of staining on infected (Gag+) cells. The MFI of C3 staining on Gag− cells was included as a control. Each dot represents a single donor of CD4 T cells. n = 6 donors of CD4 T cells.
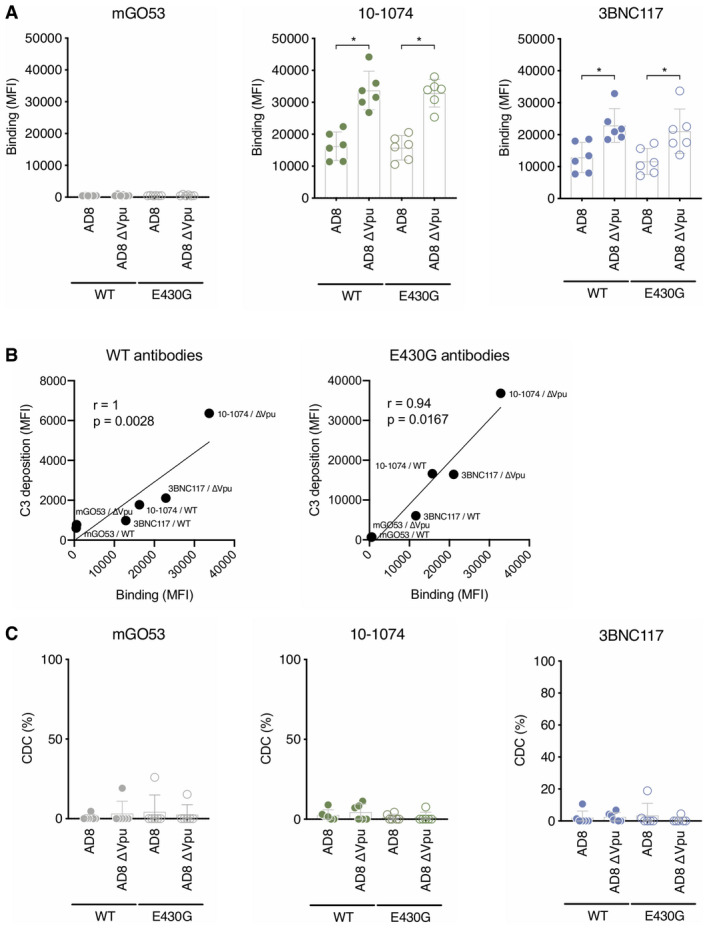
The viral accessory protein Vpu eliminates the cellular protein tetherin/BST‐2 from the membrane of infected cells. Tetherin retains budding viral particles at the cell surface, limiting viral spread and increasing recognition of infected cells by antibodies and ADCC 49, 50, 51. Whether Vpu prevents C3 deposition or CDC is unknown. We thus compared antibody‐mediated complement activation on CD4 T cells infected with WT or ΔVpu HIV‐1 (NLAD8 strain). We tested the two most potent CDC antibodies, 10‐1074 and 3BNC117, and their complement‐enhanced E430G Fc variants. As expected, Vpu deletion increased binding of both antibodies at the cell surface (Figs 3D and EV3A). The E430G mutation did not influence antibody recognition of infected cells (Figs 3D and EV3A). However, deletion of Vpu significantly increased C3 deposition, with either 3BNC117 or 10‐1074 (2.1‐ and 3.5‐fold, respectively; Fig 3D and E). The E430G mutation further increased C3 deposition, (six‐ and ninefold, with 3BNC117 and 10‐1074, respectively). The highest level of C3 deposition was triggered by 10‐1074E430G antibody against ∆Vpu‐infected cells (20‐fold increase compared to the WT virus and a non‐mutated antibody). Antibody binding correlates with C3 deposition (Fig EV3B). However, none of these conditions was associated with CDC (Fig EV3C).
Figure EV3. Antibody binding correlates to complement deposition.
- Primary CD4 T cells were infected by HIV‐1 (strain NLAD8 WT or ∆Vpu). The binding of the WT or E430G indicated antibodies was measured by flow cytometry. Results are expressed as median fluorescence (MFI) of staining on infected (Gag+) cells. Each dot represents a single donor of CD4 T cells. n = 6 donors of CD4 T cells.
- Correlations between WT (left) or E430G (right) antibody binding and C3 deposition on CD4 T cells infected with WT or ∆Vpu HIV‐1 (strain NLAD8). Each dot is the mean of 6 donors of CD4 T cells. Correlation was analyzed by Spearman correlation. Correlation coefficient (r) and P‐value are indicated.
- WT or ∆Vpu HIV‐1‐infected CD4 T cells (strain NLAD8) were cultured with the indicated WT or E430G mutant antibodies and NHS or HIHS to determine complement‐mediated cytotoxicity. After 24 h, the percentage of infected (Gag+) cells in each condition was determined by flow cytometry. For each antibody, the % of CDC was calculated at 24 h as the % of disappearance of Gag+ cells in NHS compared to HIHS. Each dot represents a single donor of CD4 T cells. n = 6 donors of CD4 T cells.
Overall, these results show that the quantity of Env at the surface controls bNAb‐mediated complement deposition. Vpu reduces Env levels and C3 deposition on infected cells.
CDC induction by anti‐Env antibodies is counteracted by CD59
The complement regulatory protein CD59 inhibits the assembly of the MAC 52. We observed CDC in Raji‐Env cells that lack CD59, whereas CD4 T cells express high levels of CD59 (Fig 4A). Thus, we asked whether CD59 may prevent CDC of HIV‐infected T cells. We knocked out CD59 in primary CD4 T cells using the CRISPR‐Cas9 system. Seven days after CD59 CRIPSR‐Cas9 delivery, the knockout efficiency reached 67–97% when compared to control treatment (Fig 4A). The MFI of CD59 was identical to the isotype control, suggesting a complete elimination of the protein (Fig 4A). Control and CD59KO cells were infected with WT or Vpu‐deleted NLAD8 and subjected to complement activation with 10‐1074 or 10‐1074E430G (Fig 4B and C). No CDC was detectable in control HIV‐infected cells (Fig 4C). In contrast, when CD59 was removed, CDC occurred with both WT and ΔVpu (Fig 4C). The highest level of CDC was achieved with ∆Vpu‐infected cells bound with 10‐1074E430G (up to 80% of elimination of infected cells). Of note, HIV‐1 infection did not modulate CD59 surface levels (Fig 4D). Therefore, CD59 prevents CDC by bNAbs. The effects of CD59 and Vpu are additive.
Figure 4. CD4 T‐cell lysis by complement is restricted by CD59.
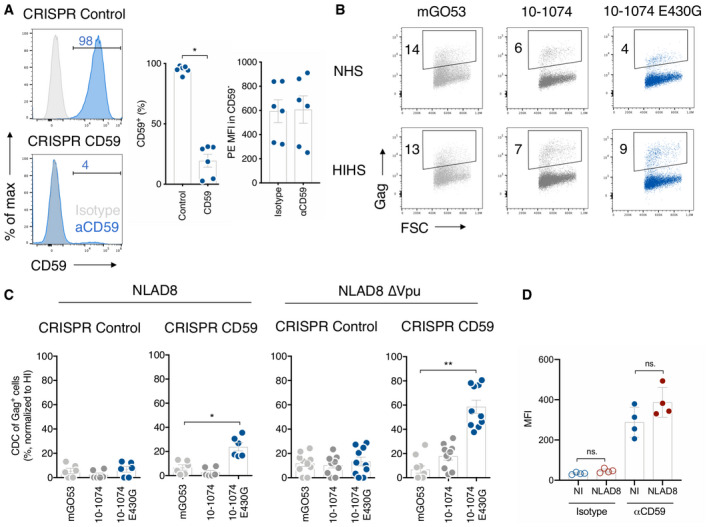
- Primary CD4 T cells were nucleofected with a control (CRISPR Control) or anti‐CD59 (CRISPR CD59) guide RNA/Cas9 complex. CD59 surface levels were analyzed by flow cytometry 7 days after nucleofection. Isotype control (gray) and CD59 stainings (blue). One representative experiment is shown on the left. Numbers indicate the % of CD59+ cells (middle) or the MFI of staining in CD59− cells (right). Each dot represents a single donor of CD4 T cells. n = 6 donors of CD4 T cells.
- NLAD8∆Vpu‐infected CD59 KO primary CD4 T cells were cultured with indicated antibodies and NHS or HIHS for 24 h. Numbers indicate the percentage of infected (Gag+) cells. One representative experiment is shown.
- CD59‐KO (CRISPR CD59) or control (CRISPR Control) CD4 T cells infected with HIV WT (left) or HIVΔVpu (right; strain NLAD8) were cultured with the indicated antibody, and NHS or HIHS for 24 h. The % of CDC was calculated as the % of disappearance of Gag+ cells after culture with NHS compared to HIHS. Each dot represents a single donor of CD4 T cells. n= at least 6 donors of CD4 T cells.
- CD59 surface levels on non‐infected (NI) or HIV‐1‐infected (strain NLAD8) primary CD4 T cells were analyzed by flow cytometry. Results are expressed as the MFI of staining with an isotype control or the anti‐CD59 antibody. n = 4 donors of CD4 T cells.
Increased disappearance of infected T cells in the presence of complement
We next determined whether non‐lytic complement deposition influences the fate of infected cells. To eliminate dying and bystander cells, we sorted infected cells. Primary CD4 T cells were infected with HIV‐1 for 1 day, and the fraction of productively infected cells was enriched by magnetic depletion of non‐infected (CD4high) cells (Fig 5A). Enriched WT‐ or ΔVpu NLAD8‐infected cells (up to 90% of Gag+ cells) were then splitted into different cultures and incubated with either 10‐1074E430G or isotype control, in the presence of either NHS or HIHS. Cells were maintained in the presence of the reverse transcriptase inhibitor nevirapine to prevent viral propagation to remaining non‐infected cells. The frequency of HIV‐1‐infected cells was then assessed in living cells (live/dead negative) at days 1, 2, 3, and 6 (Figs 5 and EV4A). NHS was not toxic and did not impact growth of uninfected CD4 T cells (Fig EV4B). As expected, a strong cytopathic effect was observed in all conditions and the frequency of Gag+ cells decreased overtime (Fig 5B). The frequency of HIV‐1‐infected cells was lower in cultures containing NHS, as compared to HIHS, suggesting that the complement by itself may impact the survival of infected cells. Moreover, in the presence of NHS, 10‐1074E430G strongly decreased the percentage of infected cells overtime, when compared to the isotype control (Fig 5B). At day 6 after treatment with 10‐1074E430G and NHS, the percentage of Gag+ cells was significantly lower than in control conditions (Fig 5C). At day 3, the relative percentage of Gag+ cells with 10‐1074 in NHS compared to HIHS was lower with ∆Vpu than with WT‐infected cells (58 and 26% for WT and ∆Vpu, respectively; P = 0.0312; Wilcoxon test; Fig 5D).
Figure 5. Increased disappearance of infected cells in the presence of complement.
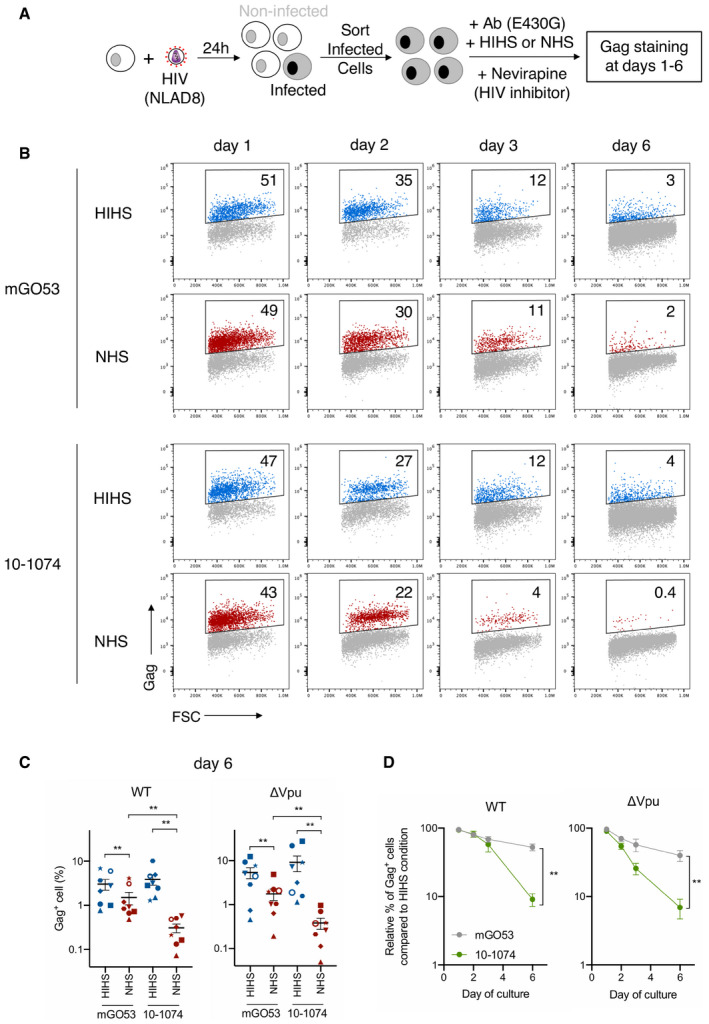
- Primary CD4 T cells were infected with WT or ΔVpu HIV‐1 (NLAD8 strain). After 24 h, productively infected cells were enriched by magnetic depletion of CD4high cells, and cultured with the indicated E430G‐mutated antibodies and with NHS or HIHS. The % of Gag+ was measured in live cells by flow cytometry at days 1, 2, 3, and 6.
- HIV‐1‐infected primary CD4 T cells were cultured with the indicated antibodies (E430G) and with NHS or HIHS. The frequency of infected cells was assessed by flow cytometry in live cells at days 1, 2, 3, and 6. Numbers indicate the percentage of infected (Gag+) cells. One representative experiment is shown.
- Frequency of live HIV‐1‐infected cells (NLAD8 WT or ΔVpu strain) 6 days after incubation with the indicated antibodies, and with NHS or HIHS. Each donor of CD4 T cells is represented by a different symbol. n = 8 donors of CD4 T cells.
- Elimination of HIV‐1‐infected cells (strain NLAD8 WT or ΔVpu) over culture with the indicated antibody (E430G), and NHS or HIHS. The frequency of % infected (Gag+) cells is determined by flow cytometry. The mean relative percentage of infected cells in NHS compared to the HIHS condition is depicted. n = 6–8 donors of CD4 T cells.
Figure EV4. 10‐1074E430G does not trigger CDC of infected cells.
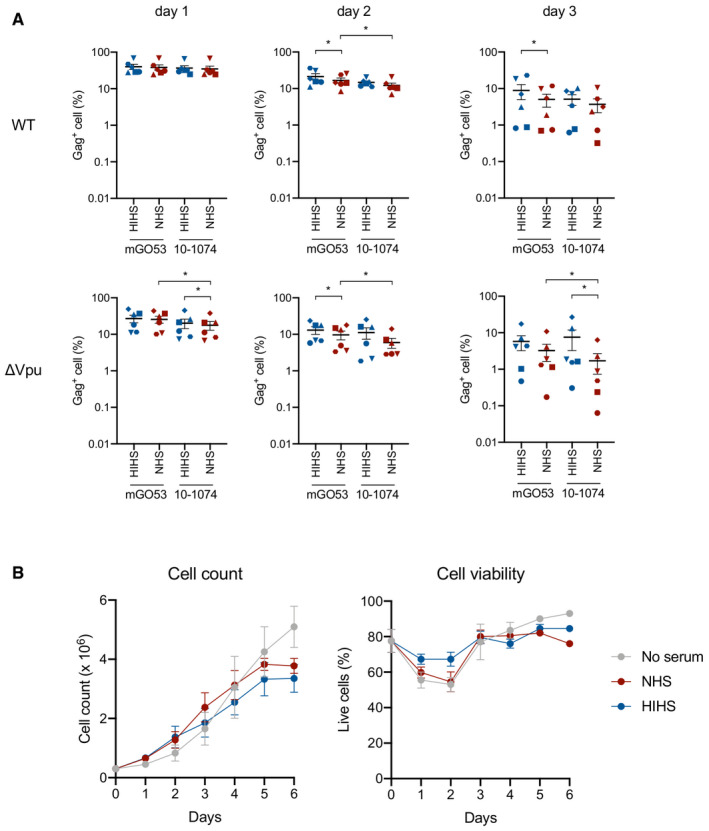
- Frequency of live HIV‐1‐infected cells (NLAD8 WT or ΔVpu strain) at days 1, 2, and 3 after incubation with the indicated antibodies (E430G), and with NHS or HIHS. Each donor of CD4 T cells is represented by a different symbol. n = 6 donors of CD4 T cells. Error bars indicate SEM. *P < 0.05, Wilcoxon test; only significant comparisons are depicted.
- Non‐infected primary CD4 T cells were incubated or not with 50% NHS or HIHS, and cell count and viability were measured each day for 6 days (n = 4). Error bars indicate SEM.
Altogether, these results suggest that the complement accelerates the disappearance of HIV‐1‐infected cells, through a mechanism that does not involve rapid CDC.
Primary HIV‐1 strains are susceptible to complement deposition mediated by bNAbs
We next asked whether bNAbs may trigger complement deposition in cells infected with primary isolates of HIV‐1. We infected CD4 T cells with two transmitted/founder HIV‐1 strains (CH058 and CH077) and a virus isolated from the reservoir of an HIV‐1‐infected individual (vKB18) 24 (Fig 6). We tested 10‐1074, 3BNC117, and their E430G variants. The two bNAbs efficiently bound cells infected with CH058 and vKB18, while CH077‐infected cells were preferentially recognized by 3BNC117 (Fig 6A). CH058‐infected cells displayed complement deposition with 3BNC117E430G, 10‐1074, and to a higher extent with 10‐1074E430G (Fig 6B and C). The four bNAbs also triggered C3 deposition at the surface of vKB18‐infected cells, with the highest values obtained with 10‐1074E430G (Fig 6C). With CH077‐infected cells, C3 deposition was observed only with 10‐1074E430G and 3BNC117E430G (Fig 6C). None of these conditions was associated with significant CDC (Fig 6D). Thus, lymphocytes infected by primary HIV‐1 strains are targeted by bNAbs that instigate complement deposition.
Figure 6. bNAbs trigger complement deposition on CD4 T cells infected with primary HIV‐1 strains.
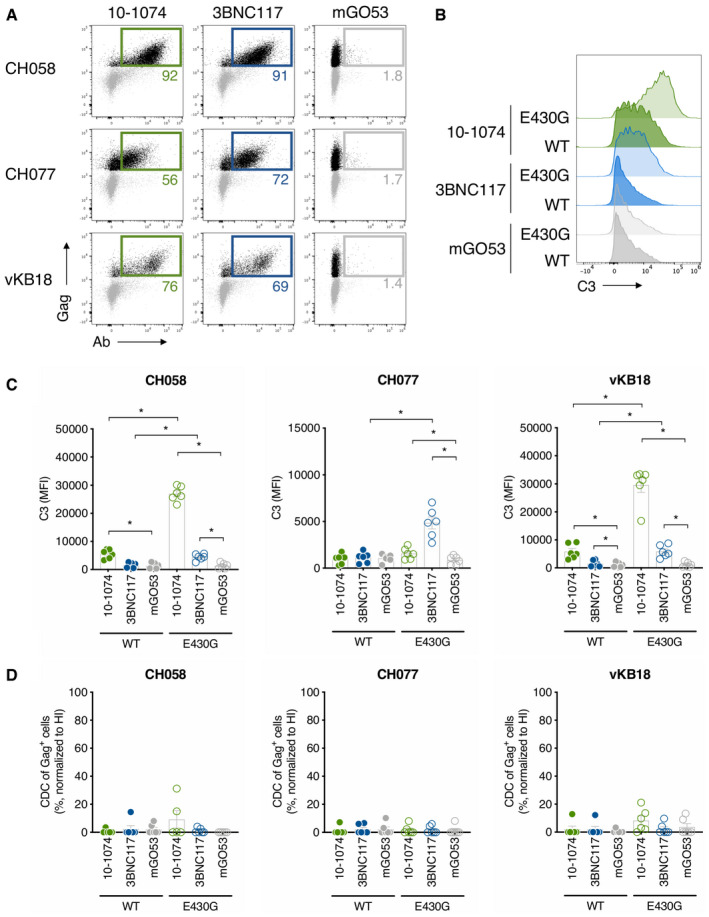
- Primary CD4 T cells infected with HIV‐1 (transmitted/founder strains CH058 and CH077, and the primary strain vKB18) were incubated with the indicated bNAbs, and surface levels were analyzed by flow cytometry. The numbers indicate the % of bNAb+ cells among infected (Gag+) cells. The percentages of infected cells were 27, 30, and 6% for CH058, CH077, and vKB18, respectively. One representative experiment is shown.
- CH058‐infected CD4 T cells were cultured with the indicated WT or E430G mutant antibody and NHS. After 24 h, the C3 surface levels on infected (Gag+) cells were determined by flow cytometry. One representative experiment is shown.
- CH058‐, CH077‐, and vKB18‐infected primary CD4 T cells were incubated with the indicated antibodies and NHS. After 24 h, C3 surface levels on infected cells were analyzed by flow cytometry. Results are expressed as MFI of staining on infected (Gag+) cells. Each dot represents a donor of CD4 T cells. n = 6 donors of CD4 T cells.
- Primary CD4 T cells infected with the indicated HIV‐1 strains (CH058, CH077, or vKB18) were cultured with the indicated WT or E430G mutant antibodies and NHS or HIHS to determine complement‐mediated cytotoxicity. After 24 h, the percentage of infected (Gag+) cells in each condition was determined by flow cytometry. For each antibody, the % of CDC was calculated at 24 h as the % of disappearance of Gag+ cells in NHS compared to HIHS. Each dot represents a single donor of CD4 T cells. n = 6 donors of CD4 T cells.
Polyclonal anti‐HIV antibodies activate the complement at the surface of infected cells and are counteracted by Vpu and Nef
We next determined whether antibodies present in patients’ blood may activate the complement at the surface of infected cells. We tested sera from nine HIV‐1‐infected individuals under suppressive ART therapy (Appendix Table S3), and nine uninfected donors as controls. We first verified whether these sera harbor IgGs binding to HIV‐1 infected cells. We selected the transmitted/founder strain CH058 because its Env is recognized by a wide array of antibodies 43. The nine HIV+ sera recognized infected cells (Fig 7A). Moreover, complement deposition on CH058‐infected cells was triggered by eight out of the nine sera (Fig 7B).
Figure 7. Vpu and Nef limit complement deposition by HIV‐1‐infected individuals’ sera.
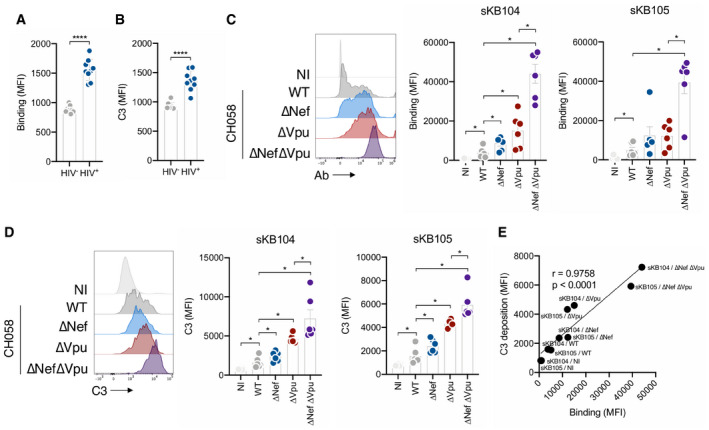
- HIV‐1‐infected primary CD4 T cells (strain CH058) were incubated with sera of HIV‐negative (HIV−; n = 9) or ART‐treated HIV‐1‐infected (HIV+; n = 9) individuals (serum dilution 1:1000). The levels of IgG binding on infected (Gag+) cells were analyzed by flow cytometry. Results are expressed as the MFI on infected (Gag+) cells. Error bars indicate SEM. ****P < 0.0001; Mann–Whitney test.
- CH058‐infected primary CD4 T cells were cultured for 24 h with sera of healthy (HIV−; n = 9) or ART‐treated HIV‐1‐infected (HIV+; n = 9) individuals (serum dilution 1:100) and 50% NHS from a healthy donor. C3 surface levels on infected (Gag+) cells were analyzed by flow cytometry. Results are expressed as the MFI on infected (Gag+) cells. Error bars indicate SEM. ****P < 0.0001; Mann–Whitney test.
- CD4 T cells not infected (NI) or infected with WT, ∆Nef, ∆Vpu, or ∆Nef∆Vpu HIV‐1 (strain CH058) were incubated with the serum of HIV‐1‐infected ART‐treated individuals (sKB104 or sKB105, dilution 1:1000). The levels of IgG binding on infected (Gag+) cells were analyzed by flow cytometry. One representative experiment is shown on the left. On the right, results are expressed as MFI of staining. Each dot represents a single donor of CD4 T cells. n = 6 donors of CD4 T cells. Error bars indicate SEM. *P < 0.05, Wilcoxon test. Only significant comparisons are depicted.
- Primary CD4 T cells either not infected (NI) or infected with WT, ∆Nef, ∆Vpu, or ∆Nef∆Vpu HIV‐1 (strain CH058) were incubated with 50% NHS from a healthy donor and serum of HIV‐1‐infected ART‐treated individuals (sKB104 or sKB105, dilution 1:100). The levels of C3 deposition on infected (Gag+) cells were analyzed by flow cytometry. One representative experiment is shown (left panel). Results are expressed as MFI of staining (right panel). Each dot represents a single donor of CD4 T cells. n = 6 donors of CD4 T cells.
- Correlation between patients’ sera (sK104 and sKB105) antibody binding and C3 deposition on CD4 T cells either mock‐infected or infected with WT, ∆Nef, ∆Vpu, or ∆Nef∆Vpu HIV‐1 (strain CH058). Each dot is the mean of 6 donors of CD4 T cells. Correlation was analyzed by Spearman correlation. Correlation coefficient (r) and P‐value are indicated.
In most individuals, the anti‐HIV‐1 polyclonal antibody response consists of non‐ or poorly neutralizing antibodies that preferentially recognize non‐functional or “open” conformation of Env (i.e., bound to the receptor CD4) 53, 54, 55. The viral protein Nef is an infectivity factor that down‐regulates various cellular proteins from the surface of infected cells, including CD4, MHC‐I, and SERINC3/5 56. Nef also modulates Env surface levels 57. By promoting CD4 internalization, Nef limits Env‐CD4 interactions at the membrane, thus decreasing recognition by nnAbs and ADCC 48. Nef synergizes with Vpu to counteract ADCC‐mediated killing of infected cells 49, 58. Whether a similar mechanism exists for complement activation is unknown. To address this question, we infected CD4 T cells with CH058 WT, ΔNef, ΔVpu, and ΔNefΔVpu viruses. We then measured polyclonal antibody binding and complement activation using the sera of two HIV‐infected individual (Fig 7C and D). As previously observed, ΔNef‐ and ΔVpu‐infected cells displayed higher antibody binding than WT‐infected cells (Fig 7C). The double mutant ΔNefΔVpu displayed an even higher binding (Fig 7C). Complement deposition correlated with antibody binding, with higher C3 deposition on ΔNef‐ and ΔVpu‐infected cells compared to the WT virus. This phenomenon was exacerbated on ΔNefΔVpu‐infected cells (Fig 7D and E).
These data demonstrate that the polyclonal antibody response present in patients can trigger complement deposition. This process is counteracted by Vpu and Nef, which both limit antibody recognition of HIV‐1‐infected cells.
Discussion
We report here that some bNAbs activate the complement at the surface of HIV‐1‐infected primary lymphocytes. In the presence of these bNAbs, infected cells display C3 deposition and MAC formation, but are not rapidly killed. CDC of infected lymphocytes is prevented by the low levels of Env at the surface, by the constitutively expressed molecule CD59, and by the viral accessory proteins Vpu and Nef. Introduction of a point mutation in the Fc region (E430G) of bNAbs potentiates complement activation.
We show that the capacity to activate the complement is antibody‐dependent and epitope‐specific. Antibody binding to Env is necessary but not sufficient to activate the complement. Using 22 monoclonal antibodies, we show that bNAbs against the CD4bs and V3 loop glycans are more effective than those targeting the V1/V2 loop, the MPER, the gp41/gp120 interface, or non‐neutralizing antibodies. Complement activation requires antibody hexamerization through Fc‐Fc interactions 3. It is thus likely that the antibody density and the accessibility or orientation of the Fc region dictate the potency of a given bNAb. V1/V2 glycan‐targeting antibodies bind on the apex of the trimer, on a quaternary epitope that allows only one Fab to bind per trimer 59. In contrast, the CD4bs and V3 loop authorize three Fab to bind each trimer 60, 61, possibly facilitating Fc‐Fc interactions. Further investigation will help uncovering the links that may exist between stoichiometry and orientation of antibodies binding to the viral envelope and their ability to trigger complement activation.
We also show that polyclonal antibodies present in the sera of infected individuals trigger C3 deposition, albeit less efficiently than bNAbs. Among the nnAbs tested in our study, only 5–25 (anti‐gp41) triggers complement deposition and weak lysis in Raji‐Env cells. Future work may help understanding whether the complement‐inducing capacity of polyclonal antibodies is due to specific epitopes, or to cooperation between antibodies targeting various epitopes. Combining antibodies may increase complement activation as previously observed for anti‐EGFR antibodies 62. How bNAbs recognizing non‐overlapping epitopes may synergize to promote CDC will deserve further investigation.
Envelope is present at the plasma membrane of infected cells to allow its incorporation into budding viral particles and to promote the formation of viral synapses with uninfected cells 63. Recognition of Env by antibodies neutralizes viral cell‐to‐cell spread and render infected cells susceptible to ADCC 24, 63. Here, we further demonstrate that membrane‐exposed Env may instigate complement deposition. Vpu limits Env surface levels, whereas Nef modulates Env conformation 48. Nef, through its ability to down‐regulate CD4 from the cell surface, counteracts ADCC mediated by non‐neutralizing CD4‐induced (CD4i) antibodies 49, 58. Our results uncover a novel function for Vpu and Nef, which limit Env exposure not only to escape ADCC, but also to avoid complement deposition.
We did not observe a rapid death of infected lymphocytes mediated by the complement pathway, even when the cells were opsonized by C3 and MAC. Knockout of CD59 by CRISPR‐Cas9 restored sensitivity to killing, confirming previous results obtained with blocking anti‐CD59 antibodies 40, 41. We further report that this non‐lytic complement deposition leads to an accelerated disappearance of infected cells within a few days of culture. This may be due to a sensing of complement at the cell surface, leading to intrinsic signaling and modulation of cellular activation, metabolism, or growth kinetics 6, 7, 8. Complement deposition may also trigger additional effects on infected cells, such as reducing infectivity of released virions 64 or increasing susceptibility to clearance by phagocytic cells 65. Complement‐dependent signaling through CD46 promotes a metabolic switch, with activation and contraction of T‐cell responses 66, 67. The mechanisms by which antibody‐mediated complement deposition modifies the fate of HIV‐1‐infected lymphocytes will deserve further experimentation.
Hessell et al 23 reported that the Fc domain of the first‐generation bNAb b12 is required for its prophylactic efficacy in macaques, independently of the complement pathway. We show here that b12 fails to activate the complement in Raji‐Env cells, probably because its binding affinity to Env is not sufficient. This may explain why the complement does not contribute to b12 efficacy in vivo. Here, we identified a subset of second‐generation bNAbs that trigger complement activation. Furthermore, the E430G mutation enhances the complement‐activating capacity of 10‐1074 and 3BNC117. Future experiments in animal models with such Fc‐engineered antibodies may help understanding the role of complement in antibody efficacy in vivo.
The complement is a critical adjuvant of humoral immune responses 68, 69. Complement activity correlates with the appearance of broadly neutralizing antibodies in HIV‐1‐infected individuals and with the humoral response in vaccinees 70, 71. Complement‐opsonized antigens are trapped by CR‐expressing follicular DC within GC, allowing antigen presentation to B cells undergoing affinity maturation 70, 72. Recognition of iC3b and C3dg by CR2 on B cells decreases the threshold of BCR stimulation, favoring an optimal response 73. Current clinical trials with bNAbs involve 3BNC117, VRC01, VRC07‐523, N6, 10‐1074, PGT121, PGDM1400, CAP256, 10E8, and derivatives 20. Infusion of 3BNC117 improves immune responses and increases HIV‐1 neutralization titers 17. In our hands, 3BNC117, N6, and 10‐1074 were more efficient at triggering complement activation than VRC01, PGDM1400, or 10E8. In humans, the antiviral effect of VRC01 is less marked than the two other antibodies. Future work will help understanding whether bNAbs that activate the complement display better therapeutic or prophylactic activities than other antibodies.
In conclusion, we demonstrate here that bNAbs and polyclonal anti‐HIV‐1 antibodies activate the complement at the surface of infected lymphocytes. Our study highlights how anti‐HIV‐1 antibodies use the complement and opens new avenues to exploit the complement system to fight HIV‐1.
Materials and Methods
Cells
Raji and 293T cells were obtained from the ATCC (ATCC® CCL‐86™ and ATCC® CRL‐3216™) and tested negative for mycoplasma. Peripheral blood mononuclear cells (PBMCs) were isolated from peripheral blood of healthy human donors from the Etablissement Français du Sang, in accordance with local ethical guidelines. CD4 T cells were obtained from PBMCs by positive immunomagnetic selection (Miltenyi) and activated for 3–5 days in the presence of IL‐2 (50 IU ml−1) and either T Cell TransAct™ (Miltenyi) or PHA (1 μg ml−1; Oxoid). To generate Env‐expressing cells, Raji cells were spinoculated (1,000 g for 1.5 h at 32°C) with a retroviral viral vector carrying Env (pMX‐YU2 ENVΔCT‐GFP‐PuroR) 74. Transduced cells (GFP+) were sorted and cultivated in the presence of puromycin (1 μg ml−1; Sigma). Various levels of Env expression were then obtained by subcloning. Briefly, limiting dilution in 96‐well plates allowed for expansion of single cells. Clones were selected based on Env expression, as evaluated by measuring GFP and Env (using a 10‐1074 staining; see below).
Viruses and infection
NLAD8 and transmitted‐founder HIV‐1 strains (CH058, CH077; obtained from the NIH AIDS Reagent Program) were prepared by the transfection of 293T cells along with vesicular stomatitis virus G to normalize infectivity. vKB18 was isolated from the reservoir of an ART‐treated HIV‐1‐infected individual with undetectable viral load 24 and amplified on activated CD4 T cells from healthy individuals. No more than two passages were performed. Cells were infected for 4 h in the presence of HEPES and DEAE/Dextran, washed to remove unbound viral particles, and cultured in the presence of IL‐2 (50 IU ml−1) for up to 2–3 days before performing further experiments. Viral inocula were adjusted to achieve similar levels of Gag+ cells at 48 h post‐infection. When indicated, the fraction of live productively infected lymphocytes was enriched by magnetic depletion of non‐infected, CD4high cells present in the population. Depletion was performed after 24 h of infection, using LD columns (Miltenyi) and CD4 microbeads (Miltenyi), according to the manufacturer's instructions. After sorting, up to 90% of the cells were CD4‐negative, as controlled by flow cytometry.
Antibodies
Anti‐Env monoclonal antibodies and the isotypic control mGO53 were produced as recombinant human IgG1 monoclonal antibodies by co‐transfection of Freestyle 293‐F suspension cells (Thermo Fisher Scientific) as previously described 61. Antibodies were purified by batch/gravity‐flow affinity chromatography using protein G sepharose 4 fast flow beads (GE Healthcare). The E430G point mutation was introduced in the IgG1 expression vector using the QuikChange Site‐Directed Mutagenesis Kit (Agilent Technologies). For biotinylation, antibodies were buffer‐exchanged to Biotinylation Reaction Buffer (Quanterix) using an Amicon Ultra‐0.5‐ml filter (Merk). Biotin (EZ‐Link NHS‐PEG4‐Biotin, Thermo Fisher) was added to the antibody solution at a molar ratio of 37.5 during 30 min at room temperature. Biotin in excess was removed with another Amicon dialysis step. Sera from ART‐treated HIV‐infected patients were also used at the indicated concentrations as a polyclonal source of anti‐Env antibodies. Each participant provided written consent to participate in the study, which was approved by the regional investigational review board (IRB; Comité de Protection des Personnes Ile‐de‐France VII, Paris, France) and performed according to the European guidelines and the Declaration of Helsinki. Sera from healthy donors were used as controls. To measure complement deposition, cells were incubated with anti‐C3/C3b/iC3b‐APC (Clone 6C9; Cedarlane) or anti‐C5b9 (clone aE11; Abcam) biotinylated in‐house (see above) followed by streptavidin–Alexa Fluor 647 (Thermo Fisher).
Binding of antibodies at the cell surface
Cells (0.5–1 × 10⁵) were incubated 30 min at 37°C with anti‐Env antibodies or with an isotype human IgG1 control (mGO53) at 15 μg ml−1 (unless otherwise stated), or with sera diluted 1:1,000. Cells were washed and incubated 30 min at 4°C with anti‐human IgG1 (H + L) Alexa Fluor 647 (1:400 dilution; Life Technologies). Cells were then fixed with 4% PFA and stained for intracellular Gag with the anti‐Gag KC57 murine monoclonal antibody as previously described 24. Env‐expressing Raji cells were stained using the same protocol, except that antibodies were biotinylated and revealed using a Alexa Fluor647‐conjugated streptavidin (1:400 dilution; Life Technologies). Data were acquired on an Attune Nxt (Life Technologies) and analyzed using FlowJo software.
Complement activation assays
Cells (0.5–1 × 10⁵) were cultivated in the presence of 50% normal (NHS) or heat‐inactivated (HIHS) human serum and with or without antibodies (monoclonal antibodies at 15 μg ml−1, unless otherwise stated, or patients’ sera diluted 1:100). When indicated, nevirapine (NIH AIDS Reagent Program) was added to infected CD4 T‐cell cultures at a final concentration of 12.5 μM. After 1 h (Raji) or 24 h (Raji and CD4 T cells), cells were incubated 30 min at 4°C with an APC‐conjugated anti‐C3 antibody to monitor complement activation at the cell surface (clone 6C9, Tebu‐bio, final dilution 1:50). To measure CDC of Raji cells, the live/dead fixable aqua dead cell marker (1:1,000 in PBS; Life Technologies) was added for 30 min at 4°C before fixation. CDC was calculated using the following formula: 100 × (% of dead cells with antibody − % of dead cells without antibody)/(100 − % of dead cells without antibody). For CD4 T cells, cells were fixed with 4% PFA and stained for intracellular Gag. In some experiments the live/dead fixable aqua dead cell marker (1:1,000 in PBS; Life Technologies) was added for 30 min at 4°C before fixation. For each antibody condition, CDC was calculated as the complement‐dependent disappearance of Gag+ cells with the following formula: 100 × (% of Gag+ cells in HIHS condition − % of Gag+ cells in NHS condition)/(% of Gag+ cells in HIHS condition). Negative values were set to zero.
CRISPR‐Cas9 knockout in primary CD4 T cells
CRISPR‐Cas9 knockout of primary CD4 T cells was adapted from 75, 76. To target CD59, three different crRNAs were used simultaneously (specific sequence: 5′‐CAAGGAGGGTCTGTCCTGTT‐3′, 5′‐TAGGACAGTTGTAGCACTGC‐3′, and 5′‐GTTCTGTGGACAATCACAAT‐3′, all ordered from Integrated DNA Technologies, IDT). Pre‐designed unspecific crRNA was used as control (IDT). crRNA and tracrRNA were resuspended in IDT Duplex Buffer according to the manufacturer's instructions. On the day of the nucleofection, duplexes were formed by mixing equimolar concentration of crRNA and tracrRNA, followed by 5‐min annealing at 95°C. RNA duplexes were then mixed (1:2) with TrueCut™ Cas9 Protein v2 (Thermo Fisher) for 10 min at RT to generate ribonucleoprotein (RNP) complexes. Three days after activation with TransAct (see above), 2 × 10⁶ CD4 T cells were resuspended in P3 Primary Cell Nucleofector™ Solution (Lonza), mixed with RNP and Alt‐R® Cas9 Electroporation Enhancer (90 pmol, IDT), and nucleofected in a 4D‐Nucleofector™ System (Lonza) using the P3 Primary Cell 4D‐Nucleofector™ X Kit S (program FI‐115). After nucleofection, cells were seeded in complete RPMI medium containing IL‐2 and T Cell TransAct™. Seven days after nucleofection, knockout efficacy was evaluated by flow cytometry using an anti‐CD59 antibody (Miltenyi, final dilution 1:50).
Data processing and statistical analysis
Calculations were performed and figures were drawn using Excel 365 or GraphPad Prism 8.0. Statistical analysis was performed using GraphPad Prism, with Wilcoxon matched paired t‐tests or Mann–Whitney unpaired t‐tests. Spearman correlation coefficients (r) were calculated using GraphPad Prism. Scales were adjusted in each graph to highlight statistically significant differences.
Author contributions
Conceptualization: JD, HM, OL, TB, OS; Methodology: JD, HM, TB, OS; Investigation: JD, FG‐B, JB, VL, LG, ED, GM, HM, TB, OS; Resources: KB, OL; Writing—original Draft: JD, TB, OS; Writing—review & editing: JD, HM, OL, TB, OS; Funding acquisition: OL, HM, OS; Supervision: TB, OS.
Conflict of interest
The authors declare that they have no conflict of interest.
Supporting information
Appendix
Expanded View Figures PDF
Movie EV1
Acknowledgements
We thank members of the Virus and Immunity Unit for discussion and help. We thank patients who participated in the study and Cécile Goujard for supervision of the patients’ enrollment. We thank the NIH AIDS Reagent Program for providing reagents. We thank Michel C. Nussenzweig (The Rockefeller University) for providing the pMX‐YU2 ENVΔCT‐GFP‐PuroR expression vector. We thank Frank Kirchhoff and Daniel Sauter (Ulm University) for providing CH058, CH058∆Nef, CH058∆Vpu, and CH058∆Nef∆Vpu plasmids. Work in OS laboratory is funded by Institut Pasteur, ANRS, Sidaction, the Vaccine Research Institute (ANR‐10‐LABX‐77), the Labex IBEID (ANR‐10‐IHUB‐0002), the “TIMTAMDEN” ANR‐14‐CE14‐0029, the “CHIKV‐Viro‐Immuno” ANR‐14‐CE14‐0015‐01, L'Oréal Sponsorship, and the Gilead HIV cure program. HM is supported by the European Research Council (ERC)—Seventh Framework Program (ERC‐2013‐StG 337146), the G5 Institut Pasteur Program, the Milieu Intérieur Program (ANR‐10‐LABX‐69‐01), the INSERM, and the ANRS. JD is supported by a grant from the French Ministry of Higher Education, Research and Innovation.
EMBO Reports (2020) 21: e49351
Contributor Information
Timothée Bruel, Email: tbruel@pasteur.fr.
Olivier Schwartz, Email: schwartz@pasteur.fr.
References
- 1. Mackay IR, Rosen FS, Walport MJ (2001) Complement. N Engl J Med 344: 1058–1066 [DOI] [PubMed] [Google Scholar]
- 2. Ricklin D, Reis ES, Lambris JD (2016) Complement in disease: a defence system turning offensive. Nat Rev Nephrol 12: 383–401 [DOI] [PMC free article] [PubMed] [Google Scholar]
- 3. Diebolder CA, Beurskens FJ, de Jong RN, Koning RI, Strumane K, Lindorfer MA, Voorhorst M, Ugurlar D, Rosati S, Heck AJ et al (2014) Complement is activated by IgG hexamers assembled at the cell surface. Science 343: 1260–1263 [DOI] [PMC free article] [PubMed] [Google Scholar]
- 4. Hajishengallis G, Reis ES, Mastellos DC, Ricklin D, Lambris JD (2017) Novel mechanisms and functions of complement. Nat Immunol 18: 1288–1298 [DOI] [PMC free article] [PubMed] [Google Scholar]
- 5. Lu LL, Suscovich TJ, Fortune SM, Alter G (2017) Beyond binding: antibody effector functions in infectious diseases. Nat Rev Immunol 18: 46 [DOI] [PMC free article] [PubMed] [Google Scholar]
- 6. Bohana‐Kashtan O, Ziporen L, Donin N, Kraus S, Fishelson Z (2004) Cell signals transduced by complement. Mol Immunol 41: 583–597 [DOI] [PubMed] [Google Scholar]
- 7. Triantafilou K, Hughes TR, Triantafilou M, Morgan PB (2013) The complement membrane attack complex triggers intracellular Ca2+ fluxes leading to NLRP3 inflammasome activation. J Cell Sci 126: 2903–2913 [DOI] [PubMed] [Google Scholar]
- 8. Cole DS, Morgan PB (2003) Beyond lysis: how complement influences cell fate. Clin Sci 104: 455–466 [DOI] [PubMed] [Google Scholar]
- 9. Schatz‐Jakobsen JA, Pedersen DV, Andersen GR (2016) Structural insight into proteolytic activation and regulation of the complement system. Immunol Rev 274: 59–73 [DOI] [PubMed] [Google Scholar]
- 10. Tam JC, Bidgood SR, McEwan WA, James LC (2014) Intracellular sensing of complement C3 activates cell autonomous immunity. Science 345: 1256070 [DOI] [PMC free article] [PubMed] [Google Scholar]
- 11. Chen B (2019) Molecular mechanism of HIV‐1 entry. Trends Microbiol 27: 878–891 [DOI] [PMC free article] [PubMed] [Google Scholar]
- 12. Mouquet H (2014) Antibody B cell responses in HIV‐1 infection. Trends Immunol 35: 549–561 [DOI] [PubMed] [Google Scholar]
- 13. Sok D, Burton DR (2018) Recent progress in broadly neutralizing antibodies to HIV. Nat Immunol 19: 1179–1188 [DOI] [PMC free article] [PubMed] [Google Scholar]
- 14. Cohen YZ, Caskey M (2018) Broadly neutralizing antibodies for treatment and prevention of HIV‐1 infection. Curr Opin HIV AIDS 13: 366 [DOI] [PubMed] [Google Scholar]
- 15. Gruell H, Klein F (2018) Antibody‐mediated prevention and treatment of HIV‐1 infection. Retrovirology 15: 73 [DOI] [PMC free article] [PubMed] [Google Scholar]
- 16. Lu C‐L, Murakowski DK, Bournazos S, Schoofs T, Sarkar D, Halper‐Stromberg A, Horwitz JA, Nogueira L, Golijanin J, Gazumyan A et al (2016) Enhanced clearance of HIV‐1–infected cells by broadly neutralizing antibodies against HIV‐1 in vivo . Science 352: 1001–1004 [DOI] [PMC free article] [PubMed] [Google Scholar]
- 17. Schoofs T, Klein F, Braunschweig M, Kreider EF, Feldmann A, Nogueira L, Oliveira T, Lorenzi JC, Parrish EH, Learn GH et al (2016) HIV‐1 therapy with monoclonal antibody 3BNC117 elicits host immune responses against HIV‐1. Science 352: 997–1001 [DOI] [PMC free article] [PubMed] [Google Scholar]
- 18. Borducchi EN, Liu J, Nkolola JP, Cadena AM, Yu W‐H, Fischinger S, Broge T, Abbink P, Mercado NB, Chandrashekar A et al (2018) Antibody and TLR7 agonist delay viral rebound in SHIV‐infected monkeys. Nature 563: 360–364 [DOI] [PMC free article] [PubMed] [Google Scholar]
- 19. Halper‐Stromberg A, Lu C‐L, Klein F, Horwitz JA, Bournazos S, Nogueira L, Eisenreich TR, Liu C, Gazumyan A, Schaefer U et al (2014) Broadly neutralizing antibodies and viral inducers decrease rebound from HIV‐1 latent reservoirs in humanized mice. Cell 158: 989–999 [DOI] [PMC free article] [PubMed] [Google Scholar]
- 20. Caskey M, Klein F, Nussenzweig MC (2019) Broadly neutralizing anti‐HIV‐1 monoclonal antibodies in the clinic. Nat Med 25: 547–553 [DOI] [PMC free article] [PubMed] [Google Scholar]
- 21. Horwitz JA, Bar‐On Y, Lu C‐L, Fera D, Lockhart AA, Lorenzi JC, Nogueira L, Golijanin J, Scheid JF, Seaman MS et al (2017) Non‐neutralizing antibodies alter the course of HIV‐1 infection in vivo . Cell 170: 637–648.e10 [DOI] [PMC free article] [PubMed] [Google Scholar]
- 22. Bournazos S, Klein F, Pietzsch J, Seaman MS, Nussenzweig MC, Ravetch JV (2014) Broadly neutralizing anti‐HIV‐1 antibodies require Fc effector functions for in vivo activity. Cell 158: 1243–1253 [DOI] [PMC free article] [PubMed] [Google Scholar]
- 23. Hessell AJ, Hangartner L, Hunter M, Havenith CE, Beurskens FJ, Bakker JM, Lanigan CM, Landucci G, Forthal DN, Parren PW et al (2007) Fc receptor but not complement binding is important in antibody protection against HIV. Nature 449: 101–104 [DOI] [PubMed] [Google Scholar]
- 24. Bruel T, Guivel‐Benhassine F, Amraoui S, Malbec M, Richard L, Bourdic K, Donahue D, Lorin V, Casartelli N, Noël N et al (2016) Elimination of HIV‐1‐infected cells by broadly neutralizing antibodies. Nat Commun 7: 10844 [DOI] [PMC free article] [PubMed] [Google Scholar]
- 25. von Bredow B, Arias JF, Heyer LN, Moldt B, Le K, Robinson JE, Zolla‐Pazner S, Burton DR, Evans DT (2016) Comparison of antibody‐dependent cell‐mediated cytotoxicity and virus neutralization by HIV‐1 Env‐specific monoclonal antibodies. J Virol 90: 6127–6139 [DOI] [PMC free article] [PubMed] [Google Scholar]
- 26. Musich T, Li L, Liu L, Zolla‐Pazner S, Robert‐Guroff M, Gorny MK (2017) Monoclonal antibodies specific for the V2, V3, CD4‐binding site, and gp41 of HIV‐1 mediate phagocytosis in a dose‐dependent manner. J Virol 91: e02325–16 [DOI] [PMC free article] [PubMed] [Google Scholar]
- 27. Reis ES, Mastellos DC, Ricklin D, Mantovani A, Lambris JD (2017) Complement in cancer: untangling an intricate relationship. Nat Rev Immunol 18: 5 [DOI] [PMC free article] [PubMed] [Google Scholar]
- 28. Blue CE, Spiller OB, Blackbourn DJ (2004) The relevance of complement to virus biology. Virology 319: 176–184 [DOI] [PMC free article] [PubMed] [Google Scholar]
- 29. Spear G, Sullivan B, Landay A, Lint T (1990) Neutralization of human immunodeficiency virus type 1 by complement occurs by viral lysis. J Virol 64: 5869–5873 [DOI] [PMC free article] [PubMed] [Google Scholar]
- 30. Huber M, Fischer M, Misselwitz B, Manrique A, Kuster H, Niederöst B, Weber R, von Wyl V, Günthard HF, Trkola A (2006) Complement lysis activity in autologous plasma is associated with lower viral loads during the acute phase of HIV‐1 infection. PLoS Med 3: e441 [DOI] [PMC free article] [PubMed] [Google Scholar]
- 31. Aasa‐Chapman MM, Holuigue S, Aubin K, Wong M, Jones NA, Cornforth D, Pellegrino P, Newton P, Williams I, Borrow P et al (2005) Detection of antibody‐dependent complement‐mediated inactivation of both autologous and heterologous virus in primary human immunodeficiency virus type 1 infection†. J Virol 79: 2823–2830 [DOI] [PMC free article] [PubMed] [Google Scholar]
- 32. Schmitz J, Zimmer J, Kluxen B, Aries S, Bögel M, Gigli I, Schmitz H (1995) Antibody‐dependent complement‐mediated cytotoxicity in sera from patients with HIV‐1 infection is controlled by CD55 and CD59. J Clin Invest 96: 1520–1526 [DOI] [PMC free article] [PubMed] [Google Scholar]
- 33. Saifuddin Parker C, Peeples M, Gorny M, Zolla‐Pazner S, Ghassemi M, Rooney I, Atkinson J, Spear G (1995) Role of virion‐associated glycosylphosphatidylinositol‐linked proteins CD55 and CD59 in complement resistance of cell line‐derived and primary isolates of HIV‐1. J Exp Medicine 182: 501–509 [DOI] [PMC free article] [PubMed] [Google Scholar]
- 34. Huber G, Bánki Z, Lengauer S, Stoiber H (2011) Emerging role for complement in HIV infection. Curr Opin HIV AIDS 6: 419 [DOI] [PubMed] [Google Scholar]
- 35. Mujib S, Liu J, Rahman N‐U, Schwartz JA, Bonner P, Yue F, Ostrowski MA (2017) Comprehensive cross‐clade characterization of antibody‐mediated recognition, complement‐mediated lysis and cell‐mediated cytotoxicity of HIV‐1 envelope specific antibodies towards the eradication of the HIV‐1 reservoir. J Virol 91: e00634–17 [DOI] [PMC free article] [PubMed] [Google Scholar]
- 36. Spear G, Takefman D, Sullivan B, Landay A, Zolla‐Pazner S (1993) Complement activation by human monoclonal antibodies to human immunodeficiency virus. J Virol 67: 53–59 [DOI] [PMC free article] [PubMed] [Google Scholar]
- 37. Marschang P, Gurtler L, Totsch M, Thielenst NM, Arlaudt GJ, Hittmair A, Katingers H, Dierich MP (1993) HIV‐I and HIV‐2 isolates differ in their ability to activate the complement system on the surface of infected cells. AIDS 7: 903 [DOI] [PubMed] [Google Scholar]
- 38. Spear G, Landay A, Sullivan B, Dittel B, Lint T (1990) Activation of complement on the surface of cells infected by human immunodeficiency virus. J Immunol Baltim Md 1950 144: 1490–1496 [PubMed] [Google Scholar]
- 39. Sölder BM, Schulz TF, Hengster P, Löwer J, Larcher C, Bitterlich G, Kurth R, Wachter H, Dierich MP (1989) HIV and HIV‐infected cells differentially activate the human complement system independent of antibody. Immunol Lett 22: 135–145 [DOI] [PubMed] [Google Scholar]
- 40. Yang K, Lan J, Shepherd N, Hu N, Xing Y, Byrd D, Amet T, Jewell C, Gupta S, Kounga C et al (2015) Blockage of CD59 function restores activities of neutralizing and nonneutralizing antibodies in triggering antibody‐dependent complement‐mediated lysis of HIV‐1 virions and provirus‐activated latently infected cells. J Virol 89: 9393–9406 [DOI] [PMC free article] [PubMed] [Google Scholar]
- 41. Lan J, Yang K, Byrd D, Hu N, Amet T, Shepherd N, Desai M, Gao J, Gupta S, Sun Y et al (2014) Provirus activation plus CD59 blockage triggers antibody‐dependent complement‐mediated lysis of latently HIV‐1–infected cells. J Immunol 193: 3577–3589 [DOI] [PMC free article] [PubMed] [Google Scholar]
- 42. Richard J, Prévost J, Baxter AE, von Bredow B, Ding S, Medjahed H, Delgado GG, Brassard N, Stürzel CM, Kirchhoff F et al (2018) Uninfected bystander cells impact the measurement of HIV‐specific antibody‐dependent cellular cytotoxicity responses. MBio 9: e00358–18 [DOI] [PMC free article] [PubMed] [Google Scholar]
- 43. Bruel T, Guivel‐Benhassine F, Lorin V, Lortat‐Jacob H, Baleux F, Bourdic K, Noël N, Lambotte O, Mouquet H, Schwartz O (2017) Lack of ADCC breadth of human non‐neutralizing anti‐HIV‐1 antibodies. J Virol 91: e02440–16 [DOI] [PMC free article] [PubMed] [Google Scholar]
- 44. Spear GT, Takefman DM, Sharpe S, Ghassemi M, Zolla‐Pazner S (1994) Antibodies to the HIV‐1 V3 loop in serum from infected persons contribute a major proportion of immune effector functions including complement activation, antibody binding, and neutralization. Virology 204: 609–615 [DOI] [PubMed] [Google Scholar]
- 45. Wang S‐Y, Racila E, Taylor RP, Weiner GJ (2008) NK‐cell activation and antibody‐dependent cellular cytotoxicity induced by rituximab‐coated target cells is inhibited by the C3b component of complement. Blood 111: 1456–1463 [DOI] [PMC free article] [PubMed] [Google Scholar]
- 46. Zhu Z, Qin H, Chen W, Zhao Q, Shen X, Schutte R, Wang Y, Ofek G, Streaker E, Prabakaran P et al (2011) Cross‐reactive HIV‐1‐neutralizing human monoclonal antibodies identified from a patient with 2F5‐like antibodies. J Virol 85: 11401–11408 [DOI] [PMC free article] [PubMed] [Google Scholar]
- 47. de Jong RN, Beurskens FJ, Verploegen S, Strumane K, van Kampen MD, Voorhorst M, Horstman W, Engelberts PJ, Oostindie SC, Wang G et al (2016) A novel platform for the potentiation of therapeutic antibodies based on antigen‐dependent formation of IgG hexamers at the cell surface. PLoS Biol 14: e1002344 [DOI] [PMC free article] [PubMed] [Google Scholar]
- 48. Richard J, Prévost J, Alsahafi N, Ding S, Finzi A (2018) Impact of HIV‐1 envelope conformation on ADCC responses. Trends Microbiol 26: 253–265 [DOI] [PubMed] [Google Scholar]
- 49. Pham TN, Lukhele S, Hajjar F, Routy J‐P, Cohen A (2014) HIV Nef and Vpu protect HIV‐infected CD4+ T cells from antibody‐mediated cell lysis through down‐modulation of CD4 and BST2. Retrovirology 11: 1–16 [DOI] [PMC free article] [PubMed] [Google Scholar]
- 50. Alvarez RA, Hamlin RE, Monroe A, Moldt B, Hotta MT, Caprio G, Fierer DS, Simon V, Chen BK (2014) HIV‐1 Vpu antagonism of tetherin inhibits antibody‐dependent cellular cytotoxic responses by natural killer cells. J Virol 88: 6031–6046 [DOI] [PMC free article] [PubMed] [Google Scholar]
- 51. Arias JF, Heyer LN, von Bredow B, Weisgrau KL, Moldt B, Burton DR, Rakasz EG, Evans DT (2014) Tetherin antagonism by Vpu protects HIV‐infected cells from antibody‐dependent cell‐mediated cytotoxicity. Proc Natl Acad Sci USA 111: 6425–6430 [DOI] [PMC free article] [PubMed] [Google Scholar]
- 52. Meri S, Morgan B, Davies A, Daniels R, Olavesen M, Waldmann H, Lachmann P (1990) Human protectin (CD59), an 18000–20000 MW complement lysis restricting factor, inhibits C5b–8 catalysed insertion of C9 into lipid bilayers. Immunology 71: 1–9 [PMC free article] [PubMed] [Google Scholar]
- 53. Alsahafi N, Bakouche N, Kazemi M, Richard J, Ding S, Bhattacharyya S, Das D, Anand S, Prévost J, Tolbert WD et al (2019) An asymmetric opening of HIV‐1 envelope mediates antibody‐dependent cellular cytotoxicity. Cell Host Microbe 25: 578–587.e5 [DOI] [PMC free article] [PubMed] [Google Scholar]
- 54. Veillette M, Coutu M, Richard J, Batraville L‐A, Dagher O, Bernard N, Tremblay C, Kaufmann DE, Roger M, Finzi A (2015) The HIV‐1 gp120 CD4‐bound conformation is preferentially targeted by antibody‐dependent cellular cytotoxicity‐mediating antibodies in sera from HIV‐1‐infected individuals. J Virol 89: 545–551 [DOI] [PMC free article] [PubMed] [Google Scholar]
- 55. Prévost J, Richard J, Ding S, Pacheco B, Charlebois R, Hahn BH, Kaufmann DE, Finzi A (2018) Envelope glycoproteins sampling states 2/3 are susceptible to ADCC by sera from HIV‐1‐infected individuals. Virology 515: 38–45 [DOI] [PMC free article] [PubMed] [Google Scholar]
- 56. Pereira EA, daSilva LL (2016) HIV‐1 Nef: taking control of protein trafficking. Traffic 17: 976–996 [DOI] [PubMed] [Google Scholar]
- 57. Schwartz O, Rivière Y, Heard J, Danos O (1993) Reduced cell surface expression of processed human immunodeficiency virus type 1 envelope glycoprotein in the presence of Nef. J Virol 67: 3274–3280 [DOI] [PMC free article] [PubMed] [Google Scholar]
- 58. Veillette M, Desormeaux A, Medjahed H, Gharsallah ‐EN, Coutu M, Baalwa J, Guan Y, Lewis G, Ferrari G, Hahn B et al (2014) Interaction with cellular CD4 exposes HIV‐1 envelope epitopes targeted by antibody‐dependent cell‐mediated cytotoxicity. J Virol 88: 2633–2644 [DOI] [PMC free article] [PubMed] [Google Scholar]
- 59. Julien J‐P, Lee J, Cupo A, Murin CD, Derking R, Hoffenberg S, Caulfield MJ, King RC, Marozsan AJ, Klasse P et al (2013) Asymmetric recognition of the HIV‐1 trimer by broadly neutralizing antibody PG9. Proc Natl Acad Sci USA 110: 4351–4356 [DOI] [PMC free article] [PubMed] [Google Scholar]
- 60. Zhou T, Georgiev I, Wu X, Yang Z‐Y, Dai K, Finzi A, Kwon Y, Scheid JF, Shi W, Xu L et al (2010) Structural basis for broad and potent neutralization of HIV‐1 by antibody VRC01. Science 329: 811–817 [DOI] [PMC free article] [PubMed] [Google Scholar]
- 61. Mouquet H, Scharf L, Euler Z, Liu Y, Eden C, Scheid JF, Halper‐Stromberg A, Gnanapragasam PN, Spencer DI, Seaman MS et al (2012) Complex‐type N‐glycan recognition by potent broadly neutralizing HIV antibodies. Proc Natl Acad Sci USA 109: E3268–E3277 [DOI] [PMC free article] [PubMed] [Google Scholar]
- 62. Dechant M, Weisner W, Berger S, Peipp M, Beyer T, Schneider‐Merck T, van Bueren JJ, Bleeker WK, Parren P, van de Winkel J et al (2008) Complement‐dependent tumor cell lysis triggered by combinations of epidermal growth factor receptor antibodies. Cancer Res 68: 4998–5003 [DOI] [PubMed] [Google Scholar]
- 63. Dufloo J, Bruel T, Schwartz O (2018) HIV‐1 cell‐to‐cell transmission and broadly neutralizing antibodies. Retrovirology 15: 51 [DOI] [PMC free article] [PubMed] [Google Scholar]
- 64. Sullivan BL, Takefman DM, Spear GT (1998) Complement can neutralize HIV‐1 plasma virus by a C5‐independent mechanism. Virology 248: 173–181 [DOI] [PubMed] [Google Scholar]
- 65. Zhou Z, Wild T, Xiong Y, Sylvers P, Zhang Y, Zhang L, Wahl L, Wahl SM, Kozlowski S, Notkins AL (2013) Polyreactive antibodies plus complement enhance the phagocytosis of cells made apoptotic by UV‐light or HIV. Sci Rep 3: 2271 [DOI] [PMC free article] [PubMed] [Google Scholar]
- 66. West EE, Kolev M, Kemper C (2018) Complement and the regulation of T cell responses. Annu Rev Immunol 36: 309–338 [DOI] [PMC free article] [PubMed] [Google Scholar]
- 67. Kolev M, Dimeloe S, Le Friec G, Navarini A, Arbore G, Povoleri GA, Fischer M, Belle R, Loeliger J, Develioglu L et al (2015) Complement regulates nutrient influx and metabolic reprogramming during Th1 cell responses. Immunity 42: 1033–1047 [DOI] [PMC free article] [PubMed] [Google Scholar]
- 68. Dempsey PW, Allison ME, Akkaraju S, Goodnow CC, Fearon DT (1996) C3d of complement as a molecular adjuvant: bridging innate and acquired immunity. Science 271: 348–350 [DOI] [PubMed] [Google Scholar]
- 69. Carroll MC, Isenman DE (2012) Regulation of humoral immunity by complement. Immunity 37: 199–207 [DOI] [PMC free article] [PubMed] [Google Scholar]
- 70. Lofano G, Gorman MJ, Yousif AS, Yu W‐H, Fox JM, Dugast A‐S, Ackerman ME, Suscovich TJ, Weiner J, Barouch D et al (2018) Antigen‐specific antibody Fc glycosylation enhances humoral immunity via the recruitment of complement. Sci Immunol 3: eaat7796 [DOI] [PMC free article] [PubMed] [Google Scholar]
- 71. Richardson SI, Chung AW, Natarajan H, Mabvakure B, Mkhize NN, Garrett N, Karim S, Moore PL, Ackerman ME, Alter G et al (2018) HIV‐specific Fc effector function early in infection predicts the development of broadly neutralizing antibodies. PLoS Pathog 14: e1006987 [DOI] [PMC free article] [PubMed] [Google Scholar]
- 72. Fang Y, Xu C, Fu Y, Holers V, Molina H (1998) Expression of complement receptors 1 and 2 on follicular dendritic cells is necessary for the generation of a strong antigen‐specific IgG response. J Immunol Baltim Md 1950 160: 5273–5279. [PubMed] [Google Scholar]
- 73. Mongini P, Vilensky M, Highet P, Inman J (1997) The affinity threshold for human B cell activation via the antigen receptor complex is reduced upon co‐ligation of the antigen receptor with CD21 (CR2). J Immunol Baltim Md 159: 3782–3791 [PubMed] [Google Scholar]
- 74. Pietzsch J, Scheid JF, Mouquet H, Klein F, Seaman MS, Jankovic M, Corti D, Lanzavecchia A, Nussenzweig MC (2010) Human anti–HIV‐neutralizing antibodies frequently target a conserved epitope essential for viral fitness. J Exp Medicine 207: 1995–2002 [DOI] [PMC free article] [PubMed] [Google Scholar]
- 75. Seki A, Rutz S (2018) Optimized RNP transfection for highly efficient CRISPR/Cas9‐mediated gene knockout in primary T cells. J Exp Med 215: 958–997 [DOI] [PMC free article] [PubMed] [Google Scholar]
- 76. Hultquist JF, Hiatt J, Schumann K, McGregor MJ, Roth TL, Haas P, Doudna JA, Marson A, Krogan NJ (2019) CRISPR–Cas9 genome engineering of primary CD4+ T cells for the interrogation of HIV–host factor interactions. Nat Protoc 14: 1–27 [DOI] [PMC free article] [PubMed] [Google Scholar]