

Abstract
Objectives:
This study examined the associations of discrepancies between perceived and physiological fall risks with repeated falls.
Methods:
We analyzed the 2016 Medicare Current Beneficiary Survey of 2,487 Medicare beneficiaries aged ≥ 65 years with ≥ 1 fall. The outcome variable was repeated falls (≥ 2 falls), the key independent variable was a categorical variable of discrepancies between perceived (fear of falling) and physiological fall risks (physiological limitations), assessed using multivariate logistic regression.
Results:
Among Medicare beneficiaries with ≥ 1 fall, 25.1% had low fear of falling but high physiological fall risk (Low Fear-High Physiological), 9.4% had high fear of falling but low physiological fall risk (High Fear-Low Physiological), 23.5% had low fear of falling and low physiological fall risks (Low Fear-Low Physiological), and 42.0% had high fear of falling and high physiological fall risks (High Fear-High Physiological). Having High Fear-High Physiological was associated with repeated falls (OR = 2.14; p < .001) compared to Low Fear-Low Physiological. Having Low Fear-High Physiological and High Fear-LowPhysiological were not associated with repeated falls.
Conclusions:
Given that High Fear-High Physiological was associated with repeated falls and that many at-risk Medicare beneficiaries had High Fear-High Physiological, prevention efforts may consider targeting those most at-risk including Medicare beneficiaries with High Fear-High Physiological.
Clinical Implications:
Assessing both perceived and physiological fall risks is clinically relevant, given it may inform targeted interventions for different at-risk Medicare beneficiaries among clinicians and other stakeholders.
Keywords: Fall risk assessment, physiological fall risk, fear of falling, perceived fall risk, repeated falls, Medicare beneficiaries
Introduction
Approximately 30% of U.S. adults aged ≥ 65 years reported falling each year (Bergen, Stevens, & Burns, 2016), with an estimated 3 million older adults with fall-related emergency room visits (Burns & Kakara, 2018). In 2016, an estimated 30,000 deaths of adults aged ≥ 65 years were related to falls (Burns & Kakara, 2018). The healthcare expenditure associated with falls among older adults is substantial in the U.S., with an estimated 50 billion USD attributed to fatal and nonfatal-related falls in 2015 (Florence et al., 2018). For nonfatal-related falls, Medicare alone spent 28.9 billion USD in 2015 (Florence et al., 2018). Thus, falls are a serious public health issue concerning many in the U.S.
Many studies have examined various risk factors associated with falls (e.g., sensory impairments, environmental design, and behavioral related factors). More specifically, factors such as functional or physical limitations and psychological or cognitive related factors, are particularly relevant to the current study. Some common functional or physical limitations (also known as physiological limitations) include balance- and-gait issues (Nevitt, Cummings, Kidd, & Black, 1989; Tinetti, Speechley, & Ginter, 1988), and instrumental and/or activities of daily living (ADL/IADL) limitations (Nourhashemi et al., 2001; Yamazaki, Hayashida, & Yontz, 2017). Not surprisingly, physiological limitations like balance-and-gait issues and ADL/IADL limitations are not only associated with falls but also may reduce older adults’ quality of life and ability to live independently, which may further increase medical expenditures and risk of mortality (Freedman, Martin, & Schoeni, 2002; Mlinac & Feng, 2016; Shumway-Cook et al., 2009; Thompson, Zack, Krahn, Andresen, & Barile, 2012). In terms of psychological or cognitive related risk factors, fear of falling (Delbaere, Crombez, Van den Noortgate, Willems, & Cambier, 2006; Murphy, Dubin, & Gill, 2003; Thiamwong & Suwanno, 2017), potentially characterized, in part, as a perceived fall risk (Delbaere et al., 2006; Legters, 2002; Murphy et al., 2003; Thiamwong & Suwanno, 2017; Tinetti et al., 1988), is a common issue for older adults (Legters, 2002), which may also be accompanied by other negative outcomes. Excessive fear of falling can result in an inactive lifestyle and affect the quality of daily living regardless of one’s physiological abilities (Delbaere et al., 2006; Hadjistavropoulos, Delbaere, & Fitzgerald, 2011; Legters, 2002). Studies have shown that appropriate rehabilitation can improve physiological abilities (Hadjistavropoulos et al., 2011), and fear of falling can be lowered through exercise and cognitive interventions (Jung, Lee, & Lee, 2009). It is also important to note that being aware of the potential risk of falling can be protective, as older adults strive to protect themselves from activities they perceive as high risks for falls. Therefore, there exists a delicate balance in terms of fear of falling, in that an appropriate awareness of the potential risk of falling may be helpful for older adults.
While many studies have examined fall risks and their intra/inter relationships, few studies analyzed fall risks by examining discrepancies between perceived and physiological fall risks. A study conducted in Australia using a community-based prospective study design, examined the role of discrepancies in perceived and physiological fall risks among older adults, aged 70–90 years, finding that around one-third of them underestimated/overestimated their risk of falling (Delbaere, Close, Brodaty, Sachdev, & Lord, 2010). The perceived and physiological fall risks were associated with higher risk of falling (Delbaere et al., 2010). Additionally, according to the authors, discrepancies between perceived and physiological fall risks can be categorized into four groups labeled as anxious, stoic, vigorous, and aware (Figure 1) (Delbaere et al., 2010).
Figure 1.
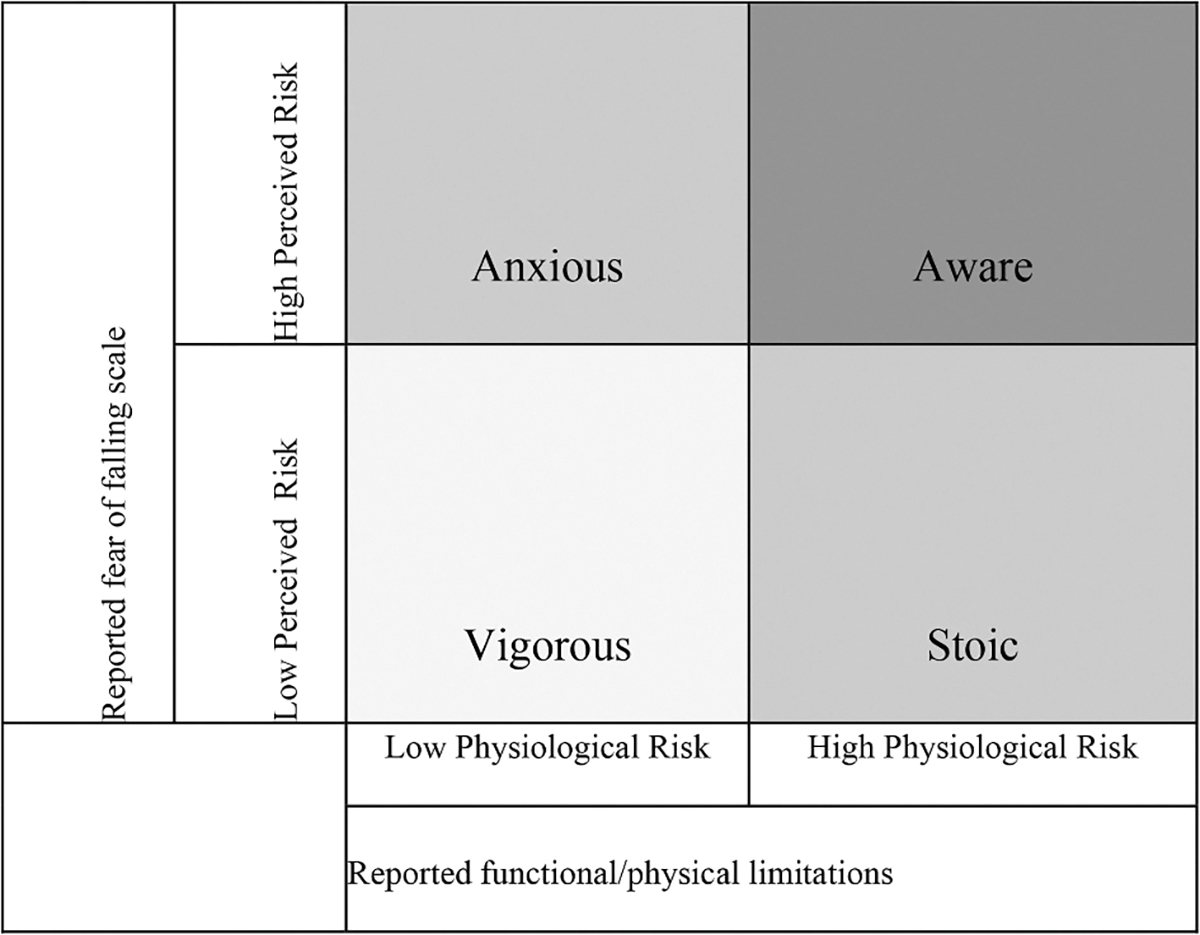
Discrepancies between physiological and perceived fall risk measures. Note: The classification and names of the four groups were referenced from (Delbaere et al., 2010).
The term anxious was used to characterize individuals having high perceived fall risk (or high fear of falling) but low physiological fall risk (or high physiological ability), who might overestimate their fall risks (Delbaere et al., 2010). The term stoic was used to characterize individuals having low perceived fall risk but high physiological fall risk, who might underestimated their fall risks (Delbaere et al., 2010). The term vigorous was used to characterize individuals having low perceived and low physiological fall risks, while the term aware was used to characterize individuals having high perceived and high physiological fall risks (Delbaere et al., 2010). By assessing older adults based on discrepancies between perceived and physiological fall risks, a clearer picture of potential fall risk can be identified such that people might have underestimated/overestimated their fall risks and their subsequent effects on falls may be better understood.
According to CDC’s STEADI initiative and American/British Geriatrics Society clinical practice guidelines for fall prevention among older adults, if healthcare providers assessing older adults’ fall risk identify older adults have fallen in the past year (which doubles the risk of having another fall (Vieira, Palmer, & Chaves, 2016)), they are recommended to be evaluated with the gait, strength, and balance tests among other recommended risk assessments (CDC, 2019; Moncada & Mire, 2017). Therefore, an opportunity to assess discrepancies between perceived and physiological fall risks that can be used to inform more targeted interventions based on the specific needs of certain populations. Given limited information on discrepancies between perceived and physiological fall risks among this at-risk population, we aimed to examine the associations of discrepancies between perceived and physiological fall risks with repeated falls (≥ 2 falls) among Medicare beneficiaries with ≥ 1 fall.
The findings can inform decision makers and at-risk older adults about the prevalence of discrepancies between perceived and physiological fall risks. This can add insight into whether at-risk populations with discrepancies between perceived and physiological fall risks are at higher risk of having repeated falls.
Methods
Participants
We used the 2016 Medicare Current Beneficiary Survey Public Use File (MCBS PUF) for the current study. The survey data includes a nationally representative sample of Medicare beneficiaries, commissioned by the CMS (MCBS, 2019). MCBS PUF contains beneficiaries’ enrollment, socio-demographic information, health conditions, and healthcare access related data at the individual level (MCBS, 2019). Our study sample included 2,487 community-dwelling Medicare beneficiaries who were aged ≥ 65 years reporting ≥ 1 fall. The reason we restricted analyses to those with ≥ 1 fall was because, based on clinical guidance, this at-risk population is recommended to have their fall risks evaluated (e.g., gait, strength, and balance), therefore, providing an opportunity to assess their perceived and physiological fall risk discrepancies, which can potentially be part of the recommended multifactorial risk assessment (Moncada & Mire, 2017).
Measures
Physiological fall risk measure
For physiological fall risk, we evaluated beneficiaries’ risk using their responses to three questions (Supplemental Table S1) (MCBS, 2019) :1) the number of functional limitations (instrumental activities of daily living (IADL)/activities of daily living (ADL)) (with a five-point Likert scale: 0 = no functional limitations, 1 = only IADL limitations, 2 = 1 to 2 ADL limitations, 3 = 3 to 4 ADL limitations, 4 = 5 to 6 ADL limitations); 2) difficulty walking/climbing stairs (with “yes” or “no” answer); 3) level of difficulty stooping/crouching/kneeling (with a five-point Likert scale: 1 = no difficulty, 2 = little difficulty, 3 = some difficulty, 4 = a lot of difficulty, 5 = unable to do it).
Of note, for ADL/IADL limitations, the MCBS PUF categorized the IADL and ADL limitations together (MCBS, 2019). However, the Likert scale = 1 is for those only having IADL limitations, therefore, those with only IADL limitations can be excluded.
Given use of secondary existing data, the selection of variables such as difficulty walking/climbing stairs, difficulty stooping/crouching/kneeling, and ADL limitations were based on their close approximate to other known assessment tools (e.g., CDC’s functional assessment tests (CDC, 2019)) for assessing physiological fall risk. Given the assessment tools mainly focus on older adults’ gait, strength, and balance, variables used in our study also reflected that, and their associations with falls (Landers, Oscar, Sasaoka, & Vaughn, 2016; Steinman, Allen, Chen, & Pynoos, 2015; Steinman, Pynoos, & Nguyen, 2009; Yamazaki et al., 2017). For example, previous studies have found that ADL limitations and its severity are associated with falls and fall-related fractures (Dunn, Rudberg, Furner, & Cassel, 1992; Henry-Sánchez, Kurichi, Xie, Pan, & Stineman, 2012; Shumway-Cook et al., 2009; Yamazaki et al., 2017). Conceptually, many other risk factors could be included as part of (or could affect) the physiological fall risk measure as well (e.g., sensory impairments as a direct measure and/or as mediation/moderation variables (Steinman et al., 2015, 2009)), however, to establish a baseline for understanding discrepancies between perceived and physiological fall risks among this at-risk population, they were included as covariates/cofounders in the model. Additionally, in practice risk factor assessments include various tests/examinations, there is not a single integrated specific test that measures all potential risk factors at once. Thus, to operationalize physiological fall risk, the variables used were those most closely related to assessment tools, for example, IADL/ADL assessment which has been widely used by many to gauge functional activities for older adults (ACA, 2020; Nourhashemi et al., 2001), can be adopted/included to be part of the fall risk assessment.
There are many assessment tools (e.g., Tinetti Balance & Gait assessment, Physiological Profile Approach, CDC’s functional assessment tests) that have been used widely to measure physiological fall risk (CDC, 2019; Lord, Menz, & Tiedemann, 2003; Tinetti, 1986). In general, these tools are used to assess individuals’ strength, endurance, and balance. For example, CDC’s functional assessment tests of 30-Second Chair Stand (which is used to test leg strength and endurance, identify individuals at risk for falling if individuals must use their arms to stand from the sitting position); Timed Up & Go (which is used to assess mobility, patients walk a line 3 meters, or 10 feet away, on the floor and back, with ≥ 12 seconds to complete the task considered at risk for falling); and 4-Stage Balance Test (which is used to assess static balance, individuals must be able to do Tandem stand for ≥ 10 seconds, otherwise they are considered at risk for falling) (CDC, 2019). In this study, variables such as ADL limitations (e.g., indicated that individuals needing assistance with bathing, dressing, using the toilet, getting in/out chairs, and walking) and difficulty walking/climbing stairs likely reflect individuals that are not able to engage in Timed Up & Go and 30-Second Chair Stand; and the variable of difficulty stooping/crouching/kneeling likely reflect individuals not able to engage in 4-Stage Balance Test.
Similar to an algorithm published by CMS about physiological limitations (Ward, Koenig, Hasche, Loganathan, & Guerino, 2017), we created a dichotomous variable for physiological fall risk (1 = high physiological fall risk; 0 = low physiological fall risk). We defined the physiological fall risk variable = 1, when beneficiaries responded as having one or more functional limitations of ADL (answered 2–4 from the Likert scale), OR answering “yes” to difficulty walking/climbing stairs, OR answering some difficulty to unable to stooping/crouching/kneeling (answered 3–5 from the Likert scale). Otherwise, the physiological fall risk variable was coded =0, which means low physiological fall risk. Given these variables are limited (i.e., close approximate to the fall risk assessment tools to assess physiological fall risk and as fall risk factors), we performed sensitivity analysis using the algorithm as described above except by combining these three variables differently to ensure the robustness of our findings (see Statistical Analysis and Discussion for additional detail).
Perceived fall risk measure
For perceived fall risk, guided by past research using a similar measure (Delbaere et al., 2006; Thiamwong & Suwanno, 2017), beneficiaries were evaluated based on a reported fear of falling with a six-point Likert scale (1 = not at all afraid of falling, 2 = a little afraid of falling, 3 = moderately afraid of falling, 4 = afraid of falling, 5 = very afraid of falling, 6 = extremely afraid of falling) (Supplemental Table S1). This variable was recoded as a dichotomous variable for perceived fall risk (1 = high perceived fall risk, if beneficiaries answered 3–6 from the Likert scale (from moderate to extremely fear of falling); 0 = low perceived fall risk, if beneficiaries answered 1–2 from the Likert scale (from no to a little fear of falling)). We also conducted a sensitivity analysis using different combinations of the Likert scale to define perceived fall risk (see Statistical Analysis and Discussion for additional detail).
Fall risk groups
The dichotomous perceived and physiological fall risk variables described above were used to stratify the beneficiaries into four subgroups based on the classification defined by Delbaere et al. (Delbaere et al., 2010) and created a 4-level categorical variable for fall risk: 1 = low perceived (or low fear of falling) and low physiological fall risk (or high physiological ability); 2 = low perceived and high physiological fall risk; 3 = high perceived and low physiological fall risk, and 4 = high perceived and high physiological fall risk (Figure 1).
Outcome variable
The outcome variable was repeated falls (Lamb, Jørstad-Stein, Hauer, & Becker, 2005). We identified beneficiaries with repeated falls by the question from MCBS PUF: “Since last year, how many times [have you/has (sample person)] fallen down?” (MCBS, 2019). The answers to this question were classified into a categorical variable by MCBS PUF, additionally to ensure a reasonable sample size for reliable estimates, we recoded this categorical variable into a binary outcome variable (1 = reported having ≥ 2 falls; 0 = 1 fall).
Covariates
Other covariates include sociodemographic factors such as sex, age group, race/ethnicity, education level, income level, marital status, residing area (metro, non-metro), and living status (alone, not alone), as well as health indicators such as, general health status, and chronic conditions (high blood pressure, diabetes, myocardial infarction/heart attack, stroke/brain hemorrhage, emphysema/asthma/COPD, rheumatoid arthritis, osteoporosis/soft bones, depression, urinary incontinence), and sensory impairments (hearing issues, vision issues). The selection of these covariates for the analysis was guided by past research (Florence et al., 2018; Landers et al., 2016; Nevitt et al., 1989; Shumway-Cook et al., 2009; Tinetti et al., 1988) many of which have been shown to be associated with falls.
Statistical analysis
This is a retrospective observational study, using existing secondary data. For descriptive analyses, we calculated proportions for categorical variables, stratified by fall risk group. We tested the differences in proportions of the socio-demographics, health conditions and sensory impairments by using Wald x2 tests for the four groups. A multivariate logistic model adjusting for covariates was performed to examine the associations between discrepancies between perceived and physiological fall risks (defined as a categorical variable) and repeated falls. All the analyses applied the survey weights to control for the complex survey design. MCBS used a multi-stage cluster sample design, the weight variables and statistical approach were used to account for the survey design as recommended by MCBS (MCBS, 2019).
For the sensitivity analysis, for physiological fall risk, a total of five different configurations were used: Case 1, replacing use of or substituting Likert scale of 2–4 (1 or more ADL limitations) with Likert scale of 3–4 (3 or more ADL limitations) to define high physiological fall risk, with all else remaining the same as the initial analyses; Case 2, substituting Likert scale of 2–4 (1 or more ADL limitations) with Likert scale of 4 (5 or more ADL limitations) to define higher physiological fall risk, with all else remaining the same; Case 3, excluding ADL limitations from the physiological fall risk measure, all else remaining the same; Case 4, including IADL limitations in additional to ADL limitations for the physiological fall risk measure, all else remaining the same; Case 5, substituting Likert scale of 3–5 (some difficulty to unable to stooping/crouching/kneeling) with Likert scale of 2–5 (little difficulty to unable to stooping/crouching/kneeling) to define as high physiological fall risk, all else remaining the same. For perceived fall risk, a total of two different configurations were used: Case 6, substituting Likert scale of 3–6 (moderately to extremely afraid of falling) with 4–6 (afraid to extremely afraid of falling) to define high perceived fall risk, all else remaining the same; Case 7, substituting Likert scale of 3–6 (moderately to extremely afraid of falling) with 2–6 (a little to extremely afraid of falling) to define high perceived fall risk, all else remaining the same (Supplemental Table S2). All analyses were performed using SAS 9.4 software in 2019–20.
Results
Table 1 shows the characteristics of community-dwelling Medicare beneficiaries aged ≥ 65 years with ≥ 1 fall by perceived (or fear of falling) and physiological fall risk (or physiological ability). Among those reporting ≥ 1 fall, 25.1% had low fear of falling but high physiological fall risk (Low Fear-High Physiological), 9.4% had high fear of falling but low physiological fall risk (High Fear-Low Physiological), 23.5% had low fear of falling and low physiological fall risks (Low Fear-Low Physiological), and 42.0% had high fear of falling and high physiological fall risks (High Fear-High Physiological). About 62.1%, 49.3%, 37.5%, and 34.6% of those with High Fear-High Physiological, Low Fear-High Physiological, High Fear-Low Physiological, and Low Fear-Low Physiological reported having repeated falls, respectively.
Table 1.
Characteristics of medicare beneficiaries aged ≥ 65 years with ≥ 1 fall, by perceived and physiological fall risk.
| Variable, weighted % | Total | Fall Risk Groups | p-value | |||
|---|---|---|---|---|---|---|
|
| ||||||
| LPLP | HPHP | LPHP | HPLP | |||
| N, sample size | 2,487 | 510 | 1,128 | 623 | 226 | |
| Weighted number of Medicare beneficiaries | 9.8 million | 2.3 million 23.5 | 4.1 million 42.0 | 2.4 million 25.1 | 0.9 million 9.4 | |
| Number of Falls | ||||||
| One fall | 49.9 | 65.4 | 37.9 | 50.7 | 62.5 | <0.001 |
| Fall ≥2 | 50.1 | 34.6 | 62.1 | 49.3 | 37.5 | |
| Sex | ||||||
| Female | 60.4 | 50.3 | 68.3 | 52.5 | 71.5 | <0.001 |
| Male | 39.6 | 49.7 | 31.7 | 47.5 | 28.5 | |
| Race/Ethnicity | ||||||
| Non-Flispanic White | 79.8 | 86.2 | 74.3 | 82.3 | 82.0 | <0.001 |
| Non-Flispanic Black | 6.4 | 2.9 | 8.1 | 8.1 | 2.6 | |
| Hispanic | 7.5 | 4.5 | 10.3 | 4.3 | 11.0 | |
| Other | 6.3 | 6.3 | 7.3 | 5.3 | 4.4 | |
| Age Group | ||||||
| 65–74 | 55.1 | 64.7 | 49.8 | 53.7 | 58.3 | <0.001 |
| ≥75 | 44.9 | 35.3 | 50.2 | 46.3 | 41.7 | |
| Marital Status | ||||||
| Married | 52.6 | 58.3 | 46.5 | 55.6 | 57.6 | <0.001 |
| Widowed | 26.1 | 17.9 | 32.2 | 23.9 | 24.7 | |
| Separated/Divorced | 16.3 | 18.0 | 16.6 | 15.5 | 12.7 | |
| Never Married | 5.0 | 5.8 | 4.7 | 5.0 | 4.9 | |
| Education Level | ||||||
| Less than High school | 15.7 | 8.3 | 21.5 | 16.3 | 6.3 | <0.001 |
| High school | 33.2 | 24.5 | 37.0 | 33.2 | 37.7 | |
| More than High school | 51.1 | 67.2 | 41.4 | 50.5 | 56.0 | |
| Living Status | ||||||
| Alone | 31.7 | 28.6 | 35.4 | 29.0 | 30.5 | 0.089 |
| Not Alone | 68.3 | 71.4 | 64.6 | 71.0 | 69.5 | |
| Income | ||||||
| <$25,000 | 36.4 | 24.2 | 43.8 | 37.3 | 30.9 | <0.001 |
| ≥ $25,000 | 63.6 | 75.8 | 56.2 | 62.7 | 69.1 | |
| Residing Area | ||||||
| Non-metro Area | 22.9 | 21.1 | 21.8 | 25.3 | 26.0 | 0.216 |
| Metro Area | 77.1 | 78.9 | 78.2 | 74.7 | 74.0 | |
| Diabetes | ||||||
| No | 61.0 | 69.3 | 54.1 | 60.2 | 72.8 | <0.001 |
| Yes | 39.0 | 30.7 | 45.9 | 39.8 | 27.2 | |
| High Blood Pressure | ||||||
| No | 29.2 | 42.0 | 22.4 | 26.8 | 34.0 | <0.001 |
| Yes | 70.8 | 58.0 | 77.6 | 73.2 | 66.0 | |
| Myocardial Infarction/Heart Attack | ||||||
| No | 86.2 | 90.6 | 85.4 | 82.4 | 89.4 | 0.006 |
| Yes | 13.8 | 9.4 | 14.6 | 17.6 | 10.6 | |
| Stroke/Brain Hemorrhage | ||||||
| No | 86.9 | 95.0 | 81.4 | 87.1 | 90.7 | <0.001 |
| Yes | 13.1 | 5.0 | 18.6 | 12.9 | 9.3 | |
| Emphysema/Asthma/COPD | ||||||
| No | 77.2 | 84.5 | 74.1 | 73.6 | 82.3 | <0.001 |
| Yes | 22.8 | 15.5 | 25.9 | 26.4 | 17.7 | |
| Rheumatoid Arthritis | ||||||
| No | 81.1 | 92.6 | 70.7 | 83.8 | 91.9 | <0.001 |
| Yes | 18.9 | 7.4 | 29.3 | 16.2 | 8.1 | |
| Osteoporosis | ||||||
| No | 78.3 | 86.6 | 71.3 | 83.3 | 75.0 | <0.001 |
| Yes | 21.7 | 13.4 | 28.7 | 16.7 | 25.0 | |
| Depression | ||||||
| No | 67.1 | 83.8 | 55.1 | 68.5 | 74.5 | <0.001 |
| Yes | 32.9 | 16.2 | 44.9 | 31.5 | 25.5 | |
| Urinary Incontinence | ||||||
| No | 49.3 | 69.4 | 37.1 | 49.5 | 53.2 | <0.001 |
| Yes | 50.7 | 30.6 | 62.9 | 50.5 | 46.8 | |
| Hearing Issues | ||||||
| No | 91.3 | 97.0 | 87.6 | 90.0 | 96.4 | <0.001 |
| Yes | 8.7 | 3.0 | 12.4 | 10.0 | 3.6 | |
| Vision Issues | ||||||
| No | 94.9 | 98.8 | 91.2 | 96.4 | 97.6 | <0.001 |
| Yes | 5.1 | 1.2 | 8.8 | 3.6 | 2.4 | |
| General Health | ||||||
| Very Good/Excellent | 40.3 | 69.3 | 24.0 | 32.0 | 62.1 | <0.001 |
| Good | 31.9 | 25.4 | 32.4 | 37.7 | 30.9 | |
| Fair/Poor | 27.8 | 5.3 | 43.6 | 30.3 | 7.0 | |
Note: The p-values were calculated based on Wald X2 tests. Boldface indicates statistical significance (p < 0.05). LPLP = low perceived and low physiological fall risks; HPHP = high perceived and high physiological fall risks; LPHP = low perceived fall risk but high physiological fall risk; HPLP = high perceived fall risk but low physiological fall risk.
Overall, those with High Fear-High Physiological tended to be older, nonwhite, not married, less educated, and with lower incomes. Those with Low Fear-Low Physiological tended to be younger, white, married, and with higher income status. Those with High Fear-Low Physiological tended to be female, and/or with a high school education.
In terms of health conditions and sensory impairments, those with High Fear-High Physiological reported having the highest proportions of diabetes (45.9%), high blood pressure (77.6%), stroke/brain hemorrhage (18.6%), rheumatoid arthritis (29.3%), osteoporosis (28.7%), depression (44.9%), urinary incontinence (62.9%), hearing issues (12.4%), and vision issues (8.8%) (Table 1). In general, those with Low Fear-High Physiological reported having the second-highest proportions of health conditions (except that those with Low Fear-High Physiological had highest proportions of myocardial infarction/heart attack and emphysema/asthma/COPD). For example, 39.8%, 73.2%, 16.2%, 31.5%, and 50.5% of those with Low Fear-High Physiological reported having diabetes, high blood pressure, rheumatoid arthritis, depression, and urinary incontinence, respectively. Among beneficiaries with Low Fear-Low Physiological, the lowest proportions of health conditions (except for diabetes) were reported among the groups.
Associations between perceived and physiological fall risks and covariates (control variables) with repeated falls based on the multivariate logit model are reported in Table 2. Compared to Low Fear-Low Physiological, beneficiaries with High Fear-High Physiological were more likely to experience repeated falls (Odds ratio (OR) = 2.14, 95% CI = 1.60, 2.87) after adjusting for covariates. However, having Low Fear-High Physiological and High Fear-Low Physiological were not significantly associated with repeated falls (Table 2).
Table 2.
Associations between perceived and physiological fall risks with repeated falls adjusted for the socio-demographics and co-morbidities among medicare beneficiaries aged ≥ 65 years with ≥ 1 fall.
| Characteristics | OR (95% CI) | p-value |
|---|---|---|
|
| ||
| Fall risk group | ||
| LPLP | Ref | |
| LPHP | 1.44 (0.99–2.08) | 0.054 |
| HPLP | 1.14 (0.79–1.64) | 0.492 |
| HPHP | 2.14 (1.60–2.87) | <0.001 |
| Sex | ||
| Female | Ref | |
| Male | 1.66 (1.29–2.14) | <0.001 |
| Race/Ethnicity | ||
| Non-Hispanic White | Ref | |
| Non-Hispanic Black | 0.95 (0.58–1.53) | 0.823 |
| Hispanic | 0.63 (0.40–0.98) | 0.039 |
| Other | 1.08 (0.72–1.64) | 0.699 |
| Age Group | ||
| 65–74 | Ref | |
| ≥75 | 0.89 (0.74–1.06) | 0.201 |
| Marital Status | ||
| Married | Ref | |
| Widowed | 0.99 (0.72–1.39) | 0.993 |
| Separated/Divorced | 1.50 (1.08–2.09) | 0.015 |
| Never Married | 1.07 (0.55–2.10) | 0.832 |
| Education Level | ||
| Less than High school | Ref | |
| High school | 0.89 (0.68–1.17) | 0.423 |
| More than High school | 0.78 (0.58–1.06) | 0.119 |
| Living Status | ||
| Alone | 0.89 (0.67–1.19) | 0.449 |
| Not Alone | Ref | |
| Income | ||
| <$25,000 | 0.97 (0.76–1.23) | 0.809 |
| ≥ $25,000 | Ref | |
| Residing Area | ||
| Non-metro Area | 0.96 (0.73–1.25) | 0.760 |
| Metro Area | Ref | |
| Diabetes | ||
| No | Ref | |
| Yes | 0.95 (0.75–1.19) | 0.646 |
| High Blood Pressure No | Ref | |
| Yes | 1.06 (0.82–1.38) | 0.633 |
| Myocardial Infarction/Heart Attack | ||
| No | Ref | |
| Yes | 0.99 (0.72–1.36) | 0.975 |
| Stroke | ||
| No | Ref | |
| Yes | 1.27 (0.98–1.64) | 0.063 |
| Emphysema/Asthma/COPD | ||
| No | Ref | |
| Yes | 0.89 (0.71–1.13) | 0.374 |
| Rheumatoid Arthritis | ||
| No | Ref | |
| Yes | 1.39 (1.04–1.84) | 0.021 |
| Osteoporosis | ||
| No | Ref | |
| Yes | 1.34 (1.04–1.74) | 0.025 |
| Depression | ||
| No | Ref | |
| Yes | 1.52 (1.19–1.93) | <0.001 |
| Urinary Incontinence | ||
| No | Ref | |
| Yes | 1.48 (1.22–1.80) | <0.001 |
| Hearing Issues | ||
| No | Ref | |
| Yes | 1.34 (0.94–1.92) | 0.110 |
| Vision Issues | ||
| No | Ref | |
| Yes | 1.40 (0.94–2.07) | 0.093 |
| General Health | ||
| Characteristics | OR (95% CI) | p-value |
| Very Good/Excellent | Ref | |
| Good | 0.97 (0.74–1.27) | 0.854 |
| Fair/Poor | 1.29 (0.99–1.67) | 0.054 |
Note: Boldface indicates statistical significance (p < 0.05). LPLP = low perceived and low physiological fall risks; HPHP = high perceived and high physiological fall risks; LPHP = low perceived fall risk but high physiological fall risk; HPLP = high perceived fall risk but low physiological fall risk.
Although not the key focus of our study, some of the covariates were also significantly associated with repeated falls. For example, male beneficiaries were more likely to have repeated falls than females (OR = 1.66, p < .001). Hispanic beneficiaries were less likely to have repeated falls than non-Hispanic white beneficiaries (OR = 0.63, p = .039). The like-lihood of having repeated falls was higher for those with rheumatoid arthritis and osteoporosis than those without these conditions. Those with depression were more likely to have repeated falls than those without depression. Those with urinary incontinence were more likely to have repeated falls as well.
Discussion
Limited information is available on the associations of discrepancies between perceived and physiological fall risks with repeated falls among at-risk Medicare beneficiaries. Using a nationally representative survey, our analysis found that among community-dwelling Medicare beneficiaries with ≥ 1 fall, about 42.0% (about 4.1 million beneficiaries) had High Fear-High Physiological, followed by 25.1% with Low Fear-High Physiological and 9.4% with High Fear-Low Physiological. Repeated falls were prevalent among those with High Fear-High Physiological and Low Fear-High Physiological, with many of them having chronic and serious health problems. Those with High Fear-High Physiological were more likely to have repeated falls than those with Low Fear-Low Physiological. The findings also showed that risk factors such as rheumatoid arthritis, osteoporosis, depression, and urinary incontinence were associated with repeated falls; these conditions can be improved with appropriate treatment programs/interventions. Our findings can be used by providers and decision makers to better understand and evaluate fall risk among at-risk Medicare beneficiaries to ensure tailored interventions and fall prevention programs are recommended for different risk groups.
Although different in study design and populations, our results are consistent with a previous prospective cohort study, that examined the role of discrepancies in perceived and physiological fall risks. In that study the authors found that physiological and perceived fall risk were associated with falls (measured as ≥1 injurious fall or ≥2 non-injurious falls) among older adults aged 70–90 years, in Australia (Delbaere et al., 2010). We also found that high perceived and high physiological fall risks were associated with repeated falls compared to those with low perceived and low physiological fall risks. Additionally, based on their data about 28.8%, 40.4%, 20.0%, and 10.8% of participants had Low Fear-Low Physiological, High Fear-High Physiological, Low Fear-High Physiological, and High Fear-Low Physiological, respectively (Delbaere et al., 2010), compared to 23.5%, 42.0%, 25.1%, and 9.4% from our current study.
Fear of falling as a perceived fall risk or risk factor for falls is well documented (Delbaere et al., 2006; Thiamwong & Suwanno, 2017). The majority of previous studies have focused on negative consequences (Delbaere et al., 2006; Hadjistavropoulos et al., 2011) and management of fear of falling (Liu, Ng, Chung, & Ng, 2018). However, awareness of the potential risk of falling and associated consequences can act as a protective factor for falls, as older adults might take the right precautions for high risk behaviors/factors which may benefit them. Our study found that Medicare beneficiaries with ≥ 1 fall with High Fear-High Physiological were more likely to experience repeated falls compared to those with Low Fear-Low Physiological. This might indicate that excess fear of falling can be debilitating, and increase frailty and falls risk (Parry, Finch, & Deary, 2013) along with having high physiological risk. Our study also found that having High Fear-Low Physiological was not significantly associated with repeated falls as compared to those with Low Fear-Low Physiological. This finding was not surprising, as they were likely avoiding many activities that can cause falling because of their potentially excessive fear of falling and low physiological fall risk. Those with Low Fear-High Physiological were not more likely to experience repeated falls as compared to those with Low Fear-Low Physiological, which is a bit surprising especially when considering Low Fear-High Physiological had low fear of falling but high physiological fall risk. This could be that those with low fear of falling might have taken precautions of high-risk behaviors/factors enough to reduce those risks even with them having high physiological fall risks. Therefore, awareness of the potential risk of falling can potentially be a protective factor for falls/fall risks, with this potential relationship requiring further investigation.
With the high prevalence of at-risk Medicare beneficiaries with High Fear-High Physiological (approximately 4.1 million), the association of High Fear-High Physiological with repeated falls, and adverse health consequences of falls, interventions that can reduce both high perceived and physiological fall risks should be considered. For Medicare, over 49 million older adults aged ≥ 65 years are currently insured by the program (CMS, 2020), fall risk and home safety assessments are covered benefits and part of Annual Wellness Visit for beneficiaries (Horton, Dwyer, & Seiler, 2018). Therefore, the fall risk assessment incorporating and assessing discrepancies between perceived and physiological fall risks for this at-risk Medicare population should be considered, ensuring targeted and tailored prevention programs can be focused on those with different needs.
Our study also found that chronic condition related risk factors such as rheumatoid arthritis, osteoporosis, depression, and urinary incontinence were also associated with repeated falls. These conditions have been identified as risk factors for falls in previous studies. For example, past research found that symptoms of rheumatoid arthritis such as painful joints and lower extremity muscle weakness can affect balance, and physical ability, those with rheumatoid arthritis are at increased risk of falls (Armstrong, Swarbrick, Pye, & O’Neill, 2005). Urinary incontinence is a common health issue and potentially underreported due to embarrassment among older adults (Smith & Shah, 2018). Older adults with urinary incontinence, especially overactive bladder had a higher risk of falls compared to those without, and treatment for overactive bladder is associated with a lower risk for falls compared to those who did not receive treatment (Jayadevappa, Chhatre, Newman, Schwartz, & Wein, 2018). Depression is also a known risk factor for falls (Briggs, Kennelly, & Kenny, 2018; Choi, Marti, DiNitto, & Kunik, 2019; Pellicer-Garcia, Anton-Solanas, Moreno-Gonzalez, Castro-Sanchez, & Juarez-Vela, 2017). Older adults who are at high risk of falls tend to develop depression (Pellicer-Garcia et al., 2017). Therefore, programs and efforts to evaluate and treat/manage these chronic conditions/symptoms might work to reduce the risk of repeated falls and also prevent the progression of older adults to become High Fear-High Physiological as some of these conditions are likely having negative effects on perceived and physiological fall risks.
We also found that sex, race/ethnicity, and marital status were associated with repeated falls. Given race/ethnicity, marital status, and sex are predisposing factors, studies that specifically focus on social determinants of health, and discrepancies of perceived and physiological fall risks by race/ethnicity, marital status, and sex, are warranted to better understand the topic and to provide actionable solutions.
Sensitivity analysis
The use of secondary data limited analyses to available variables which closely, though not perfectly, measured perceived and physiological fall risks. Therefore, we performed sensitivity analysis to ensure the consistency and robustness of the findings. We defined the perceived and physiological fall risk differently and ran the analyses with seven different models (Supplemental Table S2). Generally, the results indicated that those with High Fear-High Physiological were still prevalent among beneficiaries with ≥ 1 fall (ranging from about 28% to 52%, compared to 42% in the original model), repeated falls were still prevalent among those with High Fear-High Physiological (ranging from 59.3% to 62.8%, compared to 62.1% in the original model), and those with High Fear-High Physiological were still more likely to have repeated falls (odds ratio ranging from 1.72–2.31, compared to 2.14 in the original model) than those with Low Fear-Low Physiological (except for Case 6 where having Low Fear-High Physiological was also associated with repeated falls (OR = 1.60, 95% CI = 1.18,2.17)) (Table S2). Other factors such as sex, race/ethnicity, marital status, rheumatoid arthritis, osteoporosis, depression, and urinary incontinence were still associated with repeated falls for all cases when compared to the original model. The changes to the physiological fall risk by the three variables (ADL limitation, difficulty walking/climbing stairs, and difficulty stooping/crouching/kneeling) seemed to have small impacts on the proportions of the groups, this is because the variables likely identified a similar number of individuals for the physiological fall risk (Tables S1 and S2). On the other hand, changes in Likert scale grouping of fear of falling seemed to have larger impacts on the proportions of the groups, which was expected given the distribution of the variable (Table S1). From this sensitivity analysis, we found that the proportions of beneficiaries of the four groups (those with Low Fear-Low Physiological, High Fear-High Physiological, Low Fear-High Physiological, and High Fear-Low Physiological) and repeated falls; and the regression models’ estimates remained consistent or as expected, even with various combinations of perceived and physiological fall risk.
Limitations
There are several limitations in this study. This is a cross-sectional analysis; therefore, the results represent associations rather than causation. While the current study provides a valuable national snapshot, it is possible that use of longitudinal analysis with similar and/or different variables can build on this study potentially providing analyses of trends over time or the effect of recurrent falls (e.g., it is possible that a second fall is the reason for having particularly high perceived risk). Thus, future studies exploring the National Health and Aging Trends Study or Health and Retirement Study, among others, may build on the current study’s findings. The used of self-reported data, are subject to recollection errors and other biases inherent in survey data. For example, more objective measure or known assessment tools for physiological fall risk such as BTrackS Balance System (Thiamwong et al., 2019) would be more ideal to measure physiological fall risk. Using clinical data/measures for covariates (e.g., sensory impairments) in our study could have impacted our findings. Recall bias (e.g., recall of self-reported falls) may have affected our results. Given falls, especially more serious falls, are a somewhat traumatic event, older adults may be more likely to recall these events including having repeated falls. However, capturing the exact number of falls is likely harder to validate and may require clinical data (e.g., claims data using International Classification of Diseases codes (Masud & Morris, 2001)). Of note, interviews may have been conducted with the beneficiary or a designated proxy (MCBS, 2019), that could also affect our findings. Some risk factors were not included in the model such as medications (Arena, Rataj, Thompson, Peterson, & Bennis, 2015) and environmental design (Steinman et al., 2009), which warrants further investigation. More specifically using the World Health Organization’s International Classification of Functioning theoretical framework (WHO, 2020) for a more comprehensive study and possible examination of moderated and/or mediated relationships between risk factors are warranted (e.g., sensory impairments as moderating and/or mediating variables). Finally, the current study was restricted to community-dwelling Medicare beneficiaries and may not be representative of those residing in institutional settings.
Conclusions
The health and economic burdens associated with falls are substantial. Effective prevention programs should involve a patient-centered approach, and a holistic fall risk assessment using both perceived and physiological fall risk measures. Efforts to lessen the risk that already at-risk Medicare beneficiaries have High Fear-High Physiological should be considered.
Supplementary Material
Clinical implication.
Given many at-risk Medicare beneficiaries have High Fear-High Physiological, which is associated with repeated falls, prevention efforts should emphasize reducing the risk of High Fear-High Physiological.
Assessing both perceived and physiological fall risks is important, which may inform more targeted fall interventions for different at-risk Medicare beneficiaries.
Proactive management of chronic symptoms may reduce the risk of repeated falls and possibly improve perceived and physiological fall risks.
Footnotes
Disclosure statement
No potential conflict of interest was reported by the authors.
References
- ACA. (2020). American caregiver association: ADLs and IADLs. Retrieved from https://americancaregiverassociation.org/2019/03/adls-and-iadls-2/
- Arena SK, Rataj J, Thompson M, Peterson EL, & Bennis S (2015). Medications and fall risk indicators among patients case-managed by physical therapists. Home Healthcare Now, 33(2), 96–102. doi: 10.1097/NHH.0000000000000185 [DOI] [PubMed] [Google Scholar]
- Armstrong C, Swarbrick CM, Pye SR, & O’Neill TW (2005). Occurrence and risk factors for falls in rheumatoid arthritis. Annals of the Rheumatic Diseases, 64(11), 1602–1604. doi: 10.1136/ard.2004.031195 [DOI] [PMC free article] [PubMed] [Google Scholar]
- Bergen G, Stevens MR, & Burns ER (2016). Falls and fall injuries among adults aged >/=65 years - United States, 2014. MMWR. Morbidity and Mortality Weekly Report, 65 (37), 993–998. doi: 10.15585/mmwr.mm6537a2 [DOI] [PubMed] [Google Scholar]
- Briggs R, Kennelly SP, & Kenny RA (2018). Does baseline depression increase the risk of unexplained and accidental falls in a cohort of community-dwelling older people? Data from the Irish longitudinal study on ageing (TILDA). International Journal of Geriatric Psychiatry, 33 (2), e205–e211. doi: 10.1002/gps.4770 [DOI] [PubMed] [Google Scholar]
- Burns E, & Kakara R (2018). Deaths from falls among persons aged≥ 65 years—United States, 2007–2016. Morbidity and Mortality Weekly Report, 67(18), 509. doi: 10.15585/mmwr.mm6718a1 [DOI] [PMC free article] [PubMed] [Google Scholar]
- CDC. (2019). STEDI-older adult fall prevention. Retrieved from https://www.cdc.gov/steadi/
- Choi NG, Marti CN, DiNitto DM, & Kunik ME (2019). Longitudinal associations of falls and depressive symptoms in older adults. The Gerontologist, 59(6), 1141–1151. doi: 10.1093/geront/gny179 [DOI] [PubMed] [Google Scholar]
- CMS. (2020). Medicare enrollment. Retrieved from https://www.cms.gov/Research-Statistics-Data-and-Systems/Statistics-Trends-and-Reports/CMSProgramStatistics/2017/2017_Enrollment
- Delbaere K, Close JC, Brodaty H, Sachdev P, & Lord SR (2010). Determinants of disparities between perceived and physiological risk of falling among elderly people: Cohort study. Bmj, 341(4), c4165. doi: 10.1136/bmj.c4165 [DOI] [PMC free article] [PubMed] [Google Scholar]
- Delbaere K, Crombez G, Van den Noortgate N, Willems T, & Cambier D (2006). The risk of being fearful or fearless of falls in older people: An empirical validation. Disability & Rehabilitation, 28(12), 751–756. doi: 10.1080/09638280500304794 [DOI] [PubMed] [Google Scholar]
- Dunn JE, Rudberg MA, Furner SE, & Cassel CK (1992). Mortality, disability, and falls in older persons: The role of underlying disease and disability. American Journal of Public Health, 82(3), 395–400. doi: 10.2105/AJPH.82.3.395 [DOI] [PMC free article] [PubMed] [Google Scholar]
- Florence CS, Bergen G, Atherly A, Burns E, Stevens J, & Drake C (2018). Medical costs of fatal and nonfatal falls in older adults. Journal of the American Geriatrics Society, 66 (4), 693–698. doi: 10.1111/jgs.15304 [DOI] [PMC free article] [PubMed] [Google Scholar]
- Freedman VA, Martin LG, & Schoeni RF (2002). Recent trends in disability and functioning among older adults in the United States: A systematic review. Jama, 288(24), 3137–3146. doi: 10.1001/jama.288.24.3137 [DOI] [PubMed] [Google Scholar]
- Hadjistavropoulos T, Delbaere K, & Fitzgerald TD (2011). Reconceptualizing the role of fear of falling and balance confidence in fall risk. Journal of Aging and Health, 23(1), 3–23. doi: 10.1177/0898264310378039 [DOI] [PubMed] [Google Scholar]
- Henry-Sánchez JT, Kurichi JE, Xie D, Pan Q, & Stineman MG (2012). Do elderly people at more severe activity of daily living limitation stages fall more? American Journal of Physical Medicine & Rehabilitation, 91(7), 601–610. doi: 10.1097/PHM.0b013e31825596af [DOI] [PMC free article] [PubMed] [Google Scholar]
- Horton K, Dwyer G, & Seiler N (2018). Older adult falls—costly but not inevitable. Retrieved from 10.1377/hblog20180402.25780/full/ [DOI] [Google Scholar]
- Jayadevappa R, Chhatre S, Newman DK, Schwartz JS, & Wein AJ (2018). Association between overactive bladder treatment and falls among older adults. Neurourology and Urodynamics, 37(8), 2688–2694. doi: 10.1002/nau.23719 [DOI] [PubMed] [Google Scholar]
- Jung D, Lee J, & Lee S-M (2009). A meta-analysis of fear of falling treatment programs for the elderly. Western Journal of Nursing Research, 31(1), 6–16. doi: 10.1177/0193945908320466 [DOI] [PubMed] [Google Scholar]
- Lamb SE, Jørstad-Stein EC, Hauer K, & Becker C (2005). Development of a common outcome data set for fall injury prevention trials: The prevention of falls network Europe consensus. Journal of the American Geriatrics Society, 53(9), 1618–1622. doi: 10.1111/j.1532-5415.2005.53455.x [DOI] [PubMed] [Google Scholar]
- Landers MR, Oscar S, Sasaoka J, & Vaughn K (2016). Balance confidence and fear of falling avoidance behavior are most predictive of falling in older adults: Prospective analysis. Physical Therapy, 96(4), 433–442. doi: 10.2522/ptj.20150184 [DOI] [PubMed] [Google Scholar]
- Legters K (2002). Fear of falling. Physical Therapy, 82(3), 264–272. doi: 10.1093/ptj/82.3.264 [DOI] [PubMed] [Google Scholar]
- Liu T-W, Ng GYF, Chung RCK, & Ng SSM (2018). Cognitive behavioural therapy for fear of falling and balance among older people: A systematic review and meta-analysis. Age and Ageing, 47(4), 520–527. doi: 10.1093/ageing/afy010 [DOI] [PubMed] [Google Scholar]
- Lord SR, Menz HB, & Tiedemann A (2003). A physiological profile approach to falls risk assessment and prevention. Physical Therapy, 83(3), 237–252. doi: 10.1093/ptj/83.3.237 [DOI] [PubMed] [Google Scholar]
- Masud T, & Morris RO (2001). Epidemiology of falls. Age and Ageing, 30(suppl 4), 3–7. doi: 10.1093/ageing/30.suppl_4.3 [DOI] [PubMed] [Google Scholar]
- MCBS. (2019). Medicare current beneficiary survey. Retrieved from https://www.cms.gov/Research-Statistics-Data-and-Systems/Downloadable-Public-Use-Files/MCBS-Public-Use-File
- Mlinac ME, & Feng MC (2016). Assessment of activities of daily living, self-care, and independence. Archives of Clinical Neuropsychology, 31(6), 506–516. doi: 10.1093/arclin/acw049 [DOI] [PubMed] [Google Scholar]
- Moncada LVV, & Mire LG (2017). Preventing falls in older persons. American Family Physician, 96(4), 240–247. [PubMed] [Google Scholar]
- Murphy SL, Dubin JA, & Gill TM (2003). The development of fear of falling among community-living older women: Predisposing factors and subsequent fall events. The Journals of Gerontology Series A: Biological Sciences and Medical Sciences, 58(10), M943–947. doi: 10.1093/gerona/58.10.M943 [DOI] [PMC free article] [PubMed] [Google Scholar]
- Nevitt MC, Cummings SR, Kidd S, & Black D (1989). Risk factors for recurrent nonsyncopal falls. A prospective study. Jama, 261(18), 2663–2668. doi: 10.1001/jama.1989.03420180087036 [DOI] [PubMed] [Google Scholar]
- Nourhashemi F, Andrieu S, Gillette-Guyonnet S, Vellas B, Albarede JL, & Grandjean H (2001). Instrumental activities of daily living as a potential marker of frailty: A study of 7364 community-dwelling elderly women (the EPIDOS study). The Journals of Gerontology Series A: Biological Sciences and Medical Sciences, 56(7), M448–453. doi: 10.1093/gerona/56.7.M448 [DOI] [PubMed] [Google Scholar]
- Parry SW, Finch T, & Deary V (2013). How should we manage fear of falling in older adults living in the community? Bmj, 346(may28 2), f2933. doi: 10.1136/bmj.f2933 [DOI] [PubMed] [Google Scholar]
- Pellicer-Garcia B, Anton-Solanas I, Moreno-Gonzalez S, Castro-Sanchez E, & Juarez-Vela R (2017). Prevalence of depression and associated factors in non-institutionalized older adults with a previous history of falling. Archives of Psychiatric Nursing, 31(5), 493. doi: 10.1016/j.apnu.2017.06.006 [DOI] [PubMed] [Google Scholar]
- Shumway-Cook A, Ciol MA, Hoffman J, Dudgeon BJ, Yorkston K, & Chan L (2009). Falls in the medicare population: Incidence, associated factors, and impact on health care. Physical Therapy, 89(4), 324–332. doi: 10.2522/ptj.20070107 [DOI] [PMC free article] [PubMed] [Google Scholar]
- Smith EM, & Shah AA (2018). Screening for geriatric syndromes: Falls, urinary/fecal incontinence, and osteoporosis. Clinics in Geriatric Medicine, 34(1), 55–67. doi: 10.1016/j.cger.2017.08.002 [DOI] [PubMed] [Google Scholar]
- Steinman BA, Allen SM, Chen J, & Pynoos J (2015). Functional limitations as potential mediators of the effects of self-reported vision status on fall risk of older adults. Journal of Aging and Health, 27(1), 158–176. doi: 10.1177/0898264314543473 [DOI] [PubMed] [Google Scholar]
- Steinman BA, Pynoos J, & Nguyen AQ (2009). Fall risk in older adults: Roles of self-rated vision, home modifications, and limb function. Journal of Aging and Health, 21(5), 655–676. doi: 10.1177/0898264309338295 [DOI] [PMC free article] [PubMed] [Google Scholar]
- Thiamwong L, Huang HJ, Ng BP, Yan X, Sole ML, Stout JR, et al. (2019). Shifting maladaptive fall risk appraisal in older adults through an in-home physio-fEedback and exercise pRogram (PEER): A pilot study. Clinical gerontologist, 143(4), 378–390. doi: 10.1080/07317115.2019.1692120 [DOI] [PubMed] [Google Scholar]
- Thiamwong L, & Suwanno J (2017). Fear of falling and related factors in a community-based study of people 60 years and older in Thailand. International Journal of Gerontology, 11(2), 80–84. doi: 10.1016/j.ijge.2016.06.003 [DOI] [Google Scholar]
- Thompson WW, Zack MM, Krahn GL, Andresen EM, & Barile JP (2012). Health-related quality of life among older adults with and without functional limitations. American Journal of Public Health, 102(3), 496–502. [DOI] [PMC free article] [PubMed] [Google Scholar]
- Tinetti ME (1986). Performance-oriented assessment of mobility problems in elderly patients. Journal of the American Geriatrics Society, 34(2), 119–126. doi: 10.1111/j.1532-5415.1986.tb05480.x [DOI] [PubMed] [Google Scholar]
- Tinetti ME, Speechley M, & Ginter SF (1988). Risk factors for falls among elderly persons living in the community. New England Journal of Medicine, 319(26), 1701–1707. doi: 10.1056/NEJM198812293192604 [DOI] [PubMed] [Google Scholar]
- Vieira ER, Palmer RC, & Chaves PH (2016). Prevention of falls in older people living in the community. Bmj, 353, i1419. doi: 10.1136/bmj.i1419 [DOI] [PubMed] [Google Scholar]
- Ward CD, Koenig KT, Hasche JC, Loganathan S, & Guerino P (2017). Does disability affect receipt of preventive care services among older medicare beneficiaries? Centers for Medicare and Medicaid Services. Retrieved from https://www.cms.gov/About-CMS/Agency-Information/OMH/research-and-data/information-products/data-highlights/Does-Disability-Affect-Receipt-of-Preventive-Ca Retrieved from https://www.cms.gov/About-CMS/Agency-Information/OMH/research-and-data/information-products/data-highlights/Does-Disability-Affect-Receipt-of-Preventive-Care [Google Scholar]
- WHO. (2020). International classification of functioning, disability and health. Retrieved from https://www.who.int/classifications/icf/en/
- Yamazaki Y, Hayashida CT, & Yontz V (2017). Insights about fall prevention of older adults in the state of Hawaiʻi. Hawaiʻi Journal of Medicine & Public Health, 76(1), 3–8. [PMC free article] [PubMed] [Google Scholar]
Associated Data
This section collects any data citations, data availability statements, or supplementary materials included in this article.