ABSTRACT
To understand the epidemiological trend of gonorrhea in China from 2004 to 2021, predict the prevalence of the disease, and provide basic theory and data support for monitoring and managing gonorrhea. Gonorrhea incidence data in China from 2004 to 2021 were collected through the China Public Health Science Data Center and National Administration of Disease Prevention and Control, and the incidence and epidemiological characteristics were analyzed. Statistical analysis was performed using Joinpoint and autoregressive integrated moving average (ARIMA) models. A linear correlation model was used to analyze the correlation between gross domestic product (GDP) and the incidence rate. From 2004 to 2021, a total of 2,289,435 cases of gonorrhea were reported in China, with an average reported incidence rate of 9.46/100,000 people and a downward followed by an upward trend. Individuals with gonorrhea were primarily 20–30 y of age, with 1,034,847 cases (53.38%) from 2004 to 2018. The trend of increasing incidence was most obvious in the 10–20 age group (5,811 cases in 2004 to 12,752 cases in 2018, AAPC = 6.1, P < .001). The incidence of gonorrhea in China was negatively correlated with GDP from 2004 to 2021 (r = -0.547, P = .019). The correlation coefficient between the average incidence growth rate of each region from 2012 to 2018 and the average growth rate of regional GDP was 0.673 (P < .01). The root mean square error (RMSE) of the ARIMA model was 4.89%, showing powerful performance. There would be 97,910 gonorrhea cases in 2023 as predicted by the model.
KEYWORDS: Gonorrhea, epidemiological trend, predict, GDP, ARIMA model
Introduction
Gonorrhea is a sexually transmitted disease caused by Neisseria gonorrhoeae (N. gonorrhoeae) with pyogenic infection of the genitourinary system as the main clinical manifestation. Infected patients may have symptoms such as dysuria and/or purulent discharge from the urethra regardless of sex, but most cases of gonorrhea are asymptomatic infections.1 The occurrence of gonorrhea is characterized by a short incubation period and strong infectivity2 and thus may cause serious complications, including epididymitis, tubal inflammation, pelvic inflammatory disease, ectopic pregnancy, and infertility, if infected patients do not receive timely and thorough treatment.1–5
Gonorrhea is widely prevalent worldwide, with the World Health Organization (WHO) estimating that there would be approximately 80 million new cases of gonococcal infections worldwide in 2020 (95% CI: 48–13 million),6 making it the second most prevalent sexually transmitted infection worldwide after Chlamydia trachomatis. The Western Pacific region, including China, has the third highest prevalence of gonorrhea worldwide (estimated prevalence 0.7%, 95% CI: 0.4%–1.2% for men and 0.9%, 95% CI: 0.5%–1.3% for women in 2016),3 and 127,803 cases of gonorrhea were reported in China in 2021, with an incidence rate of 9.07/100,000 people, ranking fourth among B category infectious diseases.7 Notably, with the widespread use of antibiotics, N. gonorrhoeae has exhibited antimicrobial resistance to every class of antibiotics currently available.1,8–10 In 2017, the WHO published the first list of the 12 most dangerous drug-resistant bacteria, in which N. gonorrhoeae was classified as a “highly” resistant pathogen. To date, no vaccine has been successfully developed to effectively curb gonorrhea, which has become a major threat to public health worldwide.
The WHO statistics show that the prevalence of gonorrhea is highest in low-income countries and regions as classified by the World Bank.3 As a developing country, there are still gaps in economic development among regions in China, so it is necessary to analyze the trend of gonorrhea prevalence under economic influence. Current studies on the epidemiological trends of gonorrhea in China have mostly focused on the provincial and municipal scales11–14 and have not been able to ascertain the trend of prevalence, except in the study by Chen et al. on the analysis of gonorrhea incidence and mortality in China from 2004 to 2017.15 In this study, we increased the data of the 2018–2021 to analyze the national gonorrhea incidence from 2004 to 2021 and combined gonorrhea incidence data and regional GDP data in China from 2012 to 2018 to analyze the correlation between economic development and incidence. Based on this data, we predict the disease epidemic trend to provide a theoretical basis for the prevention and treatment of gonorrhea and the allocation of basic health resources in China.
Materials and methods
Data collection
Data on gonorrhea in 31 provinces (cities and autonomous regions, excluding Hong Kong, Macao and Taiwan) from 2004 to 2018 were obtained from the China Public Health Science Data Center (https://www.phsciencedata.cn/Share/ky_sjml.jsp?id=44c50a95-c952-4ad2-ba3a-08866d869df8), and national gonorrhea data for 2019–2021 were obtained from the National Administration of Disease Prevention and Control (http://www.nhc.gov.cn/jkj/new_index.shtml), with diagnostic criteria according to the Diagnostic Criteria for Gonorrhea (WS268–2019). The data forthe number of medical institutions were collected from the National Health Commission of People’s Republic of China (http://www.nhc.gov.cn/mohwsbwstjxxzx/s7967/201901/94fcf9be64b84ccca2f94e3efead7965.shtml). The 2004–2021 GDP data, regional GDP data for 31 provinces from 2012 to 2018 and population data were obtained from the National Bureau of Statistics (https://data.stats.gov.cn/easyquery.htm?cn=E0103).
Methods
Establishment of the database
Gonorrhea data were summarized using Excel software to establish a database of gonorrhea incidence. The database contained the gonorrhea incidence rate, mortality rate, and average annual growth rate of the incidence for each region, age group, and month in China from 2004 to 2018, as well as the gonorrhea incidence for each month from 2019 to 2021. Regional GDP was summarized using Excel software, and the average annual growth rate of GDP was calculated for each region.
Joinpoint regression
The analysis was completed using Joinpoint 4.9.1.0 software.16 The optimal Joinpoint model was fitted to assess the annual percent change (APC) and average annual percent change (AAPC) of gonorrhea incidence from 2004 to 2021, with an APC > 0 indicating an increase in the incidence during the study period and APC < 0 indicating the opposite. If there was no connection point during the study period, we assumed that the APC = AAPC, which meant that the overall trend of the data increased or decreased without changes. The test level was α = 0.05.
Correlation analysis
SPSS 25.0 software was used to analyze the correlation between the incidence rate of gonorrhea with nationwide GDP from 2004 to 2021, and the correlation between the growth rate of gonorrhea incidence and regional GDP from 2012 to 2018 in 31 provinces was also analyzed.
Incidence trend prediction
The ARIMA model was used to predict the number of gonorrhea cases.16–18 The model was fitted using 2004–2020 Chinese gonorrhea incidence data as the training set. Then, the autocorrelation and partial autocorrelation plots of the data series were plotted to test whether the data were a smooth time series, and the model was tested for statistical significance by the Ljung – Box test (Q18). The test level was α = 0.05. The model was applied to predict the number of incident cases in each month of 2021 and compared with the observed values to evaluate the predictive effect of the model and to predict the number of incident cases in China in 2022–2023. The number of incident cases in key age groups and key regions from 2004 to 2017 was used as the training set to fit the models. The models were applied to predict the number of incident cases in the corresponding age groups and regions in each month of 2018 and validated with the observed values to evaluate the model prediction effect and predict the corresponding incident cases in 2019–2023.
Results
Three interdistribution characteristics
Temporal distribution characteristics
From 2004 to 2021, a total of 2,289,435 cases of gonorrhea and 19 deaths were reported in China, with an annual average of 127,191 reported cases, an annual average reported incidence rate of 9.46/100,000 people, and an annual average reported mortality rate of 0.000109/100,000 people. As shown in Figure 1(a), the number of reported cases showed a downward then upward trend with 2011 as the division point. The AAPC for 2004–2021 was −2.8 (95% CI: −4.6~-1.0, P = .002), of which the APC was −10.8 (95% CI: −14.1~-7.4, P < .001) between 2004 and 2011, and the APC was 3.8 (95% CI: −14.1~-7.4, P < .001) between 2011 and 2021. The highest number of cases was reported in 2004 (225,421 cases, incidence rate 17.34/100,000 people), followed by 2005 (180,316 cases, incidence rate 13.87/100,000 people); the lowest number of cases was reported in 2012 (91,853 cases, incidence rate 6.82/100,000 people) and in 2014 (95,473 cases, incidence rate 7.05/100,000 people).
Figure 1.
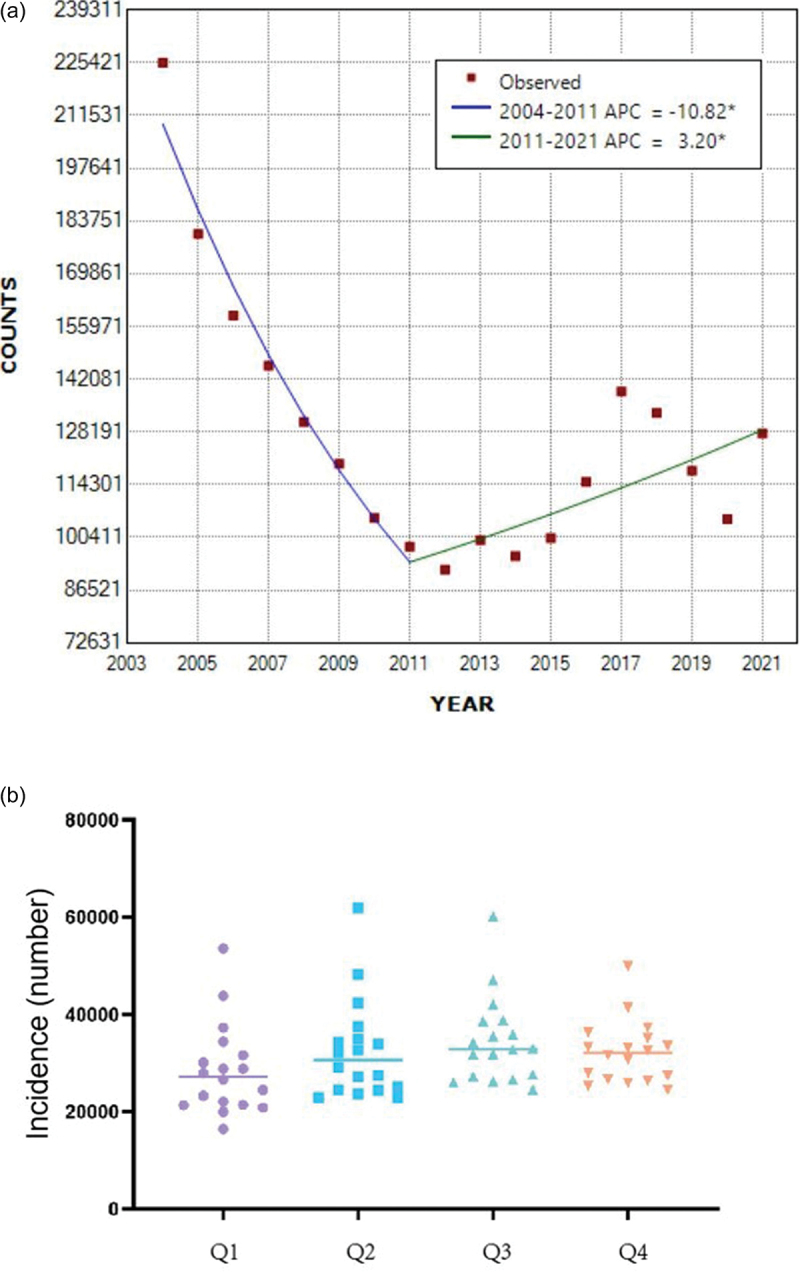
(a). Trends in the annual number of reported incident cases of gonorrhea in China, 2004–2021. (b). Seasonal trends in the number of gonorrhea cases from 2004 to 2021.
Quarterly changes in the number of incident cases are shown in Figure 1(b), with a mean number of 31,879 cases in each quarter and a slightly lower mean number in the first quarter (28,467 cases). There were no significant seasonal differences in the number of incident cases (P = .094).
Population distribution characteristics
Because the age-specific data were updated only until 2018, the analysis was based on data from 2004 to 2018. The age distribution of the reported cases was uneven (P < .001), and the cases were mostly concentrated in the 20–30 age group, with 1,034,847 cases, accounting for 53.38% of the total number of reported cases; the average annual incidence rate of this age group was 65.72/100,000 people. The trend of the number of gonorrhea cases in each age group from 2004 to 2018 is shown in Figure 2, and the data display an obvious upward trend in the incidence in the 10–20 age group (the number of cases increased from 5,811 in 2004 to 12,752 in 2018, and accordingly, the incidence rate increased from 5.33/100,000 to 15.37/100,000 people), and the 20–30 age group was the main source of the number of incident cases. Moreover, the >80 age group also showed a certain upward trend (the number of incident cases increased from 88 cases in 2004 to 237 cases in 2018, and the corresponding incidence rate increased from 1.52/100,000 to 1.56/100,000 people). The number of incident cases in other age groups showed a downward or steady trend.
Figure 2.
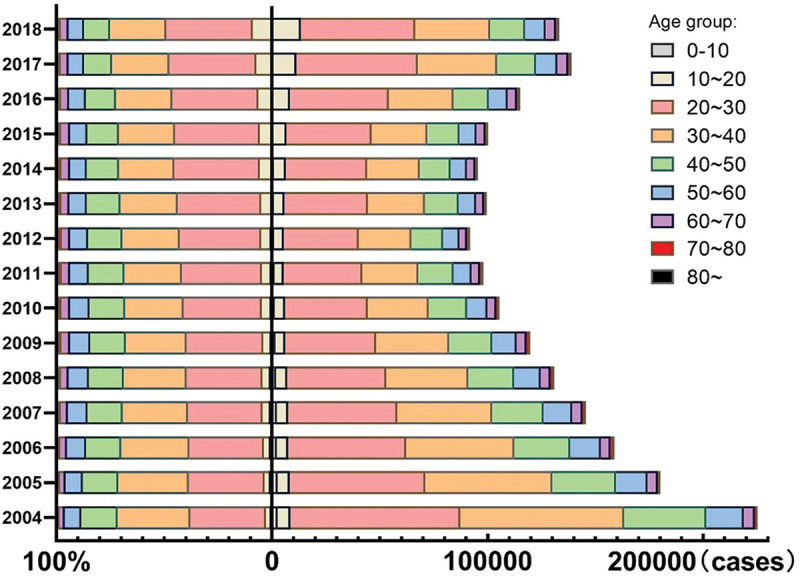
Number and percentage of incident cases by age group during 2004–2018.
Regional distribution characteristics
In China, the incidence rate of gonorrhea was negatively correlated with GDP from 2004 to 2021 (r = −0.547, P = .019) (Figure 3), similar to the global gonorrhea epidemic and regional economic trends reported by the WHO. Because the region-specific data were also only updated until 2018, we further analyzed the correlation between the incidence growth rate and GDP growth rate of each region based on the results of the Joinpoint analysis of gonorrhea prevalence trends in China and selected 2012–2018, when the incidence increased. The data showed that the GDP growth rate was positive in all regions, and the incidence growth rate was positive in most regions. The correlation between them is shown in Figure 4, with a correlation coefficient of 0.673 (P < .001).
Figure 3.
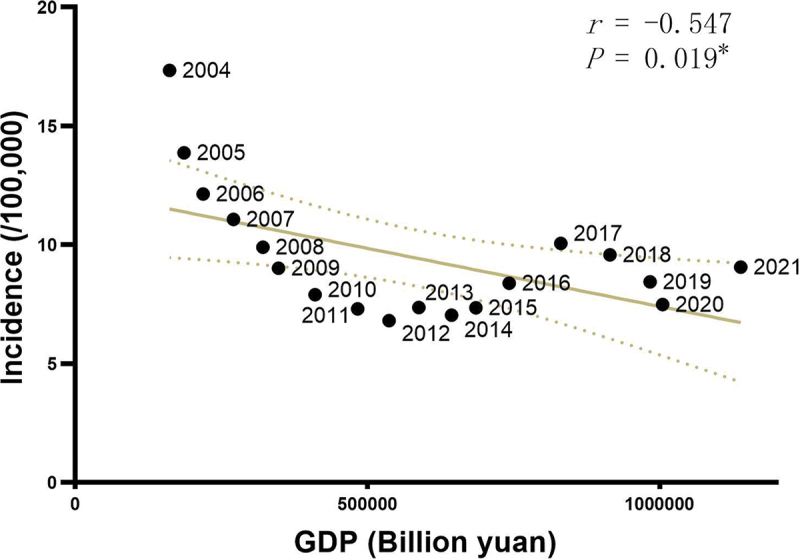
The association between national gross domestic product (GDP) and gonorrhea incidence, 2004–2021.
Figure 4.
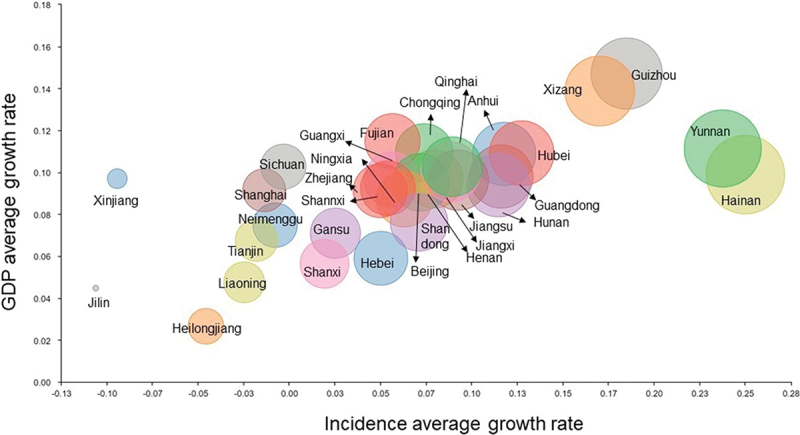
Plot of the relationship between the average growth rate of gonorrhea and the average growth rate of regional gross domestic product (regional GDP) by region from 2012–2018. Bubble size corresponds to the average growth rate of gonorrhea.
At the same time, considering the diverse distribution of medical resources and the gaps in medical level in different regions of China, we further analyzed the correlation between the number of medical institutions per 10,000 people and the incidence rate of gonorrhea in each region. The result showed that, similar to GDP, the number of medical institutions per 10,000 people was negatively associated with the gonorrhea incidence (r = −0.487, P = .005) (Figure 5).
Figure 5.
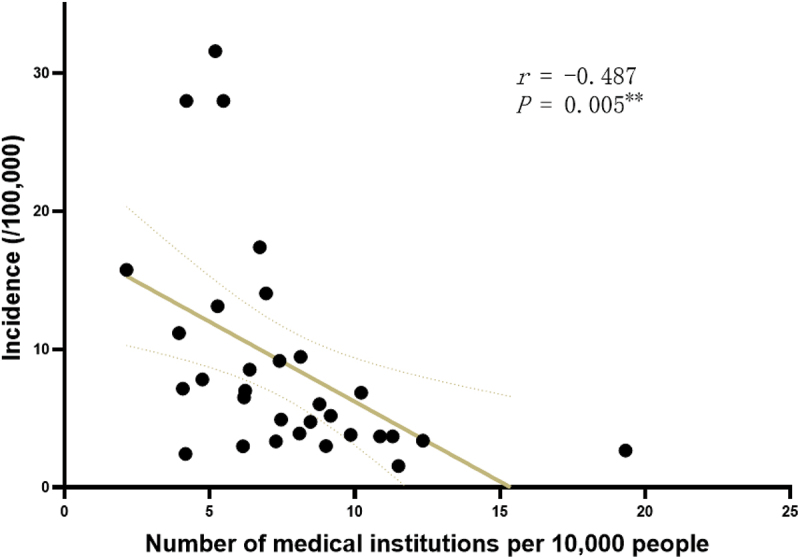
The association between the number of medical institutions per 10,000 people and gonorrhea incidence.
Incidence trend prediction
Data processing
The number of monthly incident cases of gonorrhea from 2004 to 2020 was collected, and no missing values were observed during the statistical process. The data were tested for temporal smoothness using augmented Dickey–Fuller (ADF) tests and showed a significant trend (t = −1.905, P = .330) (Table 1), and the autocorrelation and partial autocorrelation of the data series were both trailing (Figure 6a). After differencing the raw data, the data were stationary (t = −10.436, P < .001) (Table 1), and both autocorrelation and partial autocorrelation were truncated (Figure 6b).
Table 1.
ADF test table.
| Variable | Differences | t | P |
|---|---|---|---|
| Incidence | 0 | −2.54 | .107 |
| 1 | −2.75 | .066 | |
| 2 | −10.13 | <.001 |
Figure 6.
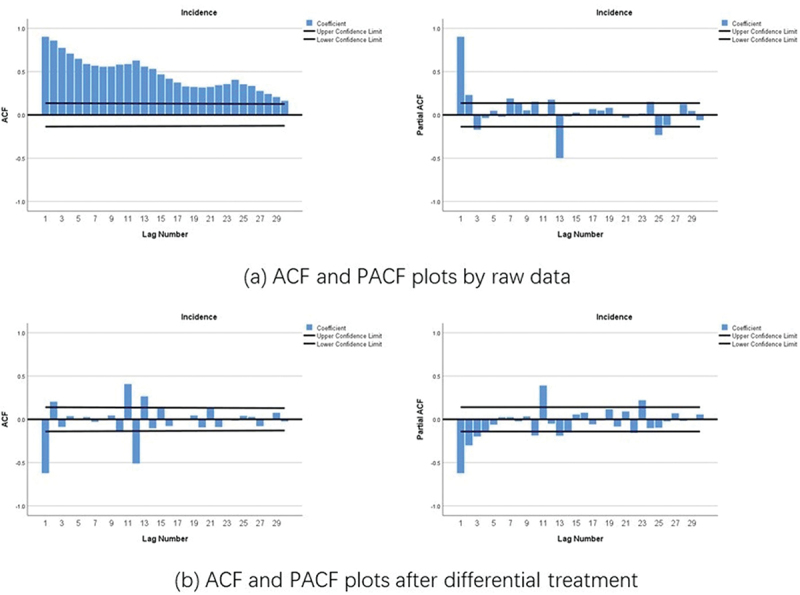
Autocorrelation function (ACF) and partial autocorrelation (PACF) plots by raw data (a) and after differential treatment (b) for the number of incident cases from 2004 to 2018.
ARIMA model fitting
Firstly, the monthly incident cases of gonorrhea from 2004 to 2020 in China were used as training data to establish the ARIMA model. Secondly, the number of monthly incident cases of gonorrhea in the 10–20 and 20–30 age groups from 2004 to 2017 was used as training data to build the ARIMA models according to the characteristics of the age groups regarding gonorrhea incidence. Finally, based on the feature that the average incidence growth rate of gonorrhea and the average regional GDP growth rate were correlated, two regions (Yunnan Province and Hainan Province) where the average incidence growth rate was higher than the average GDP growth rate were selected, and their monthly numbers of incident cases from 2004 to 2017 were used as training data to fit the ARIMA models. The model statistics showed that the goodness-of-fit R2 values were all above 0.8, and the P values of the Ljung – Box (Q18) test were all greater than 0.05, which were not significant at the test level of α = 0.05; thus, the hypothesis that the residuals were white noise could not yet be rejected (Table 2).
Table 2.
ARIMA model statistics.
| Model no. | Training set | Model | R2 | Ljung – Box (Q18) test |
MAE | MAPE(%) | RMSE | |
|---|---|---|---|---|---|---|---|---|
| t | P value | |||||||
| 1a | 2004–2020 national incidence | ARIMA(0,1,1)(1,1,0) | 0.92 | 20.50 | .199 | 470.06 | 4.89 | 674.03 |
| 1b | 2004–2011 national incidence | ARIMA(0,1,1)(1,1,0) | 0.90 | 18.91 | .273 | 552.16 | 5.09 | 801.70 |
| 1c | 2012–2020 national incidence | ARIMA(0,1,1)(1,1,0) | 0.91 | 10.75 | .825 | 390.74 | 4.41 | 569.95 |
| 2a | 10–20 age group incidence | ARIMA(0,1,1)(0,1,1) | 0.94 | 9.89 | .872 | 28.83 | 6.62 | 37.72 |
| 2b | 20–30 age group incidence | ARIMA(0,1,1)(1,1,0) | 0.92 | 17.44 | .357 | 171.46 | 4.72 | 233.48 |
| 3a | Yunnan Province incidence | ARIMA(0,1,1)(0,1,1) | 0.91 | 10.31 | .850 | 23.66 | 12.67 | 30.21 |
| 3b | Hainan Province incidence | ARIMA(0,1,1)(0,1,1) | 0.87 | 14.44 | .566 | 13.40 | 16.12 | 17.12 |
Incidence trend prediction
The prediction of nationwide incident cases by month in 2021 (Table 3), the predicted incident cases by month in 2018 for people aged 10–20 y and 20–30 y, and the prediction of the number of incident cases by month in 2018 in Yunnan and Hainan provinces showed that the predicted incident cases matched the observed incident cases effectively, and the mean absolute error (MAE), mean absolute percentage error (MAPE) and RMSE were used to evaluate the models’ prediction performance. The results show that the fitted models could powerfully predict the incidence trend of gonorrhea (Table 3, Figure 7). Notably, the model based on the national monthly number of incident cases from 2012 to 2020 had even better prediction performance.
Table 3.
Predicted and observed number of incident cases by month in 2021.
| Month | Prediction (cases) |
95% LCL (cases) |
95% UCL (cases) |
Observation (cases) |
Month | Prediction (cases) |
95% LCL (cases) |
95% UCL (cases) |
Observation (cases) |
|---|---|---|---|---|---|---|---|---|---|
| 1 | 11,047 | 9,795 | 12,300 | 10,284 | 7 | 11,642 | 9,484 | 13,801 | 11,747 |
| 2 | 7,241 | 5,797 | 8,685 | 7,650 | 8 | 11,637 | 9,362 | 13,911 | 12,019 |
| 3 | 9,064 | 7,451 | 10,676 | 10,878 | 9 | 11,650 | 9,265 | 14,035 | 11,744 |
| 4 | 9,988 | 8,224 | 11,753 | 10,874 | 10 | 11,149 | 8,658 | 13,639 | 10,720 |
| 5 | 10,908 | 9,003 | 12,813 | 10,773 | 11 | 11,496 | 8,904 | 14,087 | 11,119 |
| 6 | 10,001 | 7,966 | 12,037 | 10,950 | 12 | 11,884 | 9,194 | 14,573 | 11,264 |
Figure 7.
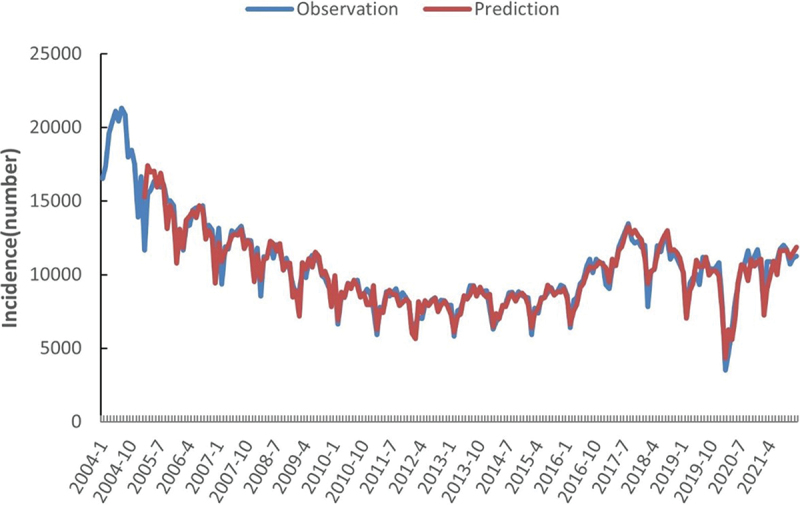
Monthly gonorrhea incidence and fitting values predicted by ARIMA, 2004–2021.
The observed number of incident cases was added to the model to predict the incident cases in China in 2022–2023, the number of incident cases in the 10–20 and 20–30 age groups, and the number of incident cases in Yunnan and Hainan provinces in 2019–2023. The results are shown in Table 4. The prediction of incident cases in 2023 was 97,910, which was slightly lower than before; the number of incident cases among people aged 10–20 y and 20–30 y increased from 12,752 and 53,216 cases in 2018 to 14,832 and 99,049 cases in 2023, respectively; the number of incident cases in Yunnan Province and Hainan Province increased substantially during the study period from 6,297 and 2,806 cases in 2018 to 16,184 and 5,380 cases in 2023, respectively.
Table 4.
ARIMA model prediction of the incidence rates for 2019–2023.
| Prediction of national incidence |
Prediction of the incidence in the 10–20 age group |
Prediction of the incidence in the 20–30 age group |
Prediction of the incidence in Yunnan Province |
Prediction of the incidence in Hainan Province |
|||||||||||
|---|---|---|---|---|---|---|---|---|---|---|---|---|---|---|---|
| Year | Prediction (cases) |
95% LCL (cases) |
95% UCL (cases) |
Prediction (cases) |
95% LCL (cases) |
95% UCL (cases) |
Prediction (cases) |
95% LCL (cases) |
95% UCL (cases) |
Prediction (cases) |
95% LCL (cases) |
95% UCL (cases) |
Prediction (cases) |
95% LCL (cases) |
95% UCL (cases) |
| 2019 | – | – | – | 12,329 | 10,824 | 13,834 | 70,470 | 54,191 | 86,748 | 8,309 | 6,964 | 9,653 | 3,195 | 2,730 | 3,661 |
| 2020 | – | – | – | 12,955 | 10,888 | 15,022 | 76,871 | 50,626 | 103,115 | 10,013 | 8,163 | 11,864 | 3,679 | 3,054 | 4,305 |
| 2021 | – | – | – | 13,581 | 10,889 | 16,273 | 84,658 | 46,886 | 122,429 | 11,894 | 9,494 | 14,294 | 4,205 | 3,401 | 5,008 |
| 2022 | 109,012 | 92,725 | 125,298 | 14,206 | 10,831 | 17,582 | 91,590 | 40,811 | 142,369 | 13,951 | 10,961 | 16,942 | 4,772 | 3,774 | 5,770 |
| 2023 | 97,910 | 65,959 | 129,857 | 14,832 | 10,720 | 18,944 | 99,049 | 33,990 | 164,109 | 16,184 | 12,564 | 19,805 | 5,380 | 4,172 | 6,588 |
Discussion
Currently, the increasing number of gonococcal infections worldwide has exacerbated the severe drug resistance situation. The WHO lists N. gonorrhoeae as a “priority pathogen,” and new therapies are urgently needed19; however, there is still a lack of effective vaccines against N. gonorrhoeae. Therefore, we still need to analyze and predict epidemiological trends, identify priority regions and populations, and rely on nontherapeutic regulatory measures to try to achieve precise prevention to minimize the social burden of gonorrhea.
The results of our analysis showed that the number of reported gonorrhea cases in China from 2004 to 2021 showed an upward after a downward trend (AAPC = −2.8, 95% CI: −4.6~-1.0, P = .002), and the number of new cases in most regions of China showed a decrease followed by an increase. In 2022, Chen et al. reported the gonorrhea incidence and mortality in China from 2004 to 2017 and our conclusions were similar to those of Chen et al.15 The addition of data from 2017 to 2021 in our analysis suggests that there is still an upward trend in gonorrhea cases during this time period. Regarding the age group of incident cases, the cases were mainly concentrated among those aged 20–30 y (1,034,847 cases, accounting for 53.38% of the total number of reported cases), while there was a significant upward trend in the number of incident cases in the 10–20 age group. This finding is consistent with the age of the susceptible population worldwide, with the CDC estimating that young people aged 15–24 y accounted for nearly half of the 26 million new cases of sexually transmitted infections in the United States in 2018.20 The 2010–2015 gonorrhea incidence statistics in Canada also showed the highest incidence among 15-29-y-olds.21 In the South African clinical/community population, the pooled estimate of the prevalence of gonorrhea among 15–24-y-olds was 4.6% (95% CI: 3.3%–6.4%).22 Young adults are susceptible to gonorrhea, which may be because they are sexually active while undergoing physical and mental development, with open sexual attitudes coupled with weaker awareness of sexual safety. This result strongly suggests that we should strengthen the popularization of sexual safety education, focusing on key populations and increasing screening efforts.
Furthermore, we found a certain correlation between economic development and the occurrence of infectious diseases. On the one hand, economic development accelerates the incidence rate and enriches the transmission routes of infectious diseases23; on the other hand, epidemics of infectious diseases may pose a great threat to primary health care while challenging the local economic situation. Although the incidence of gonorrhea is affected by many factors, overall, the prevalence of gonorrhea is higher in low-income countries than in high-income countries. Worldwide, the highest prevalence of gonorrhea was found in the African region (1.9% for women and 1.6% for men), the American region (0.9% for women and 0.8% for men), and the Western Pacific region (0.9% for women and 0.7% for men), and the lowest prevalence was found in the European region (0.3% for women and 0.3% for men).6 In the present analysis, we found a certain negative correlation between China’s GDP and the incidence of gonorrhea (r = −0.547, P = .019). Additionally, further analysis of the years 2012–2018, when the incidence was on the rise, showed that the average growth rate of gonorrhea in different regions during that time period ranged from −10.60% to 25.02%, and the growth rate was correlated with the average GDP growth rate of each region (r = 0.673, P < .001). Our findings are similar to those of other studies.13,15,16,24 Notably, some regions exhibited an average disease growth rate higher than the regional GDP growth rate, such as Yunnan and Hainan provinces, suggesting that we should focus on such regions and strengthen the construction and support of basic medical resources. By analyzing the correlation between the distribution of medical resources and the incidence of gonorrhea, we further confirmed that the number of medical institutions per 10,000 people was negatively correlated with the incidence of gonorrhea (r = −0.487, P = .005), suggesting that we should also strengthen the construction of basic medical institutions in densely populated areas.
We need to spare no effort in developing effective vaccines for gonorrhea, but until then, we should keep a preventative approach in mind. Accurate prediction of the incidence of gonorrhea is essential for early intervention and better medical planning. The ARIMA model is a classical time-series model for short-term prediction by analyzing the time series of historical data, and it has been widely used to predict the incidence of COVID-19,25–27 and it also performed well in predicting the incidence of sexually transmitted diseases.28,29 ARIMA model has its advantages, such as extracting temporal information as much as possible to optimize the prediction performance, relatively simple modeling process, and real-time model optimization, etc. In this study, we used this model to predict the number of gonorrhea cases in the next few years, and in the process of model fitting, we used the monthly incidence as the training set; the model’s R2 was 0.92, predicting 105,898 gonorrhea cases in 2020 and 129,860 cases in 2021, and the corresponding observed cases were 105,16030 and 127,803,7 respectively. The prediction results showed that the model based on incidence data from 2012 to 2021 had better predictive efficacy, suggesting that when predicting the epidemiological trends of infectious diseases, it is also necessary to pay attention to the impact of other circumstances, such as relevant policies. For example, the outbreak of COVID-19 in early 2020 may have had a strong impact on the prediction performance of the model. In order to control the rapid spread of COVID-19 pandemic, the Chinese government quickly introduced policies such as city lockdown, home-staying, keep social distance, which curb the spread of COVID-19 effectively.31,32 However, all those measures can broadly affect sexual behaviors and health. According to the study by Yan et al.,33 in China, patients with STDs interrupted follow-up at the beginning of the COVID-19 outbreak, and the first visit patients sharply declined. The same situation happened in other countries. In America, sexually transmitted diseases including gonorrhea test counts decreased and test positivity increased during the pandemic period.34 According to the report from Greece,35 Cuba36 and Denmark,37 the epidemiology of STDs has been widely affected by the COVID-19 pandemic, and presented a trend of dramatic decrease. Such data changes may cause the instability of the time series, thus affecting the prediction effect of the model. It should also be noted that the ARIMA model is more suitable for short-term forecasting and may cause problems such as a wide confidence interval due to large standard errors in forecasting over long time horizons.
In summary, the incidence of gonorrhea in China during 2004–2021 showed a decline followed by a rebound, and it was predicted that the number of incident cases would fall slightly in 2022–2023, with an average of 110,000 reported cases per year; the incidence of gonorrhea showed differences in age and regional distribution, and the focus should be on the young population with an obvious trend of increasing incidence and regions with a faster growth rate of the incidence. Screening should be expanded to strengthen education to control the gonorrhea epidemic; the ARIMA model has powerful application value in predicting the trend of gonorrhea incidence and can be applied to the management of and intervention in gonorrhea by relevant departments.
Funding Statement
This work was supported by grant from the Yunnan Provincial Science and Technology Department [202002AA100009] and NMPA Key Laboratory for Quality Control and Evaluation of Vaccines and Biological Products (2023-KFKT-002). The funders had no role in study design, data collection and analysis, decision to publish or preparation of the manuscript.
Disclosure statement
No potential conflict of interest was reported by the author(s).
References
- 1.Lin EY, Adamson PC, Klausner JD.. Epidemiology, treatments, and vaccine development for antimicrobial-resistant Neisseria gonorrhoeae: current strategies and future directions. Drugs. 2021;81(10):1153–9. doi: 10.1007/s40265-021-01530-0. [DOI] [PMC free article] [PubMed] [Google Scholar]
- 2.Kirkcaldy RD, Weston E, Segurado AC, Hughes G. Epidemiology of gonorrhoea: a global perspective. Sex Health. 2019;16(5):401. doi: 10.1071/SH19061. [DOI] [PMC free article] [PubMed] [Google Scholar]
- 3.Rowley J, Vander Hoorn S, Korenromp E, Low N, Unemo M, Abu-Raddad LJ, Chico RM, Smolak A, Newman L, Gottlieb S, et al. Chlamydia, gonorrhoea, trichomoniasis and syphilis: global prevalence and incidence estimates, 2016. Bull World Health Organ. 2019;97(8):548–62. doi: 10.2471/BLT.18.228486. [DOI] [PMC free article] [PubMed] [Google Scholar]
- 4.Sánchez-Busó L, Cole MJ, Spiteri G, Day M, Jacobsson S, Golparian D, Sajedi N, Yeats CA, Abudahab K, Underwood A, et al. Europe-wide expansion and eradication of multidrug-resistant Neisseria gonorrhoeae lineages: a genomic surveillance study. Lancet Microbe. 2022;3(6):e452–e63. doi: 10.1016/S2666-5247(22)00044-1. [DOI] [PubMed] [Google Scholar]
- 5.Unemo M, Lahra MM, Escher M, Eremin S, Cole MJ, Galarza P, Ndowa F, Martin I, Dillon JAR, Galas M, et al. WHO global antimicrobial resistance surveillance for Neisseria gonorrhoeae 2017–18: a retrospective observational study. Lancet Microbe. 2021;2(11):e627–e36. doi: 10.1016/S2666-5247(21)00171-3. [DOI] [PubMed] [Google Scholar]
- 6.WHO . Global progress report on HIV, viral hepatitis and sexually transmitted infections, 2021. 2021.
- 7.http://www.nhc.gov.cn/jkj/s3578/202204/4fd88a291d914abf8f7a91f6333567e1.shtml.
- 8.Yuan Q, Li Y, Xiu L, Zhang C, Fu Y, Jiang C, Tang LL, Peng JP. Identification of multidrug-resistant Neisseria gonorrhoeae isolates with combined resistance to both ceftriaxone and azithromycin, China, 2017–2018. Emerging Microbes Infect. 2019;8:1546–9. doi: 10.1080/22221751.2019.1681242. [DOI] [PMC free article] [PubMed] [Google Scholar]
- 9.Aitolo GL, Adeyemi OS, Afolabi BL, Owolabi AO. Neisseria gonorrhoeae antimicrobial resistance: past to present to future. Curr Microbiol. 2021;78(3):867–78. doi: 10.1007/s00284-021-02353-8. [DOI] [PubMed] [Google Scholar]
- 10.Rice PA, Shafer WM, Ram S, Jerse AE. Neisseria gonorrhoeae: drug resistance, mouse models, and vaccine development. Annu Rev Microbiol. 2017;71(1):665–86. doi: 10.1146/annurev-micro-090816-093530. [DOI] [PubMed] [Google Scholar]
- 11.Tian LN, Wang XX, Guo YC, Yang XX, Li YQ, Shi WY, Liu C, Zhang JJ. Analysis of epidemiological characteristics of syphilis and gonorrhea in Fengtai district of Beijing from 2009 to 2020. China Mod Doctor. 2022;59:138–41,49. [Google Scholar]
- 12.He Q, Wang YF, Han ZF, Gan N, Wang G, Zhang H. Analysis on epidemic characteristics and trend of gonorrhea in Shaanxi province from 2010-2019. Clin Res Pract. 2022;7:4. [Google Scholar]
- 13.Zhang P, Cai J, Huang SQ, Wu R, Li MY. Epidemiological characteristics analysis and incidence trend prediction of gonorrhea in Hubei province in 2010-2021. J Public Health Preventive Med. 2022;33:63–6. [Google Scholar]
- 14.Li CS, Yang KF, Wu JC, Zhang YQ, Zhao Z, Xi R, Cai WB. Epidemiological characteristics of gonorrhea in Tengchong city from 2010 to 2021. Dermatol Venereol. 2022;6:476–8. [Google Scholar]
- 15.Chen H, Yang S. Incidence and mortality of gonorrhea in China, 2004–2017. Mod Prev Med. 2022;49:1937–44. [Google Scholar]
- 16.Zhu Z, Zhu X, Zhan Y, Gu L, Chen L, Li X. Development and comparison of predictive models for sexually transmitted diseases-AIDS, gonorrhea, and syphilis in China, 2011-2021. Front Public Health. 2022;10:966813. doi: 10.3389/fpubh.2022.966813. [DOI] [PMC free article] [PubMed] [Google Scholar]
- 17.Feng XY. Epidemiologic characteristics of reported infectious diseases in Y city from 2005 to 2015. Zhejiang University; 2016. [Google Scholar]
- 18.Wang HT. Epidemiological characteristics and risk factors of infectious disease in Shandong province based on medical big data. Shandong University; 2022. [Google Scholar]
- 19.Tacconelli E, Carrara E, Savoldi A, Harbarth S, Mendelson M, Monnet DL, Pulcini C, Kahlmeter G, Kluytmans J, Carmeli Y, et al. Discovery, research, and development of new antibiotics: the WHO priority list of antibiotic-resistant bacteria and tuberculosis. Lancet Infect Dis. 2018;18(3):318–27. doi: 10.1016/S1473-3099(17)30753-3. [DOI] [PubMed] [Google Scholar]
- 20.CDC. Center for Disease Control and Prevention . Sexually transmitted disease surveillance 2018. Atlanta (GA), USA: U.S. Department of Health and Human Services; 2019. [Google Scholar]
- 21.Choudhri Y, Miller J, Sandhu J, Leon A, Aho J. Gonorrhea in Canada, 2010–2015. Can Commun Dis Rep. 2018;44(2):37–42. doi: 10.14745/ccdr.v44i02a01. [DOI] [PMC free article] [PubMed] [Google Scholar]
- 22.Torrone EA, Morrison CS, Chen PL, Kwok C, Francis SC, Hayes RJ, Looker KJ, McCormack S, McGrath N, van de Wijgert JHHM, et al. Prevalence of sexually transmitted infections and bacterial vaginosis among women in sub-Saharan Africa: an individual participant data meta-analysis of 18 HIV prevention studies. PLoS Med. 2018;15(2):e1002511. doi: 10.1371/journal.pmed.1002511. [DOI] [PMC free article] [PubMed] [Google Scholar]
- 23.Lou PF. Economic and financial impact of epidemic situation of COVID-19 and suggestions for response-analysis from the perspective of infectious disease. Southwest Finance . 2020;4:34–43. [Google Scholar]
- 24.Yu L, Wang YH, Wang PJ, Yuan Y, Cao YW, LI SX, Gao YY, Ding GW. Epidemic trend and spatial distribution characteristics of gonorrhea in mainland China from 2014 to 2018. Chin J Dis Control Prev. 2021;25:885–90+954. [Google Scholar]
- 25.Benvenuto D, Giovanetti M, Vassallo L, Angeletti S, Ciccozzi M. Application of the ARIMA model on the COVID-2019 epidemic dataset. Data Brief. 2020;29:105340. doi: 10.1016/j.dib.2020.105340. [DOI] [PMC free article] [PubMed] [Google Scholar]
- 26.de Araújo MLR, Da SGGS. Forecasting daily covid-19 cases in the world with a hybrid ARIMA and neural network model. Appl Software Comput. 2022;126:109315. doi: 10.1016/j.asoc.2022.109315. [DOI] [PMC free article] [PubMed] [Google Scholar]
- 27.Li C, Sampene AK, Agyeman FO, Robert B, Ayisi AL. Forecasting the severity of COVID-19 pandemic amidst the emerging SARS-CoV-2 variants: adoption of ARIMA model. Comput Math Methods Med. 2022;2022:3163854. doi: 10.1155/2022/3163854. [DOI] [PMC free article] [PubMed] [Google Scholar]
- 28.Xu B, Li J, Wang M. Epidemiological and time series analysis on the incidence and death of AIDS and HIV in China. BMC Public Health. 2020;20(1):1906. doi: 10.1186/s12889-020-09977-8. [DOI] [PMC free article] [PubMed] [Google Scholar]
- 29.Rubaihayo J, Tumwesigye NM, Konde-Lule J, Makumbi F. Forecast analysis of any opportunistic infection among HIV positive individuals on antiretroviral therapy in Uganda. BMC Public Health. 2016;16(1):766. doi: 10.1186/s12889-016-3455-5. [DOI] [PMC free article] [PubMed] [Google Scholar]
- 30.http://www.nhc.gov.cn/jkj/s3578/202103/f1a448b7df7d4760976fea6d55834966.shtml.
- 31.Liu W, Yue XG, Tchounwou PB. Response to the COVID-19 epidemic: the Chinese experience and implications for other countries. Int J Environ Res Public Health. 2020;17(7):17. doi: 10.3390/ijerph17072304. [DOI] [PMC free article] [PubMed] [Google Scholar]
- 32.Cheng C, Wan X, Zhang Z. Modeling analysis reveals the transmission trend of COVID-19 and control efficiency of human intervention. BMC Infect Dis. 2021;21(1):849. doi: 10.1186/s12879-021-06560-3. [DOI] [PMC free article] [PubMed] [Google Scholar]
- 33.Yan J, Li Y, Zhou P. Impact of COVID-19 pandemic on the epidemiology of STDs in China: based on the GM (1,1) model. BMC Infect Dis. 2022;22(1):519. doi: 10.1186/s12879-022-07496-y. [DOI] [PMC free article] [PubMed] [Google Scholar]
- 34.Bonett S, Petsis D, Dowshen N, Bauermeister J, Wood SM. The impact of the COVID-19 pandemic on sexually transmitted infection/human immunodeficiency virus testing among adolescents in a large pediatric primary care network. Sex Transm Dis. 2021;48(7):e91–e3. doi: 10.1097/OLQ.0000000000001427. [DOI] [PMC free article] [PubMed] [Google Scholar]
- 35.Crane MA, Popovic A, Stolbach AI, Ghanem KG. Reporting of sexually transmitted infections during the COVID-19 pandemic. Sex Transm Infect. 2021;97(2):101–2. doi: 10.1136/sextrans-2020-054805. [DOI] [PubMed] [Google Scholar]
- 36.Rodríguez I, Hernández Y. Sexually transmitted diseases during the COVID-19 pandemic: a focus on syphilis and gonorrhoea in Cuba. Public Health Pract (Oxf). 2021;2:100072. doi: 10.1016/j.puhip.2020.100072. [DOI] [PMC free article] [PubMed] [Google Scholar]
- 37.Heerfordt IM. Stis during the first and second wave of COVID-19 in Denmark. Sex Transm Infect. 2022;98(2):150–1. doi: 10.1136/sextrans-2021-055021. [DOI] [PubMed] [Google Scholar]


