Abstract
Purpose of Review:
This review discusses the MRI and functional imaging findings in patients with focal seizures, practical ways to improve the detection of subtle lesions, and limitations and pitfalls of the various imaging techniques in this context.
Recent Findings:
A proper MRI investigation of patients with focal epilepsy requires the use of specific protocols, selected based on identification of the region of onset by clinical and EEG information. For practical purposes, the focal epilepsies are divided here into mesial temporal lobe epilepsies and neocortical epilepsies. The majority of patients with mesial temporal lobe epilepsies associated with hippocampal sclerosis undergoing presurgical evaluation will have a clear-cut unilateral atrophic hippocampus with increased T2 signal and a normal-appearing contralateral hippocampus. Among the several types of neocortical lesions, focal cortical dysplasias deserve especial attention because these lesions are often missed on routine MRIs. The focal cortical dysplasias include a gradient of morphologic changes from dysplastic lesions that can be easily identified by conventional MRI techniques to minor structural abnormalities with small areas of discrete cortical thickening and blurring of the gray/white matter interface that often go unrecognized.
Summary:
The use of MRI protocols targeted for the study of patients with epilepsy allows the diagnosis of the etiology of epilepsy in most patients with focal seizures. However, in a considerable number of patients with epilepsy, MRI results are considered normal. Although the etiology remains unclear in these cases, the malformations of cortical development (mainly focal cortical dysplasias) have been identified as most likely pathologic substrates. The effort involved in trying to increase the detection of these “invisible” lesions involves the improvement of structural imaging techniques and the combination of metabolic and functional studies, including 18F-fluorodeoxyglucose–positron emission tomography (18F-FDG-PET), ictal single-photon emission computed tomography (SPECT), diffusion MRI, and magnetic resonance spectroscopy (MRS). The methods used to enhance the detection of subtle cortical abnormalities by improving the structural images have addressed two basic aspects of the examination by MRI: signal acquisition and imaging postprocessing.
INTRODUCTION
Epilepsies feature a variety of etiologies and in most cases are multifactorial.1 Therefore, investigation of the underlying causes of epilepsy will depend on the clinical context, especially the type of syndrome, age, types of seizures, presence or absence of mental retardation, and associated diseases, among other factors. Although the advent of CT introduced unprecedented structural information about diseases that affect the nervous system, no technologic advances were more important for the diagnosis of the etiology of epilepsies than the emergence of MRI.
INDICATIONS
All patients with epilepsy should undergo an MRI except possibly those with very typical forms of primary generalized epilepsy (eg, juvenile myoclonic epilepsy, childhood absence) or benign focal epilepsies of childhood with characteristic clinical and EEG features (eg, benign epilepsy with centrotemporal spikes, early-onset childhood epilepsy with occipital spikes [Panayiotopoulos type]) and adequate response to antiepileptic drugs (AEDs).1,2
There are two basic situations in which to perform neuroimaging in patients with epilepsy. The first applies to newly diagnosed patients and those with long-standing epilepsy that has not been properly investigated. The second applies to patients with intractable epilepsy who are therefore candidates for surgery.2 Even patients with long-term focal epilepsy of unknown etiology should undergo MRI. Low-grade tumors may be found in patients with a history of epilepsy with more than 20 years’ duration.
Priority should be given to patients with focal changes in the neurologic examination. Emergent imaging (CT or MRI) should be performed in patients who have new onset of seizures with focal neurologic deficits, fever, persistent headache, cognitive changes, and a recent history of head trauma. Focal seizures with onset after the age of 40 years should be considered as a possible indication for an emergency neuroimaging examination.
CT
CT has the advantages of being available in most hospitals worldwide and having a relatively low operating cost. In addition, the logistics of CT make it easier for unstable patients to be imaged as compared to MRI. Therefore, this is the ideal imaging examination for emergencies. CT can detect most tumors (except for some low-grade tumors), large arteriovenous and extensive brain malformations, stroke, and infectious lesions, and is sensitive for detection of calcified lesions and bone lesions. CT has low sensitivity for detecting small cortical lesions in general and particularly lesions in the base of the skull, as in the orbitofrontal and medial temporal regions. Small, low-grade gliomas usually are not detected by CT. The overall percentage of success of CT in detecting lesions in focal epilepsies is low, approximately 30%.3
MRI
The extraordinary ability of showing clear differences between gray and white matter and other tissues in the brain in MRI is the main difference between this technique and x-ray imaging modalities, such as CT. MRI has fundamental importance in the diagnosis and treatment of patients with epilepsy. The introduction of MRI led to major improvement in the diagnosis and understanding of different epileptic syndromes. MRI allows the characterization of the nature of the lesion and its behavior over time—that is, whether the lesion is progressive (eg, cancer, Rasmussen encephalitis) or static (eg, ischemic lesions, congenital malformations). Within the context of investigation for surgical treatment, identification of a lesion closely associated with the ictal and interictal EEG abnormalities is associated with a better prognosis of postoperative seizure control.4,5,6
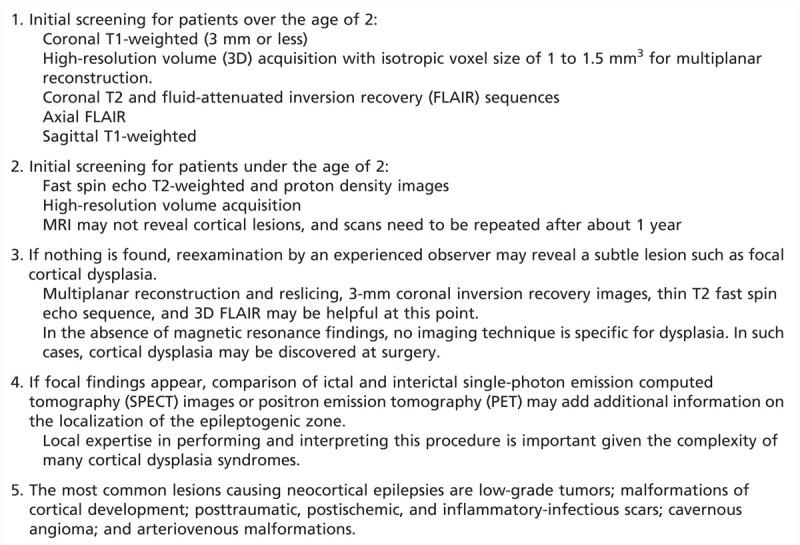
A proper MRI investigation of patients with focal epilepsies requires the use of specific protocols selected based on identification of the region of onset by clinical and EEG findings. For practical purposes, the focal epilepsies can be divided into mesial temporal lobe epilepsies (MTLE) and neocortical epilepsies. This distinction is due to the relative specificity and consistency of clinical, MRI, and pathologic findings (most frequently hippocampal sclerosis) (Figure 3-1 and Figure 3-2) observed in MTLE (Table 3-1, Case 3-1) compared to neocortical epilepsies. The clinical manifestations and EEG changes in neocortical epilepsies are varied, and the pathologic substrate involved in its genesis comprises a broader range of etiologies (Table 3-2).
Figure 3-1.
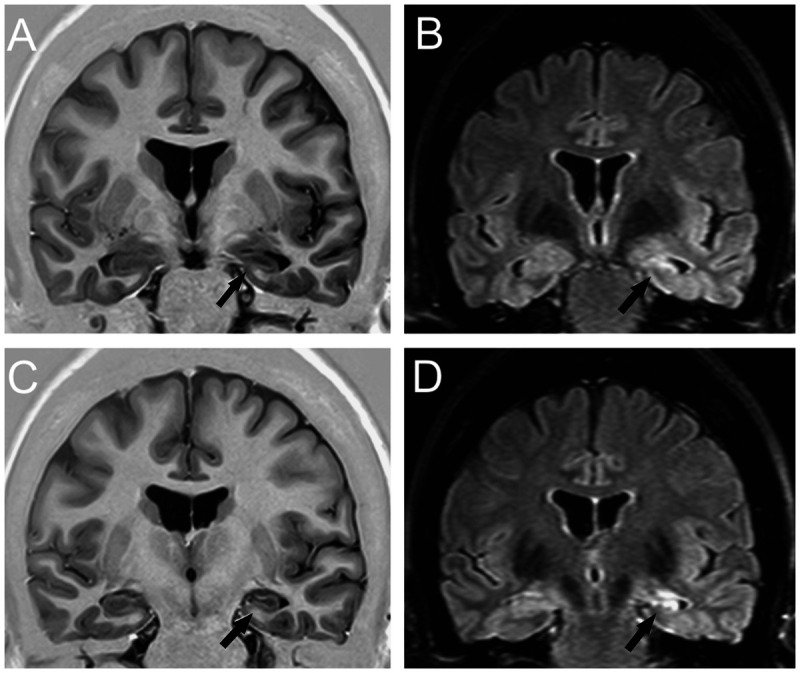
Coronal T1 inversion recovery (A, C) and fluid-attenuated inversion recovery (FLAIR) (B, D) MRIs showing left hippocampal atrophy associated with change in morphology and internal structure and hyperintense FLAIR signal (arrows), all classic signs of hippocampal sclerosis on MRI that were confirmed on postoperative histopathology. Patient with left mesial temporal lobe epilepsy was seizure free after left amygdalohippocampectomy.
Figure 3-2.
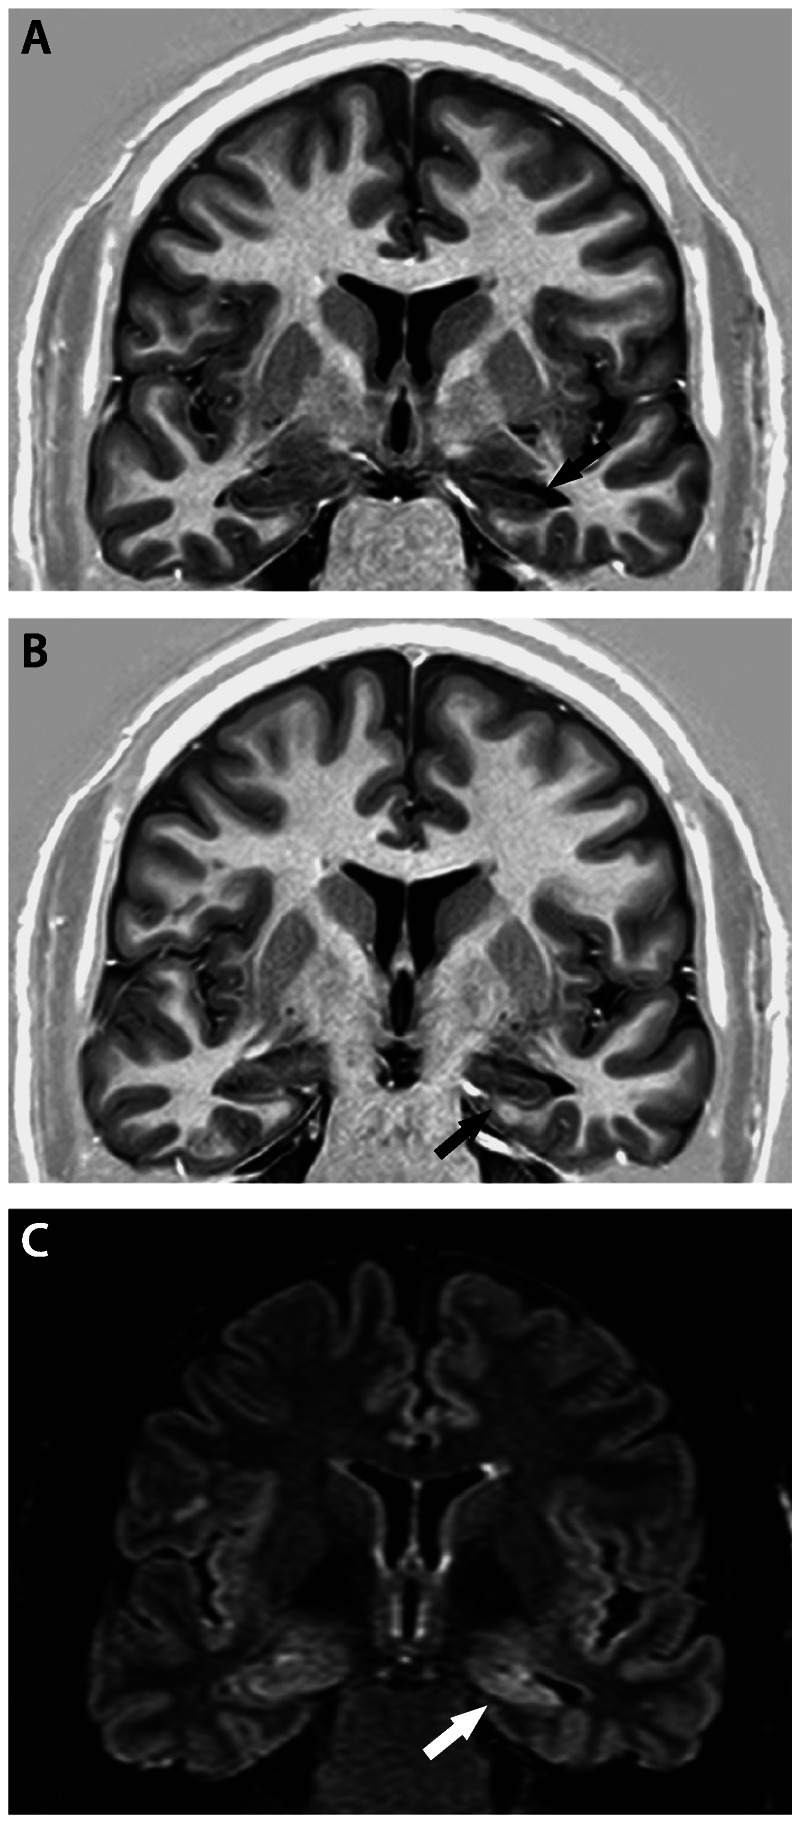
Coronal T1 inversion recovery (A, B) and fluid-attenuated inversion recovery (FLAIR) (C) MRIs showing signs of left hippocampal sclerosis (arrows): hippocampal atrophy and hyperintense signal on FLAIR MRI at the level of hippocampal head. Observe the flattening and inclination of the left hippocampus. Patient with left mesial temporal lobe epilepsy became seizure free after left amygdalohippocampectomy.
TABLE 3-1.
MRI Features of Hippocampal Sclerosis Detectable By Visual Inspection
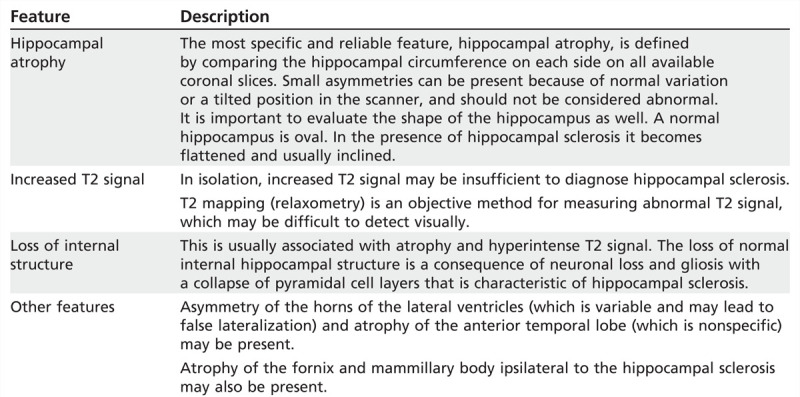
TABLE 3-2.
Imaging Investigation in Patients with Suspected Neocortical Lesions
Case 3-1
A 40-year-old right-handed man presented with focal seizures since 2 years of age. Seizures were controlled with antiepileptic drugs (AEDs) until he was 10 years old, when he began having at least 3 focal seizures per week despite several adequate trials with AEDs; his longest period free of seizures was 3 months. He described his seizures as rising epigastric sensations (sometimes with fear) followed by loss of contact with surroundings, staring, oroalimentary automatisms, and sometimes more complex automatisms such as walking around or taking off his clothes. Rarely, these seizures evolved to secondary generalization. The patient had no history of head trauma, encephalitis, or status epilepticus and no family history of seizures. He complained that his memory had been getting worse over the years.
Routine EEGs showed frequent slow waves and epileptiform sharp waves over both anterior-midtemporal regions with left-side predominance. Five of his habitual seizures were recorded on video-EEG monitoring. All had EEG onset over the left anterior-midtemporal region (maximum at T3) and the first clinical manifestations were coincident with first EEG changes. The patient’s neuropsychological evaluation showed a significant deficit of verbal and nonverbal memory and impairment of verbal fluency tests. His MRI showed signs of left hippocampal sclerosis (Figure 3-1).
He underwent a left anterior temporal lobe resection and had a brief focal seizure on the second day after surgery, after which he remained seizure free on carbamazepine over the next 2 years until itwas discontinued; a fewmonths later he had a generalized seizure and a fewfocal seizures. He was put back on medication and remained seizure free at the last follow-up visit 5 years after surgery.
Comment. This patient had a typical history, semiology, EEG changes, and MRI signs of hippocampal sclerosis. Unfortunately, he spent 30 years with frequent, disabling seizures and was referred for evaluation for surgical treatment only at age 40. Patients with this clinical picture and clear-cut MRI findings of unilateral hippocampal sclerosis should be considered for evaluation for surgery as soon as refractoriness to AEDs is defined.
MRI epilepsy protocols should include a three-dimensional (3D), T1-weighted volumetric acquisition with isotropic voxel size of 1 or 1.5 mm in order to enable the reconstruction of images in any plane.2,7 Studies demonstrated that more sophisticated methods of image reconstruction from 3D acquisitions allow a better evaluation of patients with discrete structural lesions, in particular focal cortical dysplasia (Figure 3-3 and Figure 3-4) where the main findings are cortical thickening, abnormal gyri, and poor delineation of the transition between white and gray matter.7,8,9,10 The 3D images obtained have the characteristics of a volume that can be handled on a computer workstation to serve various purposes. Among the methods for postprocessing and analysis of images with great diagnostic application in epilepsy are the multiplanar (Figure 3-3)11 and curvilinear reconstructions (Figure 3-4).7
Figure 3-3.
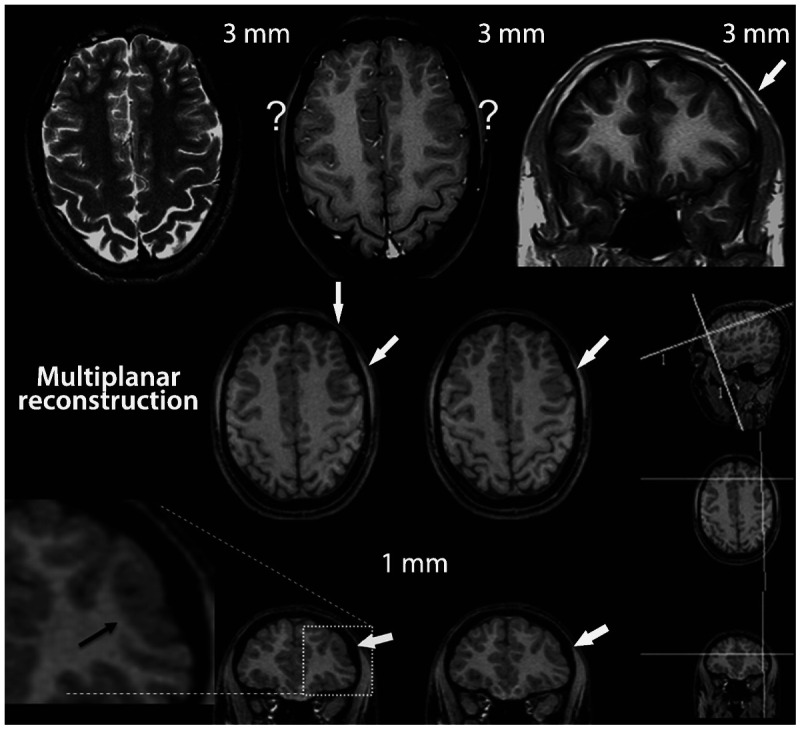
MRI multiplanar reconstruction (MPR) in a patient with frontal lobe seizures due to focal cortical dysplasia who had previous MRIs considered as negative. Top row shows nonvolumetric axial T2-weighted and axial and coronal T1-weighted images with 3-mm thickness. The thicker images (3 mm or more) showed areas with blurring of cortex in both frontal regions, indicated by the question marks. The blurred cortex on the right side is a false thickened cortex due to partial volume effect, whereas the area with blurring on the left frontal lobe is a combination of normal partial volume and an abnormal cortex. This small area of focal cortical dysplasia in the left frontal lobe was better demonstrated in the MPR with 1-mm-thick three-dimensional MRI (arrows). MPR allows for more dynamic analyses of MRI with simultaneous view in different planes and orientation of slices. The three smallest images on the right side of the figure depict the coordinates of angulation and location (the two lines on each small image) of the reconstructed images in the other two orientations.The two lines on the small sagittal image indicate the planes of the coronal and axial reconstructed image and so on (the position and angle of these lines of reconstruction can be changed by the examiner allowing a more dynamic analysis of the image). Note the small area with thickened cortex associated with abnormal gyri and a depression on the overlying surface of the brain (also referred to as cortical dimple) (arrows). The T2-weighted and fluid-attenuated inversion recovery (FLAIR) images (not shown) did not show abnormal signal. These changes are suggestive of focal cortical dysplasia type I or IIA.
Figure 3-4.
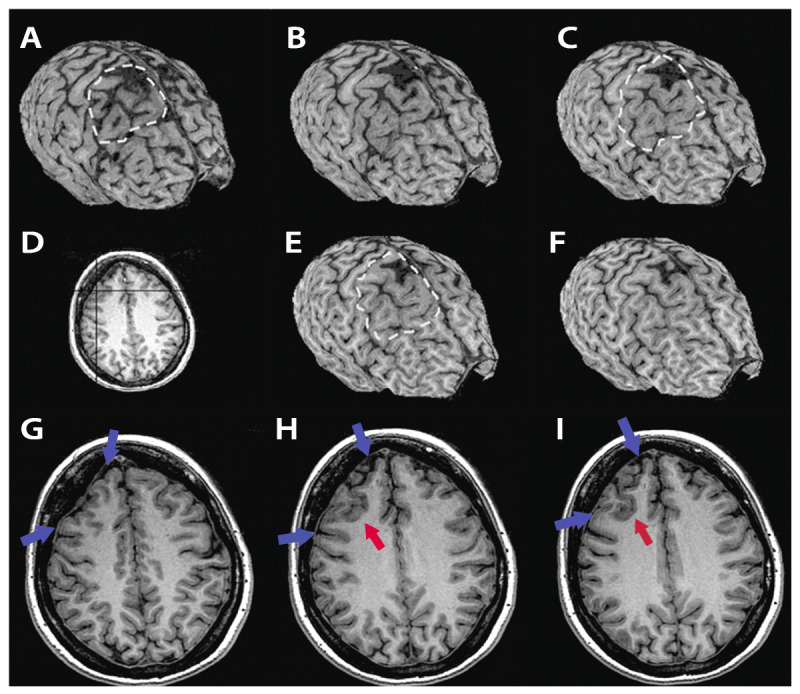
MRI curvilinear reconstruction (A, C, and E) in a patient with frontal lobe seizures and previous MRIs considered as normal. Panel D shows an axial T1-weighted image at the level of the abnormality. Note the area with abnormal gyri (H, I, red arrows), a deep sulcus, and a depression on the overlying surface of the brain (G-I, blue arrows) with increased CSF space that is better observed in the curvilinear reconstructions in the right frontal lobe (A-C, E, F). These abnormalities and the focal cortical-subcortical blurring become obvious in the curvilinear reconstructions in layers going from 4 mm (A) to 12 mm (F) below the surface of the brain. The T2-weighted and fluid-attenuated inversion recovery (FLAIR) images (not shown) did not show abnormal signal. The patient, a 36-year-old woman, underwent a right frontal resection under electrocorticography and has been seizure free for 4 years. Histopathology showed focal cortical dysplasia type IIA.
Multiplanar analysis is the interactive visual evaluation of brain parenchyma, acquired by volumetric MRI. These techniques allow the inspection of details of brain structure through the simultaneous analysis of brain in different planes of section, which is very important for the detection of focal cortical dysplasias (Figure 3-3 and Figure 3-4).
Mesial Temporal Lobe Epilepsy
The acquisitions of MRI in patients with MTLE need to be optimized for evaluating the abnormalities in hippocampal sclerosis. Thin coronal slices, perpendicular to the long axis of hippocampus, are essential. Thin slices (ie, 3 mm or less) allow appreciation of details of the hippocampal anatomy of normal and abnormal hippocampi. T1-weighted MRI with high resolution, particularly with inversion recovery or other sequences with high-contrast resolution between different tissue types, allow the best images for evaluating volume, shape, orientation, and hippocampal internal structure (Figure 3-1 and Figure 3-2). T2-weighted images, using fast spin echo (FSE) sequences and fluid-attenuated inversion recovery (FLAIR), are fundamental for assessment of signal changes (Figure 3-1 and Figure 3-2). FLAIR imaging sequences have shown an accuracy of 97% for detecting abnormalities associated with hippocampal sclerosis defined on histopathology12,13; however, it should be emphasized that FLAIR images may show false abnormal signals in hippocampi.14,15,16 The presence and degree of preoperative MRI signs of hippocampal sclerosis in the ipsilateral and contralateral hippocampus are important for the prognosis of both postoperative seizure control and memory outcome.13,14
Studies demonstrated that MRI volumetry of the hippocampus and amygdala is sensitive and specific in the identification of hippocampal sclerosis in patients with MTLE. However, qualitative visual analysis is also highly sensitive, provided that the images are acquired with an optimized protocol.15,16 Visual discrimination of a normal from an abnormal hippocampus is straightforward when one is clearly normal and the other is clearly abnormal; however, the visual binary paradigm breaks down in the presence of bilateral symmetric or mild unilateral atrophy (Table 3-1).
Presurgical Evaluation of Mesial Temporal Lobe Epilepsy with Hippocampal Sclerosis
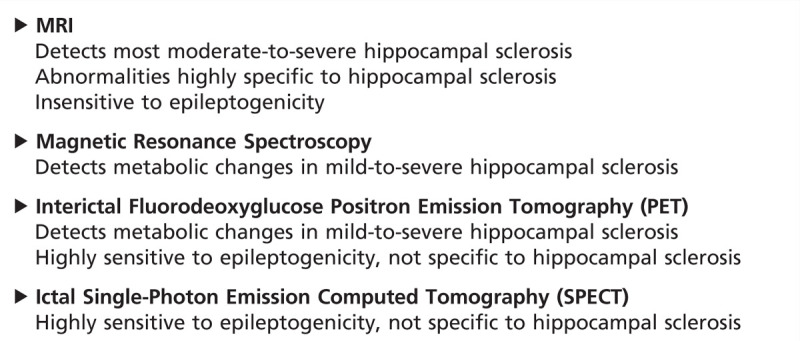
MRI is highly sensitive and specific for detecting hippocampal sclerosis in patients with MTLE (Table 3-3) as well as for in vivo diagnosis of other lesions that cause MTLE, such as tumors, dysplasias, and vascular malformations. Visual MRI interpretation, hippocampal volumetry, and T2 relaxometry areuseful in detecting hippocampal sclerosis.17,18 While MRI is the gold standard for in vivo detection of hippocampal sclerosis, it may fail to detect mild hippocampal sclerosis that may be found on postoperative histopathology. The hippocampal MRI abnormalitiesin patients with hippocampal sclerosis can be bilateral and sometimes symmetric, but usually are unilateral or clearly asymmetric. MRI also shows atrophy and signal changes in structures outside of the hippocampus, usually ipsilateral to the side of hippocampal sclerosis.6
TABLE 3-3.
Imaging of Hippocampal Sclerosis
Epilepsies Due to Neocortical Lesions
In patients with suspected neocortical temporal lobe epilepsy or extratemporal epilepsies, subtle structural lesions can be missed unless MRI is performed with optimal technical quality and expertly interpreted. Correlation with semiology, EEG, and structural and functional imaging data is essential.
The ideal protocol for MRI investigation in patients with epilepsy should be fast and able to provide excellent differentiation of gray and white matter and spatial resolution. Unfortunately, these goals are mutually exclusive because of limitations imposed by basic physical principles of MRI. The sequences should include T1- and T2-weighted images covering the entire brain in the three orthogonal planes, with minimum slice thickness allowed by the scanner. The injection of contrast (eg, gadolinium) is usually unnecessary; however, it may be important in situations when the images without contrast are not sufficient for diagnosis or when a tumoral or inflammatory lesion is suspected. The ideal MRI in patients with focal epilepsy should include a 3D volumetric acquisition with thin sections (ie, less than 2 mm) in order to enable the reconstruction of images in any plane (Table 3-2).8,9,11 Studies have shown that more methods of image reconstruction from 3D acquisitions allow a better evaluation of patients with discrete structural lesions, especially focal cortical dysplasias (Figure 3-3 and Figure 3-4).
The use of appropriate MRI protocols targeted for the study of patients with epilepsy allows the diagnosis of the majority of patients with lesional epilepsies. However, in a considerable number of patients with epilepsy, the MRI is considered normal. Although the etiology remains unclear in these cases, the disorders of cortical development, mainly focal cortical dysplasia, have been identified as the most likely pathologic substrates. The effort involved in trying to increase the detection of these “invisible” lesions involves the improvement of the signal-to-noise ratio and contrast resolution between different tissue types, structural imaging techniques, and imaging postprocessing.8 Among the techniques used to implement the image quality, two methods are highlighted: the use of higher magnetic fields (eg, 3 Tesla or higher) and surface coils.19,20
Malformations of Cortical Development
Focal cortical dysplasias. Refractory epilepsy, particularly in childhood, is often associated with malformations of cortical development, especially focal cortical dysplasia. Many patients have seizures refractory to medication and are candidates for surgical treatment. However, not all patients with malformations of cortical development present with refractory epilepsy.
Focal cortical dysplasia is characterized by disorganization of the cortical lamination associated with bizarre (ie, dysplastic) neurons or cells with eosinophilic cytoplasm and increased volume (ie, balloon cells).21 Focal cortical dysplasia may be observed in MRI examinations as areas of cortical thickening, loss of the interface between white and gray matter, focal atrophy, and hyperintense signal in T2/FLAIR sequences (Figure 3-3, Figure 3-4, and Figure 3-5).
Figure 3-5.
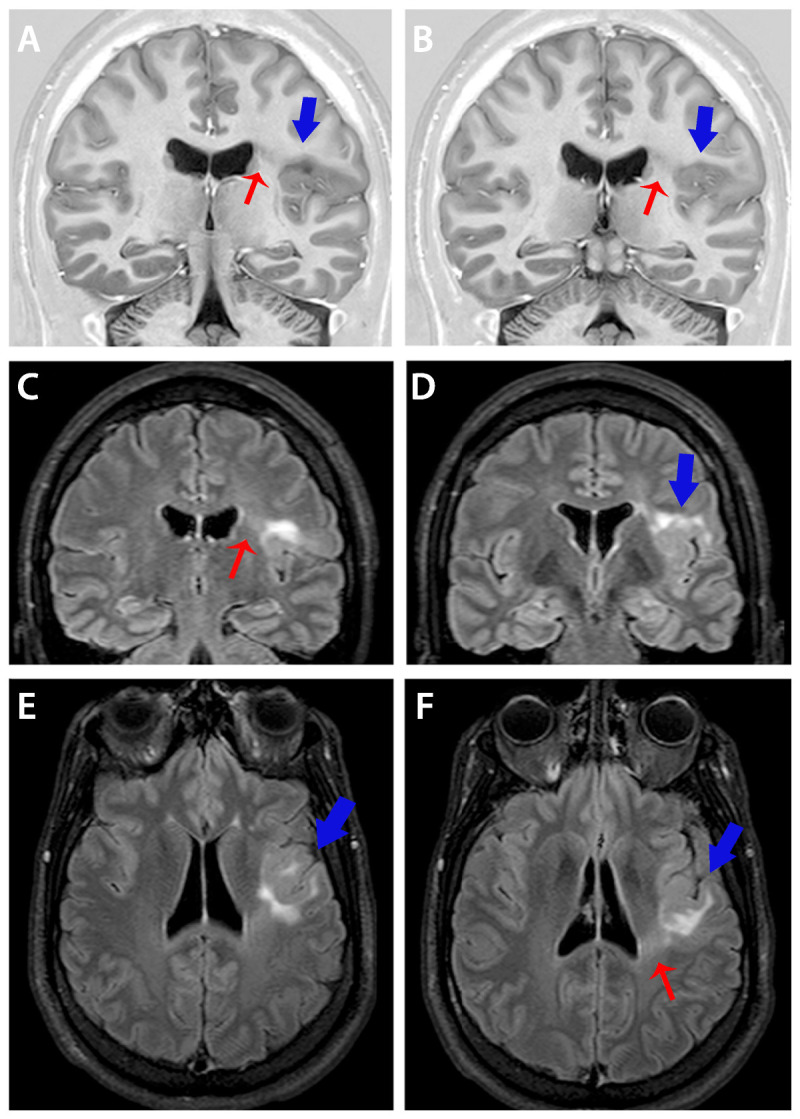
Coronal T1-inversion recovery (A, B) and coronal (E, F) and axial fluid-attenuated inversion recovery (FLAIR) images showing typical changes of focal cortical dysplasia type IIB (arrows). Diagnosis was confirmed in the postoperative histopathology in a patient with refractory focal seizures with temporal-insular semiology. Note area of cortical thickening and loss of sharpness of the cortical-subcortical transition (A, B, D-F, blue arrows) and cortical-subcortical signal changes (increased FLAIR signal and decreased T1 signal) below the area of cortical thickening that extends toward the ventricle (transmantle sign) (A-C, F, red arrows).
In the current classification, focal cortical dysplasias are subdivided into three types: type I (no dysmorphic neurons or balloon cells), type II (presence of dysmorphic neurons with or without balloon cells), and type III (focal cortical dysplasia associated with another lesion)9; these in turn have subdivisions (Table 3-4).
TABLE 3-4.
Summary Classification and MRI Findings of Focal Cortical Dysplasiaa
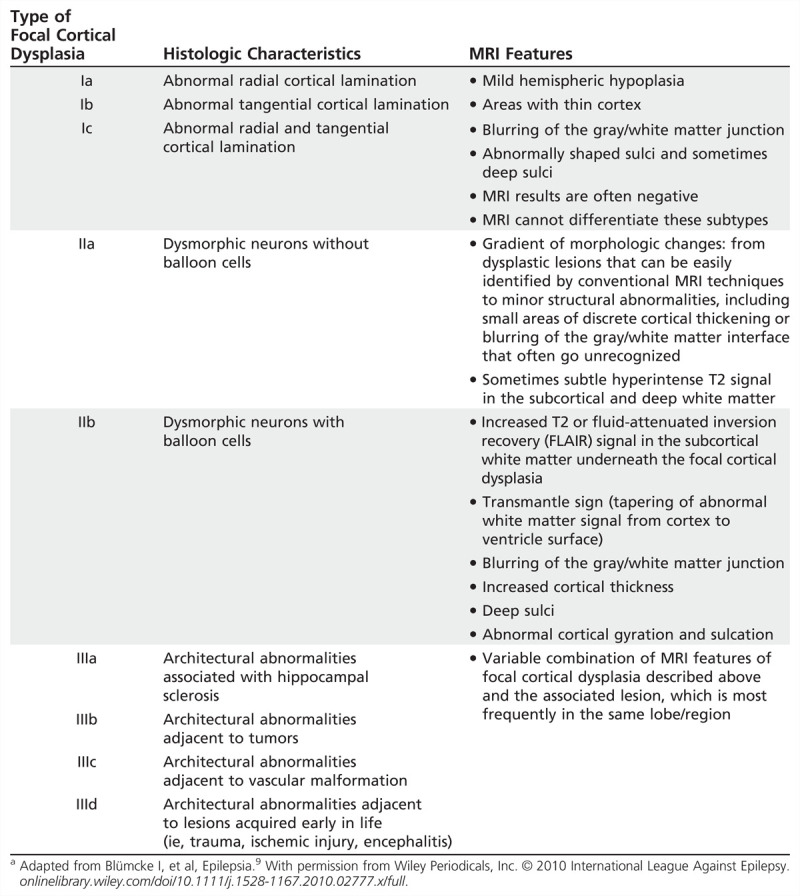
Focal cortical dysplasia type I may present with mild hyperintensity of the white matter in T2/FLAIR with loss of gray/white matter differentiation, but in many patients MRI does not show abnormalities in the white matter. It may present with mild focal increase in cortical thickness and abnormal gyrus in shape and deep sulci, but it may also be associated with focal volume loss and thin cortex, in particular when the temporal lobe is affected.
Focal cortical dysplasia type IIB, or focal cortical dysplasia with balloon cells (which was previously defined as Taylor type dysplasia), is characterized by areas of thickening of the cortex, with the blurring of the differentiation between the gray/white matter interface, and its main feature is hyperintense T2-FLAIR signal in the subcortical white matter with wedge shape that extends to the ipsilateral ventricle ependymal surface (transmantle sign) (Figure 3-5, Table 3-4).9
Other malformations of cortical development associated with epilepsy. Schizencephaly is characterized by a cleft that connects the cortical surface with the ventricular lumen. The cortical tissue is usually abnormal in its edges (polymicrogyria); closed-lip schizencephaly occurs when the edges are juxtaposed, and open-lip schizencephaly when the edges are separated (Figure 3-6).22
Figure 3-6.
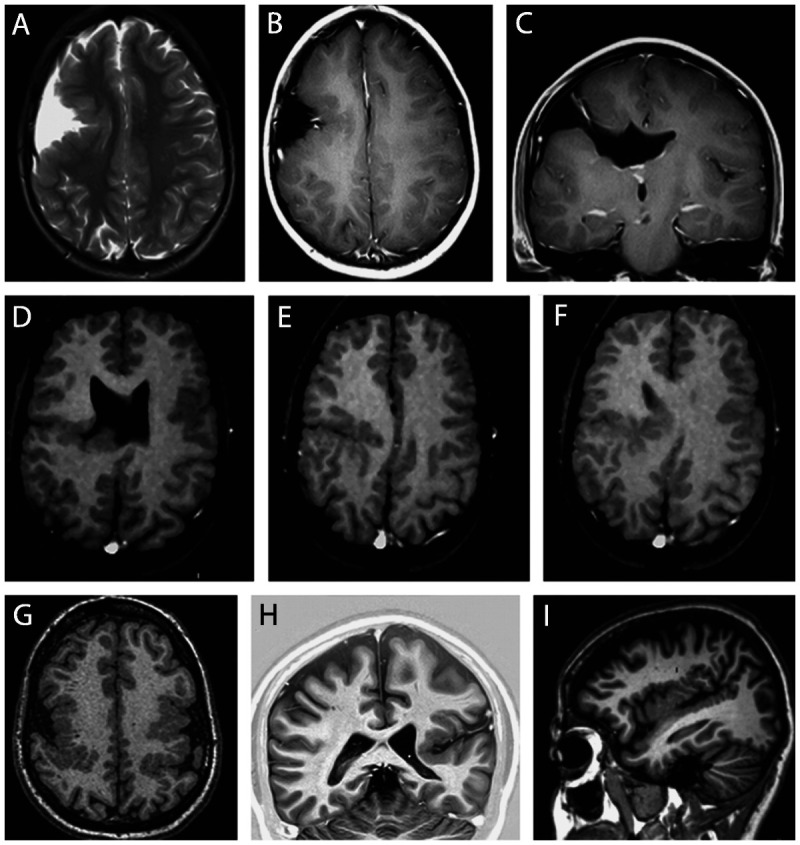
MRI of four different patients illustrating schizencephaly and polymicrogyria. Axial T2- and T1-weighted and coronal T1-weighted MRIs from a patient with open-lip schizencephaly (A–C) and axial T1-weighted images from a patient with closed-lip schizencephaly (D–F); axial T1-weighted image from a patient with bilateral polymicrogyria (G) and coronal and sagittal T1-weighted image from a patient with left unilateral polymicrogyria (H, I).
Polymicrogyria is characterized by developmental abnormalities where neurons reach the cerebral cortex during development but are distributed abnormally, resulting in abnormal small gyri that may appear as thickened cortex if the MRI is acquired with low resolution and thick cuts (Figure 3-6).22
Periventricular nodular heterotopia is characterized by clusters of ectopic neurons and can be located at the periventricular areas (subependymal). These nodules consist of mature neurons and glia cells without well-defined lamellar organization (Figure 3-7). Subcortical nodular heterotopia is characterized by nodules of ectopic gray matter that vary in number and size, sometimes in the posterior peritrigonal region (vascular border zone), and may extend toward the white matter, compromising the adjacent neocortex.23 Subcortical laminar heterotopia (double cortex) is characterized by a continuous or semicontinuous ectopic band of gray matter below the cortical mantle (Figure 3-7).9
Figure 3-7.
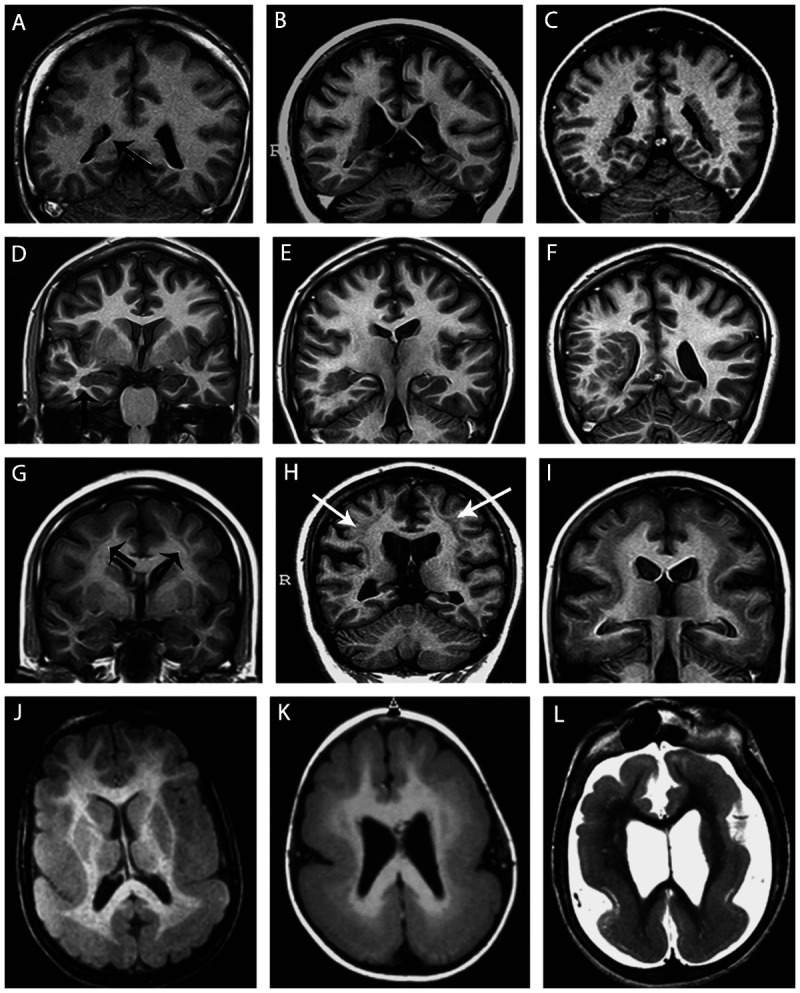
Unilateral periventricular nodular heterotopia (A, arrow) with polymicrogyria in the adjacent cortex; two patients with bilateral periventricular nodular heterotopia (B, C); a patient with periventricular nodular heterotopia in the right temporal horn of the ventricle (D, arrow) and a large subcortical heterotopia extending to the posterior quadrant of the brain (E, F); three patients with different thickness of subcortical laminar heterotopia (double cortex), from thin and discontinuous bands (G, arrows) to continuous bands (H, arrows, I); three patients with different degrees of lissencephaly-agyria-pachygyria complex, from pachygyria (J), posterior agyria and anterior pachygyria (K), and diffuse lissencephaly (L).
Lissencephaly-agyria-pachygyria and subcortical laminar heterotopia represent extremes in the spectrum of the same entity. In lissencephaly-agyria-pachygyria the brain has a limited number of gyri and sulci, resulting in shallow sulci and large gyri with thickened cortex or an almost complete absence of sulci in lissencephaly (Figure 3-7).22
Hemimegalencephaly is characterized by hamartomatous growth of part of or the entire cerebral hemisphere. This is visualized on MRI as hemispheric enlargement, often associated with ipsilateral ventricular dilatation and clearly abnormal signal in the white matter (hyperintense in T2/FLAIR and hypointense in T1-weighted images) (Figure 3-8). In addition, there are often areas of pachygyria, polymicrogyria, heterotopia, focal cortical dysplasia, and gliosis of the underlying white matter.22
Figure 3-8.
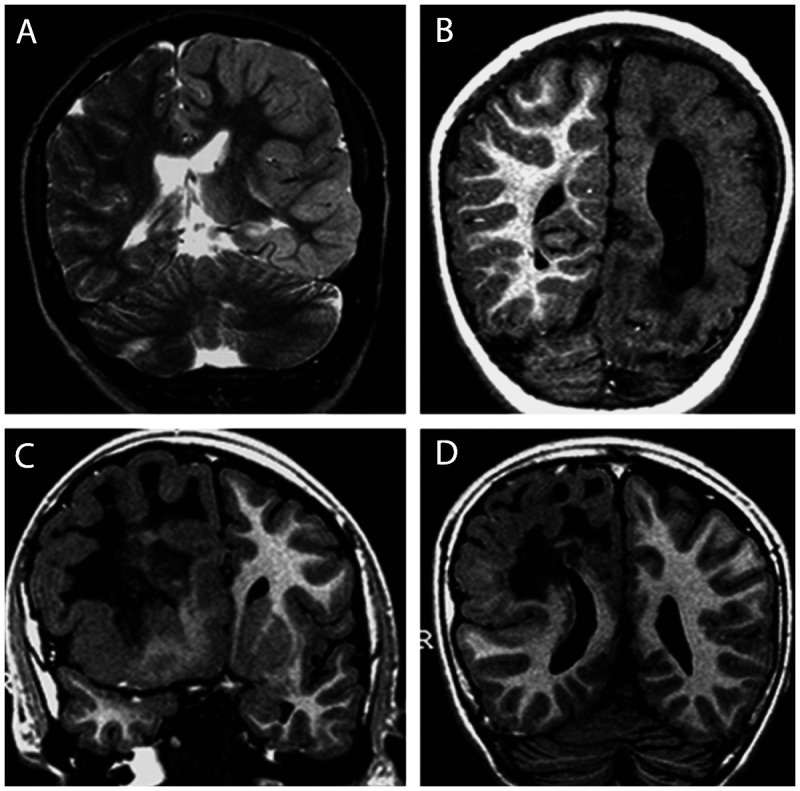
Two patients with left (A, B) and one patient with right (C, D) hemimegalencephaly. Note the abnormal signal in the white matter, which is brighter on T2 (A) and darker on T1-weighted images (B–D) of the affected hemisphere in all patients and variable degrees of pachygyria and hemispheric enlargement. Periventricular nodular heterotopia is present in panel D.
Tuberous Sclerosis
The cortical hamartomas or “tubers” are the most characteristic lesions in tuberous sclerosis complex and may be related to focal seizures, often refractory to AEDs; however, not all tubers are necessarily epileptogenic. Cortical hamartomas on CT appear as dark lesions with broadened gyri in young children; the lesions became progressively less dark with age, and these tubers may be difficult to identify on CT in adults unless the tubers are calcified. The MRI appearance of tubers also changes with myelination. In neonates they are hyperintense on T1-weighted images and hypointense on T2-weighted images compared to the surrounding white matter. In older children they are hyperintense on T2-weighted images, with poorly defined borders (Figure 3-9).22
Figure 3-9.
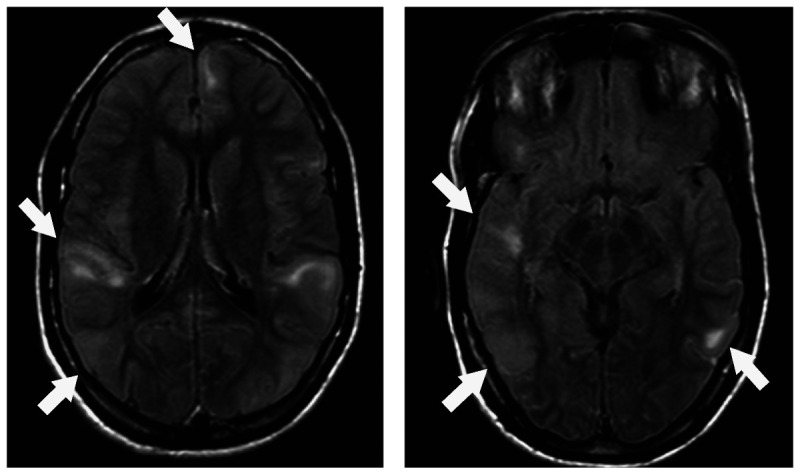
T2-weighted axial MRIs showing multiple cortical tubers (arrows) in a patient with tuberous sclerosis and epilepsy.
Low-Grade Tumors
Gangliogliomas (Figure 3-10), oligodendrogliomas (Figure 3-11), and dysembryoplastic neuroepithelial tumors are frequently located in the temporal lobe and may be associated with focal cortical dysplasia (Figure 3-12), and their most common clinical manifestation is epilepsy.
Figure 3-10.

Coronal MRIs showing ganglioglioma in three patients with temporal lobe epilepsy and seizures not responding to antiepileptic drugs who became seizure free after surgical resection of the lesion. A,T2-weighted image showing a ganglioglioma in the left amygdala. B, T1-inversion recovery image showing a small ganglioglioma in the right collateral sulcus (arrow) that was previously missed in an MRI without thin coronal cuts. C, T2-weighted image showing a ganglioglioma in the left uncal region with a cystic component (arrow). Gangliogliomas usually have clear limits and are hypointense on T1 (not shown in this figure) and hyperintense on T2-weighted images. The contrast enhancement is variable from absent to intense, and may present with an annular (ring-enhancing) pattern. Gangliogliomas should be considered when a poorly defined, slightly enhancing mass is present in the temporal lobes.
Figure 3-11.
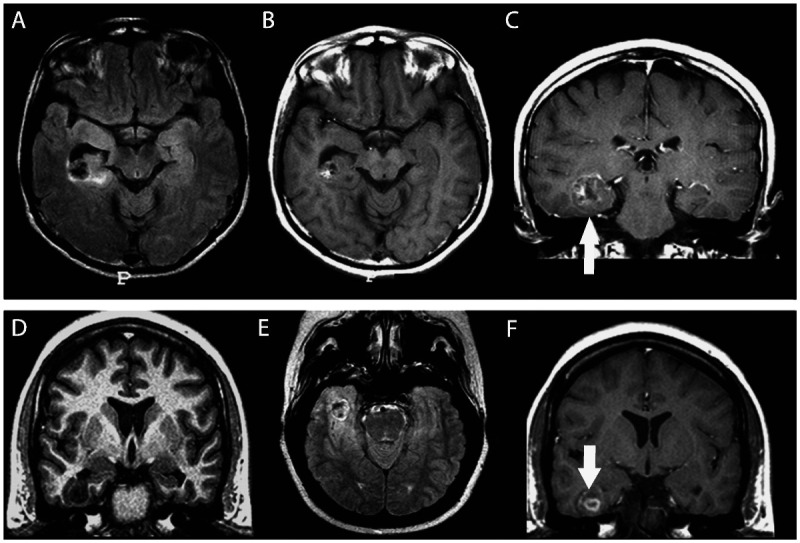
Two patients with temporal lobe epilepsy due to oligodendroglioma, one in the right temporal horn of the ventricle adjacent to the hippocampus (A–C) and the other (D–F) in the right inferior temporal gyrus. Oligodendrogliomas are nonspecifically hypointense on T1-weighted (D) and hyperintense on T2-weighted or fluid-attenuated inversion recovery (FLAIR) images (A, E). Occasionally, foci of increased signal on T1-weighted images (B) reflect intratumoral hemorrhage. Enhancement on CT or MRI is variable (C, F, arrows). On CT, calcifications are expected and may be shell-like, ringlike, or nodular.
Figure 3-12.
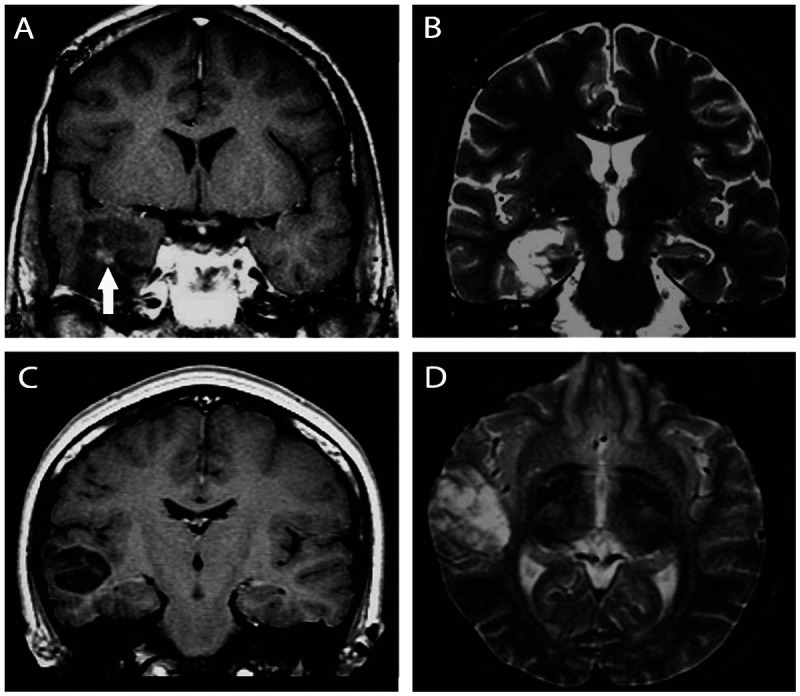
Images illustrating dysembryoplastic neuroepithelial tumors. A, B, T1 postgadolinium and T2-weighted images showing a dysembryoplastic neuroepithelial tumor associated with focal cortical dysplasia (confirmed in the postoperative histopathology) in the right temporal lobe in a 23-year-old man with refractory focal seizures since the age of 9. The patient became seizure free after lesionectomy. C, D, Coronal T1 and axial T2-weighted images showing a dysembryoplastic neuroepithelial tumor in the right temporal lobe of a 26-year-old woman experiencing seizures since childhood. She became seizure free after lesionectomy. Dysembryoplastic neuroepithelial tumors are hypodense in CT scan and may show calcifications. Close to one-third of the cases show contrast enhancement. In MRI the lesion is often limited to the cortex and is hypointense on T1 (A, C) and hyperintense on T2 sequences (B, D). There is no peritumoral edema or mass effect; variable contrast enhancement may be present (A, arrow).
The differential diagnosis of these low-grade tumors in adult patients includes other types of gliomas, in particular astrocytoma. In children, astrocytoma, ganglioglioma, gangliocytoma, neuroblastoma, and other primitive neuroectodermal tumors may have similar MRI findings.24
Rasmussen Encephalitis
MRI in Rasmussen encephalitis shows progressive atrophy of one of the cerebral hemispheres, usually beginning in the opercular region (ie, the part ofthe cerebral cortex that covers the insula). Many times the cortex presents hyperintense signal on T2 and FLAIR sequences.
DIFFUSION TENSOR IMAGING AND TRACTOGRAPHY
Diffusion tensor imaging (DTI) data provide information regarding the direction of the diffusion of water in each voxel, which can be used to estimate the orientation of white matter tracts. Based on this information, it is possible to trace major myelinated tracts (tractography) offering additional information for surgical approach; for example, it can be used for visualization of the optic radiation and for predicting visual field deficits after surgery.25 In addition, DTI allows obtaining other quantitative data (such as fractional anisotropy and diffusivity and connectivity indices) that can indicate integrity or subtle lesions of white matter, which have research applications.26 DTI clinical applications for epilepsy, although promising, are still limited.
MAGNETIC RESONANCE SPECTROSCOPY
Proton–magnetic resonance spectroscopy (proton-MRS) assesses neuronal integrity by quantifying the peak of N-acetylaspartate (NAA), a marker of neuronal integrity, usually by comparing its concentrations with choline or creatine peaks. Unlike MRI, single-photon emission computed tomography (SPECT), and positron emission tomography (PET) techniques, the entire brain is not covered by MRS examinations and usually only a few large voxels are included in proton-MRS.26,27,28 The poor signal-to-noise ratio of proton-MRS is a technical limitation for acquisitions including small volumes of tissue. In addition, the relatively long time for spectra acquisitions makes the quantification of spectra in many voxels impractical.
Comparisons with the EEG localization and surgical results have demonstrated that the reduced signal intensity of NAA can lateralize and localize the epileptogenic focus in patients with focal epilepsies, especially MTLE. However, these changes are often bilateral in patients with MTLE.26,27,28 Moreover, the relative concentration of NAA can normalize after successful surgery for MTLE.27 NAA appears to be a dynamic marker of epileptogenic activity as well as a marker of neuronal density; therefore, NAA abnormalities should be interpreted with caution.27
The major limitation of MRS is its limited coverage area, which in current practice undermines the evaluation of patients with neocortical epilepsy without a strong suspicion of the location of the epileptogenic focus or lesion on MRI.27,28 Future improvements in technology may allow multislice or 3D proton-MRS acquisitions with whole-brain coverage, with good spatial resolutions.
POSITRON EMISSION TOMOGRAPHY
PET images using 18F-fluorodeoxyglucose (18F-FDG) may demonstrate a focal or regional hypometabolism within the epileptogenic area, especially in MTLE.26,29 This hypometabolic area can extend beyond the epileptogenic zone defined by EEG, or beyond the area of structural damage. This hypometabolism may represent deafferentation or neuronal dysfunction, and can “recover” after a successful surgery.29,30
In clinical practice, the additional yield of 18F-FDG-PET in patients with MTLE and clear video-EEG and MRI findings is modest, and in most of these cases it may be considered unnecessary.29 However, for patients with inconclusive video-EEG and MRI results, 18F-FDG-PET is extremely helpful for presurgical evaluation; it provides a correct detection of temporal lobe foci in 66% of these cases, as confirmed by depth-EEG studies.30,31
The focal hypometabolism has been useful in predicting seizure control after surgery for MTLE, as the greater severity of the hypometabolism (defined either by quantitative or qualitative methods) correlates with better postoperative seizure outcome.32,33
An extratemporal epileptogenic focus presents a hypometabolism by 18F-FDG-PET less frequently.26 However, some patients with infantile spasms may have a regional hypometabolism that can help in the decision for a surgical treatment.29
A cost-comparison study showed that the combination of EEG and MRI as screening tests, without addition of PET, is the most cost-effective screening approach for presurgical investigation of epilepsies.34
SINGLE-PHOTON EMISSION COMPUTED TOMOGRAPHY
SPECT examinations for the study of interictal cerebral blood flow have low accuracy and are of little utility.26 By contrast, SPECT studies during a seizure using the radiotracer hexamethylpropylene amine oxime (HMPAO)–99mTc or ethyl cysteinate dimer (ECD)–99mTc can identify both temporal and extratemporal epileptogenic foci, as long as the radiopharmaceutical is injected as soon as possible after the onset of the seizure during video-EEG monitoring.26,35 Therefore, interictal SPECT is only indicated for the comparison or subtraction from an ictal examination.
The ictal SPECT is most effective for MTLE patients, with a sensitivity and specificity between 80% and 97% if the radiotracer is injected soon after the seizure onset. In extratemporal epilepsies, ictal SPECT is much less effective and varies with the pathologic substrate and the affected region. In seizures with rapid spread (eg, frontal lobe seizures) the major limitation is the time required to inject the radiopharmaceutical.26,35
It is important to remember that temporal resolution of SPECT is poor; images reflect what brain perfusion was approximately 10 seconds after injection. Therefore, SPECT is not indicated for seizures less than 15 seconds in duration.
To improve the spatial resolution, functional images can be subtracted (eg, ictal SPECT minus interictal SPECT) and coregistered (eg, the subtracted ictal-interictal SPECT, or a PET image) with a high-resolution anatomical MRI.26,35 All functional images must be interpreted in the context of all clinical and laboratory data.
KEY POINTS
CT scans are indicated in emergent situations but are of limited usefulness for limited or small lesions, particularly in regions of orbitofrontal or medial temporal cortex. Focal lesions are only seen in 30%.
A proper MRI investigation of patients with focal epilepsies requires the use of specific protocols selected based on identification of the region of onset by clinical and EEG findings.
MRI epilepsy protocols should include a three-dimensional, T1-weighted volumetric acquisition with isotropic voxel size of 1 or 1.5 mm in order to enable the reconstruction of images in any plane.
Methods of image reconstruction from three-dimensional acquisitions allow a better evaluation of patients with discrete structural lesions, in particular focal cortical dysplasia where the main findings are cortical thickening, abnormal gyri, and poor delineation of the transition between white and gray matter.
The hippocampal MRI abnormalities in patients with hippocampal sclerosis can be bilateral and sometimes symmetric, but usually are unilateral or with clear asymmetry. MRI also shows atrophy and signal changes in structures outside of the hippocampus, usually ipsilateral to the side of hippocampal sclerosis.
MRI sequences should include T1- and T2-weighted images covering the entire brain in the three orthogonal planes, with minimum slice thickness allowed by the scanner. The injection of contrast is usually unnecessary; however, it may be important in situations when the images without contrast are not sufficient for diagnosis or when a tumoral or inflammatory lesion is suspected.
The use of appropriate MRI protocols targeted for the study of patients with epilepsy allows the diagnosis of the majority of patients with lesional epilepsies. However, in a considerable number of patients with epilepsy, the MRI is considered normal. Although the etiology remains unclear in these cases, the disorders of cortical development, mainly focal cortical dysplasia, have been identified as the most likely pathologic substrates.
Focal cortical dysplasia may be observed in MRI examinations as areas of cortical thickening, loss of the interface between white and gray matter, focal atrophy, and hyperintense signal in T2/fluid-attenuated inversion recovery (FLAIR) sequences.
Gangliogliomas, oligodendrogliomas, and dysembryoplastic neuroepithelial tumors are frequently located in the temporal lobe and may be associated with focal cortical dysplasia, and their most common clinical manifestation is epilepsy.
N-acetylaspartate appears to be a dynamic marker of epileptogenic activity as well as a marker of neuronal density; therefore, N-acetylaspartate abnormalities should be interpreted with caution.
The major limitation of magnetic resonance spectroscopy is its limited coverage area, which in current practice undermines the evaluation of patients with neocortical epilepsy without a strong suspicion of the location of the epileptogenic focus or lesion on MRI.
PET images using 18F-fluorodeoxyglucose may demonstrate a focal or regional hypometabolism within the epileptogenic area, especially in mesial temporal lobe epilepsy. This hypometabolic area can extend beyond the epileptogenic zone defined by EEG, or beyond the area of structural damage.
In clinical practice, the additional yield of fluorodeoxyglucose-PET in patients with mesial temporal lobe epilepsy and clear video-EEG and MRI findings is modest, and in most of these cases it may be considered unnecessary. However, for patients with inconclusive video-EEG and MRI results, 18F-fluorodeoxyglucose-PET is extremely helpful.
SPECT examinations for the study of interictal cerebral blood flow have low accuracy and are of little utility. By contrast, SPECT studies during a seizure using the radiotracer HMPAO-99mTc or ECD-99mTc can identify both temporal and extratemporal epileptogenic foci, as long as the radiopharmaceutical is injected as soon as possible after the onset of the seizure during video-EEG monitoring.
To improve the spatial resolution, functional images can be subtracted (eg, ictal SPECT minus interictal SPECT) and coregistered (eg, the subtracted ictal-interictal SPECT, or a PET image) with a high-resolution anatomical MRI. All functional images must be interpreted in the context of all clinical and laboratory data.
Footnotes
Relationship Disclosure: Dr Cendes is a member of the editorial boards of Neurology, Epilepsy Research, Epilepsia, Epilepsy and Behavior, Arquivos de Neuropsiquiatria, and Frontiers in Neurology. Dr Cendes receives research support from Fundação de Amparo à Pesquisa do Estado de São Paulo (FAPESP) and Conselho Nacional de Pesquisa (CNPq) Brazil. Dr Cendes is chair of the Diagnostic Methods Commission of the International League Against Epilepsy.
Unlabeled Use of Products/Investigational Use Disclosure: Dr Cendes reports no disclosures.
REFERENCES
- 1.Berg AT,, Berkovic SF,, Brodie MJ, et al. Revised terminology and concepts for organization of seizures and epilepsies: Report of the ILAE Commission on Classification and Terminology, 2005–2009. Epilepsia 2010; 51 (4): 676–685. [DOI] [PubMed] [Google Scholar]
- 2.Recommendations for neuroimaging of patients with epilepsy. Commission on Neuroimaging of the International League Against Epilepsy. Epilepsia 1997; 38 (11): 1255–1256. [DOI] [PubMed] [Google Scholar]
- 3.Bronen RA,, Fulbright RK,, Spencer DD, et al. Refractory epilepsy: comparison of MR imaging, CT, and histopathologic findings in 117 patients. Radiology 1996; 201 (1): 97–105. [DOI] [PubMed] [Google Scholar]
- 4.Berg AT,, Mathern GW,, Bronen RA, et al. Frequency, prognosis and surgical treatment of structural abnormalities seen with magnetic resonance imaging in childhood epilepsy. Brain 2009; 132 (pt 10): 2785–27 97. [DOI] [PMC free article] [PubMed] [Google Scholar]
- 5.Téllez-Zenteno JF,, Hernández Ronquillo L,, Moien-Afshari F, et al. Surgical outcomes in lesional and non-lesional epilepsy: a systematic review and meta-analysis. Epilepsy Res 2010; 89 (2–3): 310–318. [DOI] [PubMed] [Google Scholar]
- 6.Cascino GD. Advances in neuroimaging: surgical localization. Epilepsia 2001; 42 (1): 3–12. [DOI] [PubMed] [Google Scholar]
- 7.Bastos AC,, Comeau R,, Andermann F, et al. Diagnosis of subtle focal dysplastic lesions: curvilinear multiplanar reformatting from three dimensional magnetic resonance imaging. Ann Neurol 1999; 46: 88–94. [DOI] [PubMed] [Google Scholar]
- 8.Bernasconi A,, Bernasconi N,, Bernhardt BC, et al. Advances in MRI for ‘cryptogenic’ epilepsies. Nat Rev Neurol 2011; 7 (2): 99–108. [DOI] [PubMed] [Google Scholar]
- 9.Blümcke I,, Thom M,, Aronica E, et al. The clinicopathologic spectrum of focal cortical dysplasias: a consensus classification proposed by an ad hoc Task Force of the ILAE Diagnostic Methods Commission. Epilepsia 2011; 52 (1): 158–74. [DOI] [PMC free article] [PubMed] [Google Scholar]
- 10.Colombo N,, Salamon N,, Raybaud C, et al. Imaging of malformations of cortical development. Epileptic Disord 2009; 11 (3): 194–205. [DOI] [PubMed] [Google Scholar]
- 11.Barkovich AJ,, Rowley HA,, Andermann F. MR in partial epilepsy: value of high-resolution volumetric techniques. AJNR Am J Neuroradiol 1995; 16 (2): 339–343. [PMC free article] [PubMed] [Google Scholar]
- 12.Kuzniecky RI,, Bilir E,, Gilliam F, et al. Multimodality MRI in mesial temporal sclerosis: relative sensitivity and specificity. Neurology 1997; 49 (3): 774–778. [DOI] [PubMed] [Google Scholar]
- 13.Arruda F,, Cendes F,, Andermann F, et al. Mesial atrophy and outcome after amygdalohippocampectomy or temporal lobe removal. Ann Neurol 1996; 40 (3): 446–450. [DOI] [PubMed] [Google Scholar]
- 14.Yasuda CL,, Cendes F. Neuroimaging for the prediction of response to medical and surgical treatment in epilepsy. Expert Opin Med Diagn 2012; 6: 295–308. [DOI] [PubMed] [Google Scholar]
- 15.Labate A,, Gambardella A,, Aguglia U, et al. Temporal lobe abnormalities on brain MRI in healthy volunteers: a prospective case-control study. Neurology 2010; 74 (7): 553–557. [DOI] [PubMed] [Google Scholar]
- 16.Cendes F,, Cascino GD. MRI signs of hippocampal sclerosis seen in healthy volunteers: what is the clinical relevance? Neurology 2010; 74 (7): 534–535. [DOI] [PubMed] [Google Scholar]
- 17.Jackson GD,, Connelly A. New NMR measurements in epilepsy. T2 relaxometry and magnetic resonance spectroscopy. Adv Neurol 1999; 79: 931–937. [PubMed] [Google Scholar]
- 18.Van Paesschen W,, Revesz T,, Duncan JS, et al. Quantitative neuropathology and quantitative magnetic resonance imaging of the hippocampus in temporal lobe epilepsy. Ann Neurol 1997; 42 (5): 756–766. [DOI] [PubMed] [Google Scholar]
- 19.Knake S,, Triantafyllou C,, Wald LL, et al. 3T phased array MRI improves the presurgical evaluation in focal epilepsies: a prospective study. Neurology 2005; 65 (7): 1026–1031. [DOI] [PubMed] [Google Scholar]
- 20.Zijlmans M,, de Kort GA,, Witkamp TD, et al. 3T versus 1.5T phased-array MRI in the presurgical work-up of patients with partial epilepsy of uncertain focus. J Magn Reson Imaging 2009; 30 (2): 256–262. [DOI] [PubMed] [Google Scholar]
- 21.Taylor DC,, Falconer MA,, Bruton CJ, et al. Focal dysplasia of the cerebral cortex in epilepsy. J Neurol Neurosurg Psychiatry 1971; 34 (4): 369–387. [DOI] [PMC free article] [PubMed] [Google Scholar]
- 22.Barkovich AJ,, Guerrini R,, Kuzniecky RI, et al. A developmental and genetic classification for malformations of cortical development: update 2012. Brain. 2012; 135 (pt 5): 1348–1369. [DOI] [PMC free article] [PubMed] [Google Scholar]
- 23.Pisano T,, Barkovich AJ,, Leventer RJ, et al. Peritrigonal and temporo-occipital heterotopia with corpus callosum and cerebellar dysgenesis. Neurology 2012; 79 (12): 1244–1251. [DOI] [PMC free article] [PubMed] [Google Scholar]
- 24.Osborn AG,, Salzman KL,, Barkovich AJ, editors. Diagnostic imaging: brain. 2nd ed. Philadelphia, PA; Amirsys/Lippincott Williams and Wilkins, 2010. [Google Scholar]
- 25.Winston GP,, Yogarajah M,, Symms MR, et al. Diffusion tensor imaging tractography to visualize the relationship of the optic radiation to epileptogenic lesions prior to neurosurgery. Epilepsia 2011; 52 (8): 1430–1438. [DOI] [PMC free article] [PubMed] [Google Scholar]
- 26.Duncan JS. Imaging in the surgical treatment of epilepsy. Nat Rev Neurol 2010; 6 (10): 537–550. [DOI] [PubMed] [Google Scholar]
- 27.Cendes F,, Knowlton RC,, Novotny E, et al. Magnetic resonance spectroscopy in epilepsy: clinical issues. Epilepsia 2002; 43 (suppl 1): 32–39. [Google Scholar]
- 28.Willmann O,, Wennberg R,, May T, et al. The role of 1H magnetic resonance spectroscopy in pre-operative evaluation for epilepsy surgery. A meta-analysis. Epilepsy Res 2006; 71 (2–3): 149–158. [DOI] [PubMed] [Google Scholar]
- 29.Juhász C. The impact of positron emission tomography imaging on the clinical management of patients with epilepsy. Expert Rev Neurother 2012; 12 (6): 719–732. [DOI] [PubMed] [Google Scholar]
- 30.Casse R,, Rowe CC,, Newton M, et al. Positron emission tomography and epilepsy. Mol. Imaging Biol 2002; 4 (5): 338–351. [DOI] [PubMed] [Google Scholar]
- 31.Uijl SG,, Leijten FS,, Arends JB, et al. The added value of [18F]-fluoro-d-deoxyglucose positron emission tomography in screening for temporal lobe epilepsy surgery. Epilepsia 2007; 48 (11): 2121–2129. [DOI] [PubMed] [Google Scholar]
- 32.DellaBadia J, Jr,, Bell WL,, Keyes JW, Jr, et al. Assessment and cost comparison of sleep-deprived EEG, MRI and PET in the prediction of surgical treatment for epilepsy. Seizure 2002; 11 (5): 303–309. [DOI] [PubMed] [Google Scholar]
- 33.Knowlton RC,, Elgavish RA,, Bartolucci A, et al. Functional imaging: II. Prediction of epilepsy surgery outcome. Ann Neurol 2008; 64 (1): 35–41. [DOI] [PubMed] [Google Scholar]
- 34.Chassoux F,, Rodrigo S,, Semah F, et al. FDG-PET improves surgical outcome in negative MRI Taylor-type focal cortical dysplasias. Neurology 2010; 75 (24): 2168–2175. [DOI] [PubMed] [Google Scholar]
- 35.Cascino GD,, Buchhalter JR,, Mullan BP, et al. Ictal SPECT in nonlesional extratemporal epilepsy. Epilepsia 2004; 45 (suppl 4): 32–34. [DOI] [PubMed] [Google Scholar]


