Abstract
In this paper, radiomic features are used to validate the textural realism of two anthropomorphic phantoms for digital mammography. One phantom was based off a computational breast model; it was 3D printed by CIRS (Computerized Imaging Reference Systems, Inc., Norfolk, VA) under license from the University of Pennsylvania. We investigate how the textural realism of this phantom compares against a phantom derived from an actual patient’s mammogram (“Rachel”, Gammex 169, Madison, WI). Images of each phantom were acquired at three kV in 1 kV increments using auto-time technique settings. Acquisitions at each technique setting were repeated twice, resulting in six images per phantom. In the raw (“FOR PROCESSING”) images, 341 features were calculated; i.e., gray-level histogram, co-occurrence, run length, fractal dimension, Gabor Wavelet, local binary pattern, Laws, and co-occurrence Laws features. Features were also calculated in a negative screening population. For each feature, the middle 95% of the clinical distribution was used to evaluate the textural realism of each phantom. A feature was considered realistic if all six measurements in the phantom were within the middle 95% of the clinical distribution. Otherwise, a feature was considered unrealistic. More features were actually found to be realistic by this definition in the CIRS phantom (305 out of 341 features or 89.44%) than in the phantom derived from a specific patient’s mammogram (261 out of 341 features or 76.54%). We conclude that the texture is realistic overall in both phantoms.
Keywords: Radiomics, digital mammography, anthropomorphic phantom, x-ray imaging, image acquisition
1. INTRODUCTION
Breast density has consistently been shown to be an independent predictor of breast cancer risk.1,2 Recent studies have demonstrated that combining radiomic texture features with mammographic density results in an even better assessment of breast cancer risk.3,4 This paper explores a different application for radiomic texture feature calculations; namely, evaluating how closely the breast parenchymal patterns in an anthropomorphic phantom match a clinical population.
In our previous work, we developed a computational model of the breast in which multiple compartments of dense tissue are grown from seed points in voxel phantoms.5,6 The user can vary parameters controlling the size and shape of the phantom, as well as the percent density and spatial arrangement of dense tissue.7 A key advantage of this model is that a population of virtual phantoms8 can be simulated quickly on a graphics processing unit (GPU).
A physical phantom based off this model was 3D printed by CIRS (Computerized Imaging Reference Systems, Inc., Norfolk, VA) under license from the University of Pennsylvania. The CIRS phantom models a 50 mm thick breast under compression (450 mL by volume) with a volumetric density of 17%.9 The phantom can be used in both 2D digital mammography (DM) and 3D digital breast tomosynthesis (DBT). The phantom was 3D printed in sections (slabs), allowing clusters of calcium oxalate to be inserted within the thickness of the phantom; these are surrogates for calcification clusters.10
In a previous study, Cockmartin et al. calculated power spectra in 2D and 3D images of the CIRS phantom, and showed that the power-law coefficients were in agreement with the values derived from a clinical population.9 In radiomics, there are a multitude of additional features that can be used to validate the texture of a phantom. In this paper, 341 radiomic features are calculated in the CIRS phantom and compared against a clinical population. We also investigate how the texture of the CIRS phantom compares against a phantom derived from an actual patient’s mammogram11 (“Rachel, Gammex 169, Madison, WI), which by nature is expected to be highly realistic. For the purpose of this paper, all radiomics calculations are done exclusively for DM, since the Gammex 169 phantom was developed specifically for DM and not DBT.
2. METHODS
2.1. X-Ray Acquisitions of Phantoms
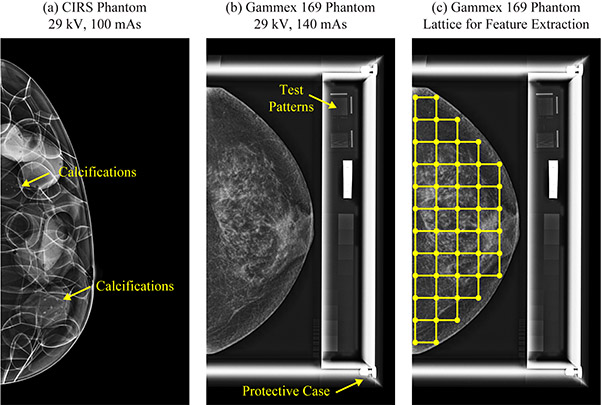
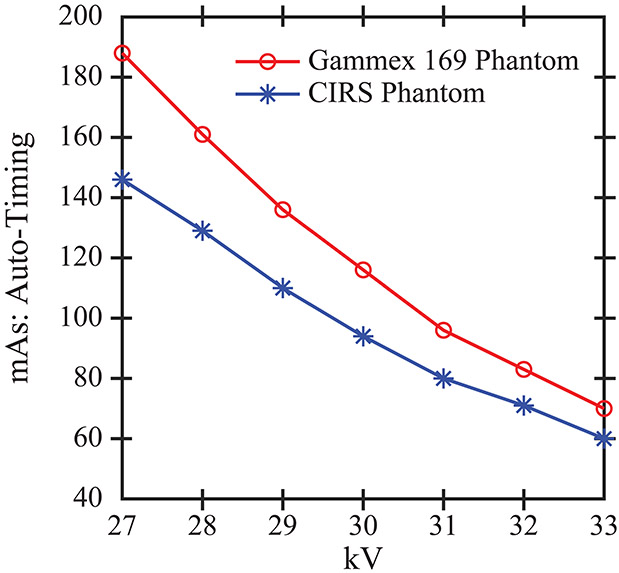
DM images of the two phantoms (CIRS and Gammex 169) were acquired with a Selenia Dimensions system (Hologic Inc., Bedford, MA) with a W/Rh target-filter combination (Figure 1). Images were acquired over a number of different kV and mAs combinations; the auto-timing curves illustrating the effect of kV are shown in Figure 2. A subset of these technique settings was chosen for the purpose of validating the texture of the phantoms. We based the choice of acquisition settings off of data tables for the automatic exposure control settings for a breast with comparable thickness (50 mm) to the phantoms; the appropriate kV is 29 kV for a W/Rh target-filter combination. Additional kV settings in ± 1 kV increments relative to 29 kV were also analyzed. These images were acquired in “Manual” mode at mAs settings designed to match the auto-timing curves. Since the system supports a discrete set of mAs values in “Manual” mode, the closest mAs settings were chosen (Table 1). Two cranial-caudal (CC) images were acquired at each technique setting; these were used for reproducibility analysis. Hence there were six acquisitions per phantom.
Figure 1.
(a) The CIRS phantom was 3D printed from a computational breast model. (b) The Gammex 169 phantom was derived from an actual patient’s mammogram. There are test patterns adjacent to the phantom; these were not analyzed for the purpose of this study. (c) The breast area was partitioned into a lattice of square windows (6.3 mm × 6.3 mm) for calculation of radiomic features. Although these calculations were done in raw DM images, processed DM images are shown.
Figure 2.
DM images of the two phantoms were acquired at auto-timed technique settings. As the kV increases, there is greater x-ray penetration and hence the mAs (relative number of x-ray photons) is reduced.
Table 1.
DM technique settings for each phantom are summarized below. The target-filter combination was W/Rh.
| mAs Setting (28 kV) | mAs Setting (29 kV) | mAs Setting (30 kV) | |
|---|---|---|---|
| CIRS Phantom | 120 mAs | 100 mAs | 95 mAs |
| Gammex 169 Phantom | 160 mAs | 140 mAs | 120 mAs |
2.2. Overview of Clinical Data Set
DM images (CC views) were also analyzed from 1,000 women with negative screening exams at the University of Pennsylvania (Table 2). The images were acquired with Selenia Dimensions systems between 9/1/2014 and 12/31/2014. This research was approved by the Institutional Review Board at the University of Pennsylvania and was compliant with the Health Insurance Portability and Accountability Act. Since previous work demonstrated that radiomic features are dependent on breast thickness under compression12, we compared the phantom data against the subset of clinical data with comparable thickness (±10 mm relative to a 50 mm thick phantom).
Table 2.
Demographic information derived from the data set of 1,000 women with negative screening exams is summarized below.
| Age | < 40 y | 29 (2.9 %) |
| 40-49 y | 255 (25.5%) | |
| 50-59 y | 292 (29.2%) | |
| 60-69 y | 279 (27.9 %) | |
| ≥ 70 y | 145 (14.5%) | |
| BI-RADS® Density | Type a | 114 (11.4%) |
| Type b | 553 (55.3%) | |
| Type c | 311 (31.1%) | |
| Type d | 22 (2.2%) | |
| Ethnicity | African American | 463 (46.3%) |
| Caucasian | 441 (44.1%) | |
| Other/Unknown | 96 (9.6%) |
2.3. Calculation of Radiomic Texture Features
Radiomic features were calculated in raw (“FOR PROCESSING”) DM images. As the first step in these calculations, the breast outline was segmented with LIBRA (Laboratory for Individualized Breast Radiodensity Assessment), a software tool.13 Next, the breast area was partitioned into a regular lattice of square windows [Figure 1(c)]. Each feature was calculated separately in each window. These values were in turn averaged across all windows, resulting in a single image-wise value for each feature. A total of 341 features were calculated; i.e., 12 gray-level histogram, 7 co-occurrence, 7 run length, 2 fractal dimension, 32 Gabor Wavelet, 36 local binary pattern, 125 Laws, and 120 co-occurrence Laws features.14-18
The window size used in the lattice for these feature calculations was 6.3 mm. A previous work by Zheng et al. considered the effect of varying the window size between 6.3 mm and 25.5 mm.3 They found that the smallest window size (6.3 mm) yields the highest area under the receiver-operating-characteristic curve in case-control classification calculations.
2.4. Analysis of Textural Realism of Phantoms
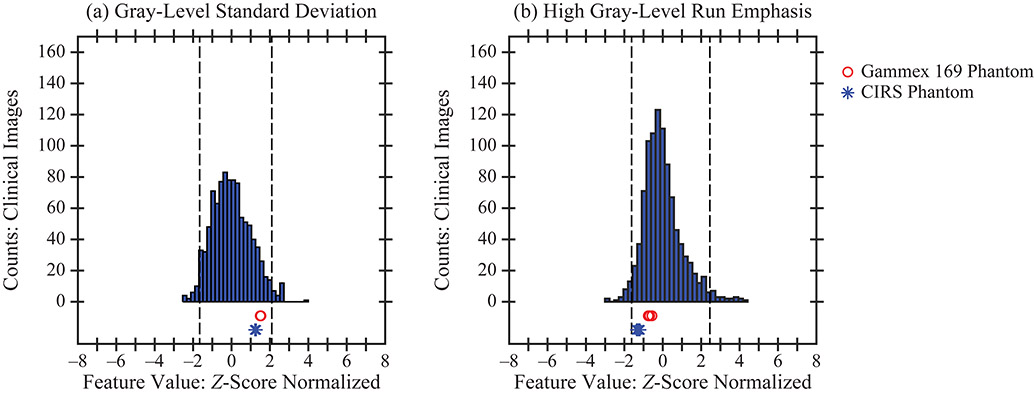
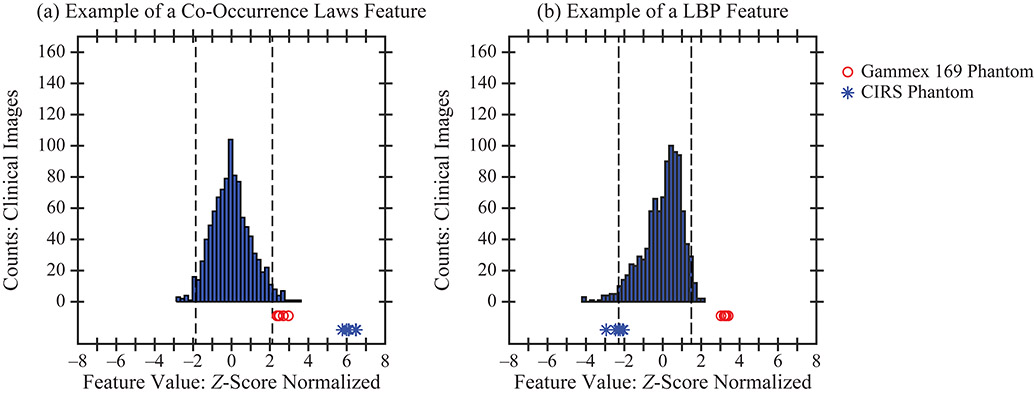
For the two phantoms, the textural realism of each feature was defined based on the middle 95% of the clinical distribution; this was considered to be a realistic range of values for a feature. More specifically, a feature was considered realistic if all six data points derived from phantom images were between the 2.5th and 97.5th percentiles of the clinical distribution. By contrast, a feature was considered unrealistic if the percentile ranks of at least one of the six phantom data points was below 2.5% or above 97.5% (dashed vertical lines in Figures 3-5). Note that other definitions of realism exist, and that different conclusions may result from the use of alternate definitions of realism. For example, in Figure 3, both phantoms are deemed realistic by our metric, but if we defined textural realism in terms of closeness to the 50th percentile of the clinical distribution, then the CIRS phantom is more realistic in terms of the gray-level standard deviation and the Gammex 169 phantom is more realistic in terms of high gray-level run emphasis.
Figure 3.
Each phantom was found to have realistic texture in terms of these two features. The phantom data points derived from six images are all within the middle 95% of the clinical distribution. Dashed lines denote the 2.5th and 97.5th percentiles of the clinical distribution.
Figure 5.
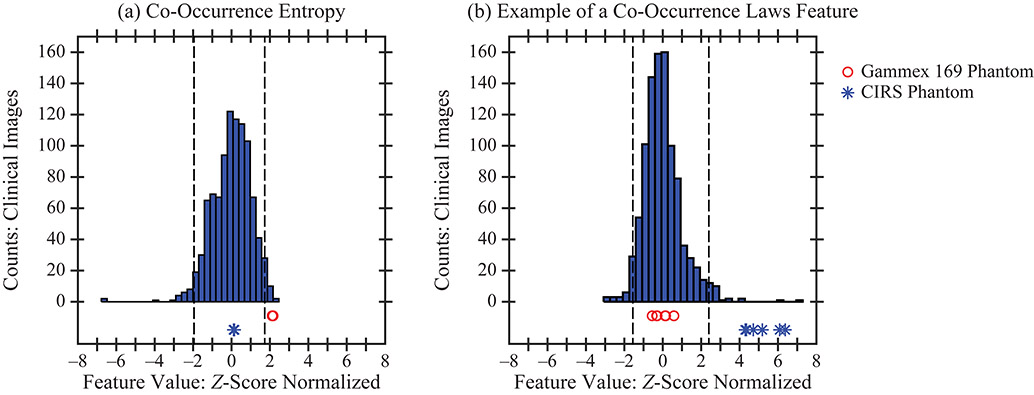
In some features, only one of the two phantoms was shown to have realistic texture; for example, the CIRS phantom in terms of co-occurrence entropy and the Gammex 169 phantom in terms of a Co-Occurrence Laws features.
3. RESULTS
3.1. Calculations of Textural Realism
For each feature, the distribution of values in the clinical data set was Z-score normalized and plotted as a histogram (Figures 3-5). This normalization was also applied to the six phantom data points. To illustrate examples of realistic texture in both phantoms, standard deviation (a gray-level feature) and high gray-level run emphasis (a run length feature) are shown in Figure 3. In these examples, the six data points derived from the phantom acquisitions are clustered over a narrow range of values within the middle 95% of the clinical distribution.
To illustrate the opposite result (unrealistic texture in both phantoms), two additional examples are shown in Figure 4. In some features, all six phantom data points were outside the middle 95% of the clinical distribution, as can be seen in one of the co-occurrence Laws features [Figure 4(a)]. The texture was also considered unrealistic if any subset of phantom data points was outside the middle 95% of the clinical distribution [Figure 4(b)].
Figure 4.
The phantoms were found to have unrealistic texture in terms of these two features. At least one of the six phantom data points is outside the middle 95% of the clinical distribution.
3.2. Summary Statistics
The CIRS phantom was found to have realistic texture in terms of 305 features out of 341 (89.44%). By contrast, the Gammex 169 phantom was found to have realistic texture in terms of 261 features out of 341 (76.54%). These results can be analyzed in more detail on the basis of individual feature families (Table 3). The phantoms showed realistic texture in terms of all the gray-level and Gabor Wavelet features. The phantoms showed unrealistic texture in terms of some measures of fine structural detail.
Table 3.
Summary statistics for each phantom were calculated separately by feature family.
| Feature Family (Number of Features) |
Realistic Features in CIRS Phantom |
Realistic Features in Gammex 169 Phantom |
|---|---|---|
| Co-occurrence (7) | 7 (100%) | 3 (42.86%) |
| Co-occurrence Laws (120) | 106 (88.33%) | 87 (72.50%) |
| Fractal Dimension (2) | 1 (50%) | 0 (0%) |
| Gabor Wavelet (32) | 32 (100%) | 32 (100%) |
| Gray Level (12) | 12 (100%) | 12 (100%) |
| Laws (125) | 111 (88.80%) | 93 (74.40%) |
| LBP (36) | 29 (80.56%) | 29 (80.56%) |
| Run Length (7) | 7 (100%) | 5 (71.43%) |
It is also useful to create a confusion matrix (a 2 × 2 table) summarizing the results for each phantom (Table 4). Both phantoms were shown to have realistic texture in terms of 239 features (70.09%) and unrealistic texture in terms of 14 features (4.11%). In addition, there are 88 features (25.81%) for which the texture is realistic in one phantom but not the other; Figure 5 shows examples of these features.
Table 4.
Summary statistics for each phantom can be analyzed with a confusion matrix.
| Gammex 169 Phantom | ||||
| Realistic | Unrealistic | |||
| CIRS Phantom | Realistic | 239 (70.09%) |
66 (19.35%) |
305 (89.44%) |
| Unrealistic | 22 (6.45%) |
14 (4.11%) |
36 (10.56%) |
|
| 261 (76.54%) |
80 (23.46%) |
341 (100%) |
||
4. DISCUSSION AND CONCLUSION
This paper evaluates the textural realism of two phantoms for DM. One would expect the Gammex 169 phantom to have realistic texture by its very nature, since it was created from an actual patient’s mammogram. In this paper, we offer a validation of the textural realism of this phantom, and show that the CIRS phantom also has realistic texture. We conclude that phantoms based off a computational model can indeed have realistic texture.
In the years since the CIRS phantom was 3D printed, there have been advancements in the voxel phantom. The phantom now includes a model of tissue microstructure, which is simulated with the use of subcompartments of breast tissue designed to match the appearance of histological images.19 Future work should investigate how the texture of the phantom changes based on the addition of these finer details.
ACKNOWLEDGEMENT
Support was provided by the following grants: R01CA207084 and U54CA163313 from the National Institute of Health, W81XWH-18-1-0082 from the Department of Defense Breast Cancer Research Program, and PDF17479714 from Susan G. Komen®. The content is solely the responsibility of the authors and does not necessarily represent the official views of the funding agencies.
ADAM receives research support from Hologic Inc., Barco NV, and Analogic Corporation. Also, ADAM is a shareholder and member of the scientific advisory board of Real Time Tomography, LLC. EFC receives grant support and is part of the advisory panel of Hologic Inc. EFC also receives grant support and is part of the advisory panel of iCAD Inc.
6. REFERENCES
- 1.Boyd NF, Rommens JM, Vogt K, et al. Mammographic breast density as an intermediate phenotype for breast cancer. The Lancet Oncology. 2005;6(10):798–808. [DOI] [PubMed] [Google Scholar]
- 2.Boyd NF, Guo H, Martin LJ, et al. Mammographic Density and the Risk and Detection of Breast Cancer. The New England Journal of Medicine. 2007;356(3):227–236. [DOI] [PubMed] [Google Scholar]
- 3.Zheng Y, Keller BM, Ray S, et al. Parenchymal texture analysis in digital mammography: A fully automated pipeline for breast cancer risk assessment. Medical Physics. 2015;42(7):4149–4160. [DOI] [PMC free article] [PubMed] [Google Scholar]
- 4.Gastounioti A, Conant EF, Kontos D. Beyond breast density: a review on the advancing role of parenchymal texture analysis in breast cancer risk assessment. Breast Cancer Research. 2016;18:91. [DOI] [PMC free article] [PubMed] [Google Scholar]
- 5.Chui JH, Pokrajac DD, Maidment ADA, Bakic PR. Towards Breast Anatomy Simulation Using GPUs. Lecture Notes in Computer Science. 2012;7361:506–513. [Google Scholar]
- 6.Pokrajac DD, Maidment ADA, Bakic PR. Optimized generation of high resolution breast anthropomorphic software phantoms. Medical Physics. 2012;39(4):2290–2302. [DOI] [PMC free article] [PubMed] [Google Scholar]
- 7.Chui JH, Zeng R, Pokrajac DD, et al. Two Methods for Simulation of Dense Tissue Distribution in Software Breast Phantoms. Paper presented at: SPIE Medical Imaging2013; Orlando, FL. [Google Scholar]
- 8.Barufaldi B, Bakic PR, Pokrajac DD, Lago MA, Maidment ADA. Developing Populations of Software Breast Phantoms for Virtual Clinical Trials. Paper presented at: 14th International Workshop on Breast Imaging (IWBI 2018)2018; Atlanta, GA. [Google Scholar]
- 9.Cockmartin L, Bakic PR, Bosmans H, et al. Power Spectrum Analysis of an Anthropomorphic Breast Phantom Compared to Patient Data in 2D Digital Mammography and Breast Tomosynthesis. Lecture Notes in Computer Science. 2014;8539:423–429. [Google Scholar]
- 10.Vieira MAC, Oliveira HCRd, Nunes PF, et al. Feasibility Study of Dose Reduction in Digital Breast Tomosynthesis Using Non-Local Denoising Algorithms. Paper presented at: SPIE Medical Imaging2015; Orlando, FL. [Google Scholar]
- 11.Yaffe MJ, Johns PC, Nishikawa RM, Mawdsley GE, Caldwell CB. Anthropomorphic radiologic phantoms. Radiology. 1986;158(2):550–552. [DOI] [PubMed] [Google Scholar]
- 12.Acciavatti RJ, Hsieh M-K, Gastounioti A, et al. Validation of the Textural Realism of a 3D Anthropomorphic Phantom for Digital Breast Tomosynthesis. Paper presented at: 14th International Workshop on Breast Imaging (IWBI 2018)2018; Atlanta, GA. [DOI] [PMC free article] [PubMed] [Google Scholar]
- 13.Keller BM, Nathan DL, Wang Y, et al. Estimation of breast percent density in raw and processed full field digital mammography images via adaptive fuzzy c-means clustering and support vector machine segmentation. Medical Physics. 2012;39(8):4903–4917. [DOI] [PMC free article] [PubMed] [Google Scholar]
- 14.Haralick RM, Shanmugam K, Dinstein IH. Textural Features for Image Classification. IEEE Transactions on Systems, Man, and Cybernetics. 1973;SMC-3(6):610–621. [Google Scholar]
- 15.Galloway MM. Texture analysis using gray level run lengths. Computer Graphics and Image Processing. 1975;4(2):172–179. [Google Scholar]
- 16.Chu A, Sehgal CM, Greenleaf JF. Use of gray value distribution of run lengths for texture analysis. Pattern Recognition Letters. 1990;11(6):415–419. [Google Scholar]
- 17.Ojala T, Pietikäinen M, Mäenpää T. Multiresolution Gray-Scale and Rotation Invariant Texture Classification with Local Binary Patterns. IEEE Transactions on Pattern Analysis and Machine Intelligence. 2002;24(7):971–987. [Google Scholar]
- 18.Manduca A, Carston MJ, Heine JJ, et al. Texture Features from Mammographic Images and Risk of Breast Cancer. Cancer Epidemiology, Biomarkers & Prevention. 2009;18(3):837–845. [DOI] [PMC free article] [PubMed] [Google Scholar]
- 19.Bakic PR, Pokrajac DD, Caro RD, Maidment ADA. Realistic Simulation of Breast Tissue Microstructure in Software Anthropomorphic Phantoms. Lecture Notes in Computer Science. 2014;8539:348–355. [Google Scholar]


