

Abstract
Gastrointestinal stromal tumors (GIST) are mesenchymal neoplasms, believed to originate from the interstitial cells of Cajal (ICC), often caused by overexpression of tyrosine kinase receptors (TKR) KIT or PDGFRA. Here, we present evidence that the embryonic stem cell factor FOXD3, first identified as “Genesis” and functioning in both gastrointestinal and neural crest cell development, is implicated in GIST pathogenesis; its involvement is investigated both in vitro and in zebrafish and a mouse model of FOXD3 deficiency. Samples from a total of 58 patients with wild-type GISTs were used for molecular analysis, including sanger sequence, CGH and methylation. Immunohistochemistry and Western blot evaluation were used to access FOXD3 expression. Additionally, we conducted in vitro functional studies in tissue samples and in transfected cells to confirm the pathogenicity of the identified genetic variants. Germline partially inactivating FOXD3 sequence variants (p.R54H and p.Ala88_Gly91del) were found in patients with isolated GIST. Chromosome 1p loss was the most frequent chromosomal abnormality identified in tumors. In vitro experiments demonstrate the impairment of FOXD3 in the presence of those variants. Animal studies showed disruption of the GI neural network and changes in the number and distribution in the ICC. FOXD3 suppresses KIT expression in human cells; its inactivation led to an increase in ICCs in zebrafish, as well as mice, providing evidence for a functional link between FOXD3 defects and KIT overexpression leading to GIST formation.
Keywords: FOXD3, GIST, Carney Triad, Carney-Stratakis syndrome, interstitial cells of Cajal
Introduction
Gastrointestinal (GI) stromal tumors (GIST) are the most common mesenchymal tumors of the GI tract. Most often, GISTs are caused by somatic or germline-activating mutations of the KIT and PDGFRA tyrosine kinase (TK) receptor genes and treated with imatinib mesylate (STI571) and other TK inhibitors (TKIs) (Gopie, et al. 2018; Miettinen and Lasota 2006). Up to 15% of all GISTs do not have these mutations (“wild-type” or wt-GISTs). Patients with wt-GISTs tend to be younger and respond poorly to TKIs (Gopie, et al. 2018; Miettinen and Lasota 2006), suggesting additional molecular pathways involved in GIST pathogenesis.
In a subset of patients, multiple GISTs are associated with other tumors, in the dyad of paraganglioma (PGL) and gastric stromal sarcoma or Carney-Stratakis syndrome (CSS), and the triad of gastric leiomyosarcoma, functioning extra-adrenal PGL and pulmonary chondroma or Carney triad (CT) (Carney 2009). Germline variants of the succinate dehydrogenase (SDH) subunit genes SDHA, SDHB, SDHC and SDHD are found in patients with CSS (McWhinney, et al. 2007), and SDHC hypermethylation at somatic level is reported in CT. However, the genetic defect(s) responsible for most cases of CT remain elusive. Comparative genomic hybridization (CGH) has suggested that chromosome 1p is likely to harbor defect(s) associated with GISTs in these patients (Matyakhina, et al. 2007). Loss in the short arm of chromosome 1 is described, in addition to CT patients, also in sporadic wt-GIST (Derre, et al. 2001; El-Rifai, et al. 2000).
In the present study, we used a genome-wide search tool (previously described by Assie et al., 2008 (Assie, et al. 2008) for the identification of genetic defects associated with GISTs in the sporadic setting, as well as in the context of CT. We present evidence that the embryonic stem cell factor FOXD3, first identified as “Genesis” and functioning in both gastrointestinal and neural crest cell development, is implicated in GIST pathogenesis. FOXD3 involvement is investigated both in vitro and in zebrafish and a mouse model of FOXD3 deficiency.
Materials & Methods
Clinical Studies and Human Samples
The institutional review boards at the US Eunice Kennedy Shriver National Institutes of Child Health and Human Development, the US National Institutes of Health (NIH), the Mayo Clinic (Rochester, MN USA) and Hôpital Cochin (Paris, France) approved the contact of the families and their participation in the study. Informed written consent was obtained from all individuals. Blood samples were collected from a total of 58 patients with wt-GISTs, including 22 CT patients as described previously (Assie, et al. 2008; Matyakhina, et al. 2007), 10 recent CT patients, and 26 wt-(not CT)-GISTs patients. Tumor tissue samples from a total of 36 patients were available. Of those, 20 CT (including GIST, paraganglioma and pheochromocytoma) and 5 wt-(not CT)-GIST patients were available and were processed for histopathology or immunohistochemistry following formalin-fixed and paraffin-embedded (method detailed below). Frozen tumor tissues from 27 CT patients and 3 wt-(not CT)-GISTs were available for molecular studies. Most of these tumors and their clinical features have been reported previously in Matyakina et al., 2007 (Matyakhina, et al. 2007). We report IHC data that were either available (Matyakhina, et al. 2007) or that we obtained for this study. By definition, we included only SDHB-negative tumors by IHC in the study because we were looking for genes mutated in SDHB-negative tumors that were negative for SDHx pathogenic variants. Also to be included in the study, all patients were SDHA, SDHB, SDHC and SDHD variant-negative; however, one patient that was SDHB IHC negative was later found to have CSS due to a germline SDHB mutation variant not identified in previous analysis (see results). Tumors were microdissected to isolate normal and tumorigenic tissue. DNA was isolated from tumor samples and lymphocytes, as described previously (Assie, et al. 2008; Matyakhina, et al. 2007). DNA samples from 375 controls of similar ethnicity’s population, previously described (Faucz, et al. 2011), were used for comparison.
Genome-wide analysis
Infinium II assay on HumanHap300 V2 arrays were run on the Illumina Beadstation (Genomics Core Facility, Cleveland Clinic Foundation). To detect hemizygous somatic deletions in heterogeneous tumor samples, the Beadstation records B-allele frequency (BAF) on a scale from 0 (reflecting an AA genotype) to 1 (reflecting a BB genotype) and analyzed by the SOMATICs software as previously described (Assie, et al. 2008).
FOXD3 gene structure, primers, and sequencing
Two different sets of primers were used to amplify the FOXD3 coding region: AMP1 – 5’-CGCCGAGTGTGAGCTGAG-3’ (forward) / 5’-TCAGGGTCAGCTTCTTCTGC-3’ (reverse); and AMP2 – 5’-GAAGCCGCCTTACTCGTACA-3’ (forward) / 5’-GTTTGCTCGACCAGCTTAGG-3’ (reverse). The amplification was done using AccuPrime Pfx DNA polymerase according to the manufacturer recommendations (Invitrogen, Inc). A touchdown PCR was performed with the annealing temperature ranging from 66°C to 60°C, decreasing 0.5°C per cycle. The total number of cycles was 40, including the touchdown part. Gel-purified PCR products were sequenced on 3130XL Genetic Analyzer (Applied Biosystems). Sequences were visually inspected and analyzed using Vector NTI Advance 11 (Invitrogen). All identified variations were verified on an independent DNA aliquot from the same patient. To assess a potential LOH, a nested PCR and sequencing were applied on microdissected tissue from an unstained slide. H&E stained tissue from proximal slices was used to select at least three microdissected sections for both tumor and normal cells. The nested PCR was done using the AMP1 amplicon for the first PCR and, for the nested, the primers: LOH - 5’-ACGGCCGAGGACGTGGACAT-3’ (forward) / 5’-AGGGTCAGCTTCTTCTGCGG-3’ (reverse). For the nested PCR the annealing temperature used was 62°C.
Methylation Assay
DNA methylation was quantitatively assessed at single CpG units by the MassARRAY technique (Sequenom, San Diego, CA) as previously described (Ehrich, et al. 2005). Briefly, 200–500 ng of genomic DNA were sodium bisulfite-treated, PCR-amplified, in vitro transcribed, processed by base-specific RNase A cleavage, and subjected to matrix-assisted laser desorption ionisation-time of flight mass spectrometry (MALDI-TOF). Methylation standards (prepared from whole genome amplified unmethylated and SSS.I in vitro methylated genomic DNA) and correction algorithms based on the R statistical computing environment were used for data normalization. The methylation analysis was divided in 7 different areas, were the first 4 were located in the promoter region of FOXD3 and the last 3 were located on the gene. The methylation results are displayed as heat maps using the Mutliple Experimental Viewer software (MeV) (Saeed, et al. 2003).
Animal studies
All experiments were performed according to the National Institutes of Health Animal Care and Use Committee (ACUC) guide for the care and use of Laboratory animals (NIH Publications No. 8023, revised 1978), under approved protocol ASP# 18–033. The general euthanasia method for mice was CO2 followed by cervical dislocation. Isoflurane was used for chemical restraint. Animals were initially exposed to 3–5% isoflurane until the animal was recumbent. Flow was reduced to 2% and the animal was monitored until it was in a deep plane of anesthesia which was indicated by a lack of righting reflex, and a reduced respiratory rate. In compliance with the NIH Animal Research Advisory Committee guidelines and applying the U.S. Government Principle IV, the animals were observed by the team of technicians, and whenever signs of pain or distress were observed, measures were taken in accordance with the protocol guidelines so that these situations were eliminated. For the zebrafish study, the general euthanasia method was icy water for 3 minutes.
Immunohistochemistry and Western Blot Analysis
On mouse paraffin-embedded GI ileum sections immunohistochemistry using immunofluorescence-detection was used to examine the role of Foxd3 heterozygosity on interstitial cells of Cajal (ICC) numbers. For immunohistochemistry, commercially available antibodies were used. Primary antibodies were as follows: c-kit (DAKO A450229) and Ano1 (Anti-TMEM16A; ab53212), for the secondary fluorescence antibody used for detection goat anti-rabbit Alexa Fluor 555 IgG (H+L) was used. Photomicroscopy images were taken using the Leica DMRX microscope attached to an Olympus DP72 camera. Images were acquired using CellSens software (Olympus). Whole mount immunohistochemistry on zebrafish embryos was performed using TCA fixation for 30 minutes, followed by permeabilization with 0.2 % Triton in PBS, and incubated overnight with primary and secondary antibodies (see below). Antibodies for human samples: FOXD3 (ab64807), PDGFRA (ab61219), GAPDH (ab9485), c-KIT (ab5506). Antibodies for zebrafish experiments: c-kit (abcam16832), acetylated tubulin (SigmaAldrich); secondary fluorescence antibodies used for detection were goat anti-rabbit Alexa Fluor 488 IgG (H+L) (Invitrogen) and donkey anti-mouse Cy3 (Jackson ImmunoResearch, Inc.) Photomicroscopy images were acquired by confocal microscopy (LSM 510META, Carl Zeiss). Western blot analysis was performed as previously described (Park, et al. 1999). Complexes were visualized with appropriate horseradish peroxidase-conjugated secondary antibody and developed by enhanced chemiluminescence procedure (Santa Cruz Biotechnology).
siRNA experiments
HEK293 and NTERA-2 cells were transfected with 100 nM MISSION siRNA (Sigma- Aldrich, St. Louis, MO) specific for human FOXD3 (SASI_Hs01_00011568), or nontargeting pool siRNA using N-TER peptide transfection reagent (Sigma-Aldrich), as per manufacturer’s instruction. The efficiency of siRNA target gene disruption was confirmed by Western blot analysis following standard procedures.
Luciferase Reporter Assay
FOXD3 luciferase promoter construct was a generous gift from the laboratory of Dr. Robert Hromas (Indiana University, USA) (Guo, et al. 2002). Transfections were carried out in HEK293 cells using Lipofectamine 2000 Reagent (Invitrogen, Inc), the Promega Beta-galactosidase enzyme and Luciferase assay systems (Promega, Madison, WI), according to manufacturer’s protocol. Data were controlled for transfection conditions and fold change was compared to wild type.
Zebrafish experiments
The sym1 (Stewart, et al. 2006) mutant zebrafish (foxd3zdf10/zdf10) harboring a point deletion resulting in a premature stop codon in the conserved forkhead domain of foxd3 were ordered from ZIRC (Eugene, OR, USA) and maintained under standard conditions in the NIH Aquatic Facility.
Mouse experiments
Foxd3+/− mice (Hanna, et al. 2002) were used in all experiments as the homozygous deletion is embryonically lethal. Foxd3+/− mice were maintained on a mixed genetic background and were maintained in accordance with protocols approved by the National Institutes of Health. Foxd3+/− and wild-type mice were presented for necroscopy at 12 months (mo). The GI was dissected, and the ileum was collected, embedded in paraffin and sectioned at 10μm. Routine H&E (sections were used to examine morphology as well as determine muscularis thickness) was performed, as well as immunofluorescence immunohistochemistry, to quantitate the number of ICC, as determined by c-kit-positive (immunofluorescence).
Mouse data quantification
The number of ICC in the ileum, as determined by c-Kit immunostaining, was determined for each animal (wild-type n=3; Foxd3+/− n=5), in three sets of sections. Twenty randomly selected, non-overlapping fields were photographed per section at 20x magnification, as per previously described method (Szarek, et al. 2008). The number of all c-Kit-positive cells was totaled, manually.
Ileum muscularis thickness was determined from H&E stained sections. Three to five sets of sections per animal and 10–20 random fields were examined. Using Metamorphous software (Olympus) within each field, equally spaced lines were placed to cover the entire field. From here measurements were taken and the average thickness was determined per field.
Electron Microscopy
Mice were transcardially perfused fixed with 2.5% glutaraldehyde plus 4% PFA, made in 0.1M sodium cacodylate buffer, pH 7.4. Excised GI tissues were cut into one-millimeter cubes and left to post fix overnight in the same fixative in a glass vial overnight at room temperature. Tissue samples were then rinsed in 0.1M sodium cacodylate buffer. The following processing steps were carried out using the variable wattage Pelco BioWave Pro microwave oven (Ted Pella, Inc., Redding, CA.): post-fixed in 1% osmium tetroxide made in 0.1M sodium cacodylate buffer, rinsed in double distilled water (DDW), 2% (aq.) uranyl acetate enhancement, DDW rinse, ethanol dehydration series up to 100% ethanol, followed by a Embed-812 resin (Electron Microscopy Sciences, Hatfield, PA.) infiltration series up to 100% resin. The epoxy resin was polymerized for 20 hours in an oven set at 60°C. Ultra-thin sections were prepared on a Reichert-Jung Ultracut- E ultramicrotome (80nm). The sections were collected on 200 mesh cooper grids (Electron Microscopy Sciences, Hatfield, PA) and post-stained with uranyl acetate and lead citrate and examined in a JEOL 1400 transmission electron microscope operating at 80kV. Images were acquired on a Gatan UltraScan 1000XP camera.
Statistical Analyses
Graphs were generated using Graph Pad Prism version 9.2.0. Statistical analyses were performed using Student’s t test. Data are expressed as mean ± SEM. For immune staining assays, data represents the average of positive stained cells of each slide. Differences between mean values were considered significant when p <0.05.
Results
The genome-wide screen for genetic defects in wt-GIST patients (CT and non-CT) (Assie, et al. 2008) identified chromosome 1p as the most frequently affected region in these lesions (Supplementary Fig S1). FOXD3 was deleted in 6 tumors from 5 patients (of a total of 22 patients screened) with CT and wt-GISTs. All identified FOXD3 deletions (Fig 1A) were somatic and led to FOXD3 down-regulation in the tumors (Fig 2A). The profile observed in the samples with an alteration at the FOXD3 locus through CGH-array analysis is consistent with the presence of somatic deletions, ruling out uniparental disomy (Supplementary Fig S2). Furthermore, in line with these findings, the two GIST patients with 1p31 deletions and tissue available for immunohistochemistry consistently exhibited lighter staining in comparison to GIST tumors without chromosomal deletion (Fig 2B). In fact, all other eight tumors stained for FOXD3 showed normal levels of FOXD3 expression within the tumor and the normal tissue. This lighter staining observed in the patients with 1p31 deletion can be interpreted as either negative or decreased.
Fig 1. Molecular analysis of FOXD3, including CGH, sanger sequencing and methylation analysis.
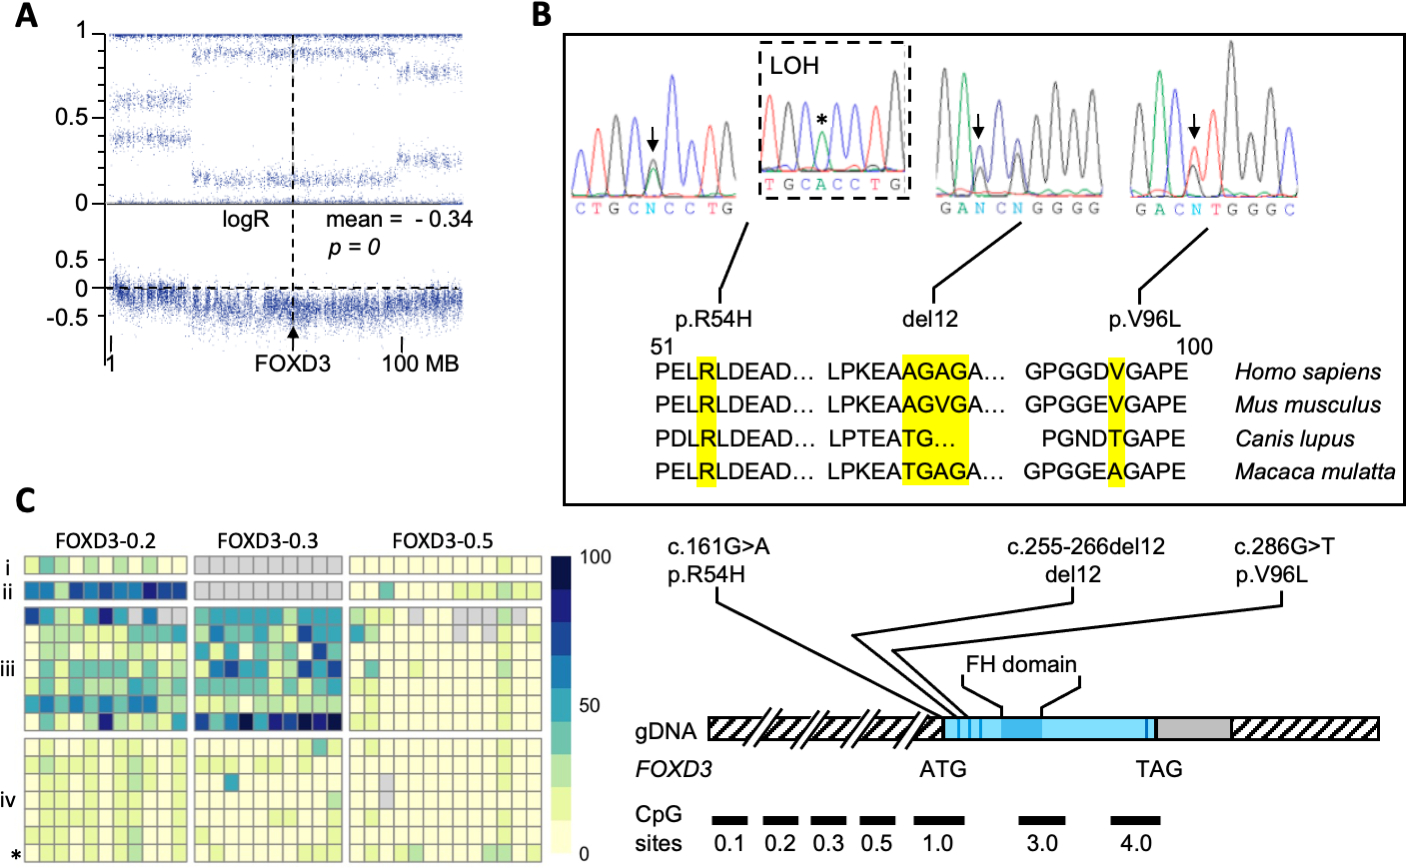
(A) CGH array showing somatic loss of the 1p locus harboring the FOXD3 in a Gastrointestinal stromal tumor (GIST) from a patient with Carney triad (CT); (B) Top: Sanger sequencing showing genetic variants in FOXD3; from left to right: Germline heterozygous variant c.161G>A (DNA from blood), LOH-consistent appearance of c.161G>A (*) in DNA from matched tumor tissue, germline deletion (p.Ala88_Gly91del, del12), germline variant p.V96L; bottom: conservation of the corresponding FOXD3 loci across species; (C) Left: DNA methylation analysis (range of DNA methylation from 0 to 100% is indicated by yellow-blue color gradient, gray indicates missing information) of CpG units within the FOXD3 upstream and promoter region in (i) normal abdominal tissue; (ii) tumor DNA from wild-type GIST; (iii) tumor DNA from GIST and PGL samples of CT patients; (iv) germline DNA from patients with wild-type GIST and CT (CT patient indicated with *); right: schematic representation of the identified genetic variants along the FOXD3 gene; CpG sites are indicated.
Fig 2. Down regulation of FOXD3.
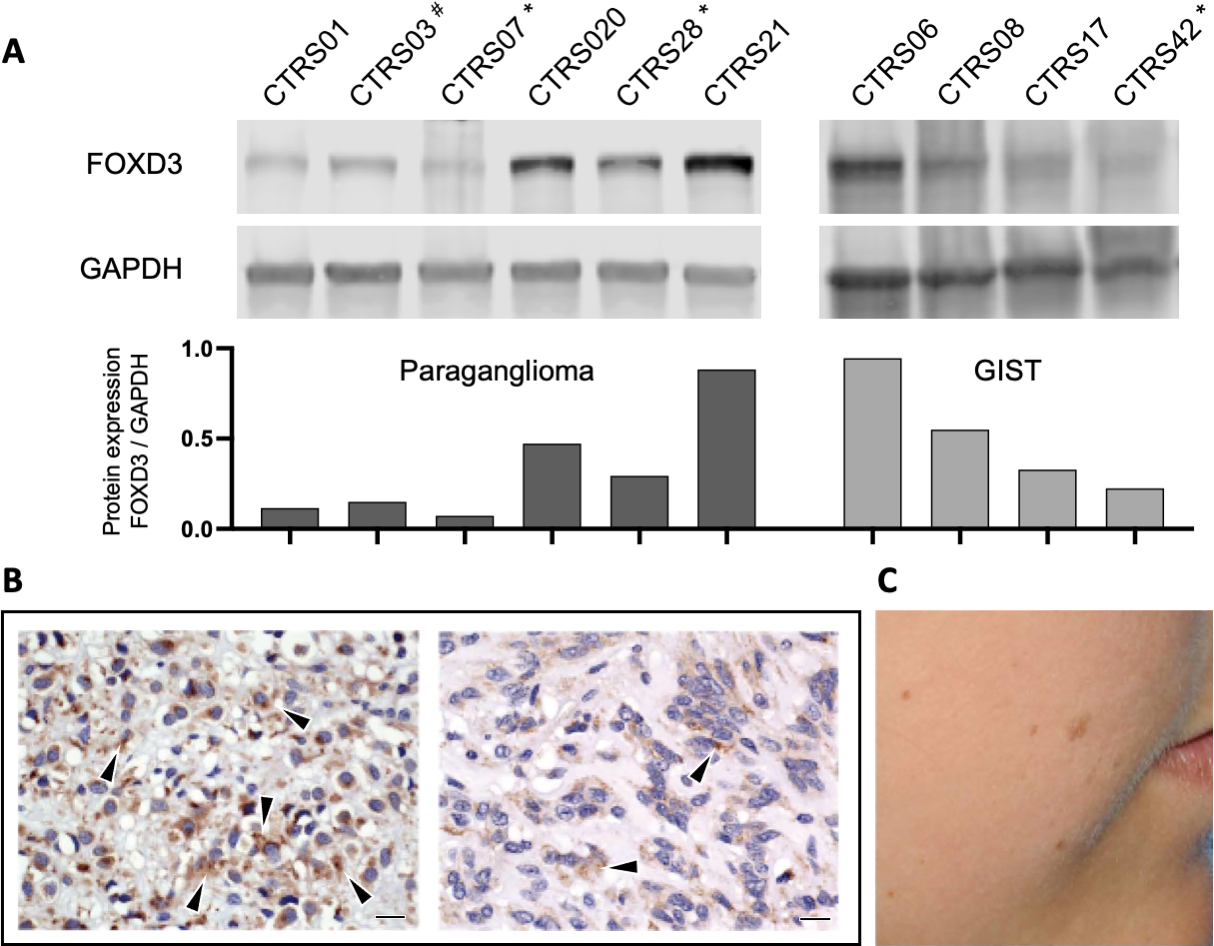
(A) Top: Western blot showing decreased FOXD3 protein expression in tumors with 1p31 deletion (*) or FOXD3 promoter methylation (#) compared to samples without known FOXD3 defects; bottom: band densitometry quantification of each sample; bars represent the ratio FOXD3 / GAPDH; (B) decreased FOXD3 immunoreactivity in a tumor with 1p31 deletion (right) compared to a GIST caused by a PDGFRA mutation (left); bar indicates 10 μm; (C) Pigmented skin lesions in a patient with CT whose tumor showed methylation.
Two FOXD3 coding variants were found among 26 unrelated patients who did not have CT but were affected by sporadic wt-GISTs: c.161G>A/p.R54H (rs199958231 – 0.2%-GnomAD) and c.262_273del / p.Ala88_Gly91del (“del12” – rs151026788 – 0.09%-GnomAD) (Fig. 1B). The R54H and del12 FOXD3 variants were rare among 372 ethnically-matched populations controls (X2=4.567, p=0.03). A third coding sequence variant, c.286G>T/p.V96L (rs2274188 – 1.1%-GnomAD) (Fig 1B), was found in a pediatric GIST patient, but the frequency was not significantly different than in the control samples (4/372, p <0.05) and this patient was later found to have CSS due to a germline SDHB mutation (c.725G>A/p.R242H - rs74315368 – 0.001%-GnomAD). No other variants in SDHx genes (including SDHA, SDHB, SDHC, and SDHD genes) were present in this cohort. All the samples have been analyzed by both whole exome sequencing and Sanger sequencing of individual genes related to GIST, including BRAF, NF1, HRAS, NRAS, ARID1A, ARID1B, CBL, FGFR1, ATR, LTK, SUFU, PARK2, ZNF217, KRAS, MEN1 and PIK3CA. No mutations in these genes have been found in the samples tested in the present study. The few variants that we found in KRAS, BRAF, NF1 and other genes were reported separately in Boikos et al., 2016 (Boikos, et al. 2016). Given the absence of RNA-seq analysis, it is possible that some wild-type GISTs may harbor undetected oncogenic fusions, as previously described (Dermawan, et al. 2022; Luo, et al. 2022).
Peripheral blood and tumor DNA was available from one of the two patients with wt-GIST and a FOXD3 sequence variant; loss of the normal c.161G FOXD3 allele (loss-of-heterozygosity, LOH) was demonstrated for the tumor bearing the c.161G>A/p.R54H germline variant (Fig 1B). Furthermore, 7 tumors that did not harbor 1p deletions or sequencing defects were found to have acquired methylation (Fig 1C) of CpG units (consisting of one or several CpG dinucleotides) spread upstream of FOXD3 gene. The coding sequence region of the gene showed increased DNA methylation levels, however, these results did not reach statistical significance. One of those patients (CTRS03) showed decreased FOXD3 protein expression (Fig 2A)
All the tumors studied here were “classic” wt-GISTs, in the sense that their primaries were primarily in the antrum of the stomach and their histology was epithelioid. As with other wt-GISTs, lymph node metastasis was present in 12 (out of 58 – 20.7%) patients. There was no specific histological or clinical feature that could distinguish the lesions harboring a FOXD3 variant from the ones without variant. Patients with FOXD3 variants had a clinical course that was generally indistinguishable from those that did not have these variants although the numbers of patients in either group is small for any conclusions.
The relative luciferase activation of the three FOXD3 variants found in our cohort were analyzed using the HEK293 cell line. The variants R54H and del12 showed a decreased ability to activate the target promoter. The variant V96L showed no significant difference, although it showed a trend of decreased activity. (Fig 3A) (Guo, et al. 2002).
Fig 3. In vitro tests for evaluation of FOXD3 variants activity and relation between FOXD3 and c-KIT expression.
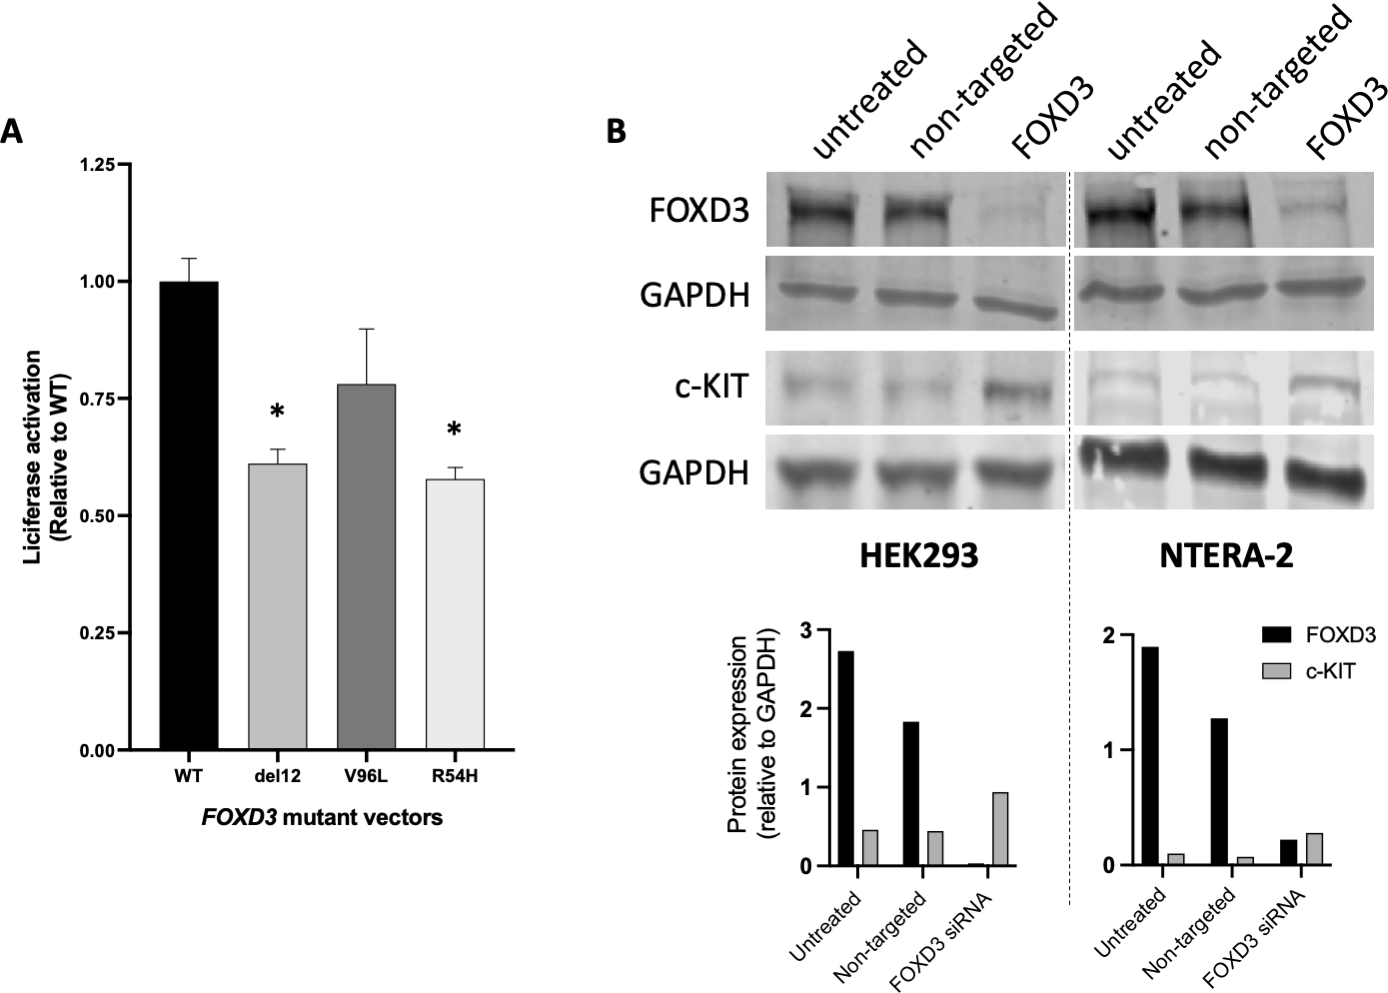
(A) Decreased transcriptional transactivation of the identified FOXD3 sequence variants; *p <0.001; (B) Top: siRNA knockdown of the FOXD3 resulted in an upregulation of c-KIT expression in both HEK293 (left) and NTERA-2 (right) cell lines; bottom: band densitometry quantification of each sample in each cell line; for each sample the black bars represent the ratio FOXD3 / GAPDH and the grey bars represent the ratio c-KIT / GAPDH;
Down-regulation of FOXD3 by small inhibitory (si) RNA in HEK293 and NTERA-2 cells resulted in an increase in c-KIT expression (Fig 3B). Furthermore, because melanocytic lesions are frequent in CT patients (Fig 2C), we assessed the foxd3 mutant zebrafish embryos for pigmentation: these fish were, indeed, heavily pigmented (Fig 4A, 4B, 4F, 4G). In addition, foxd3 mutant zebrafish showed disruption of the GI neural network and an increased number of enlarged kit-immunoreactive Cajal-like cells (Fig 4C–4E, 4H–4J).
Fig 4. foxd3zdf10/zdf10 mutant zebrafish embryos and gastrointestinal immunohistochemistry analysis.
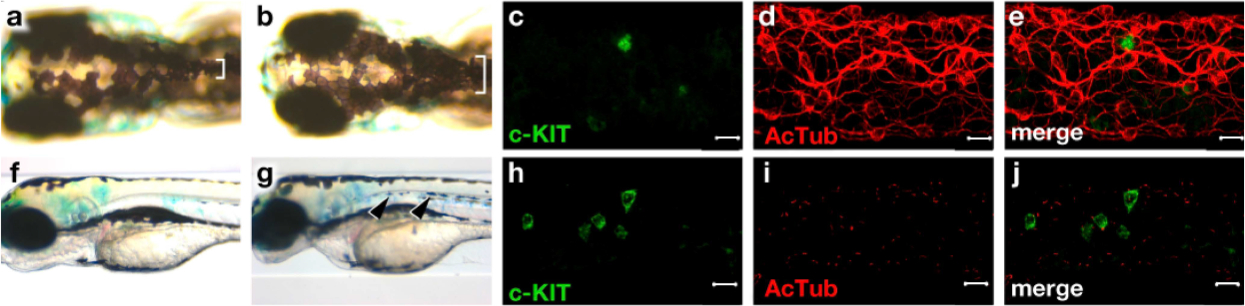
Foxd3 mutant zebrafish (B,G) embryos show hyperpigmentation (white brackets and black arrows) compared to wild-type (A,F). Foxd3 mutant zebrafish embryos show increased numbers of Cajal-like cells and decreased neural innervations (H-J) compared to wild-type (C-E), bar indicates 10 μm.
Ultrastructural changes in morphology of ICC in Foxd3+/− and wild type mice was examined using c-KIT+ immunostaining. Immunostaining revealed increased absolute ICC numbers (Fig 5A) in the inner circular muscularis of the ileum in all animals with Foxd3 haploinsufficiency versus the wild type; in the outer longitudinal layer ICC numbers were decreased (Fig 5A) and there was no difference in the thickness of the muscularis (Fig 5B).
Fig 5. Analysis of the number of Interstitial Cells of Cajal and thickness in the muscularis of the ileum in Foxd3+/− mutant and wild type 12-month old mice.
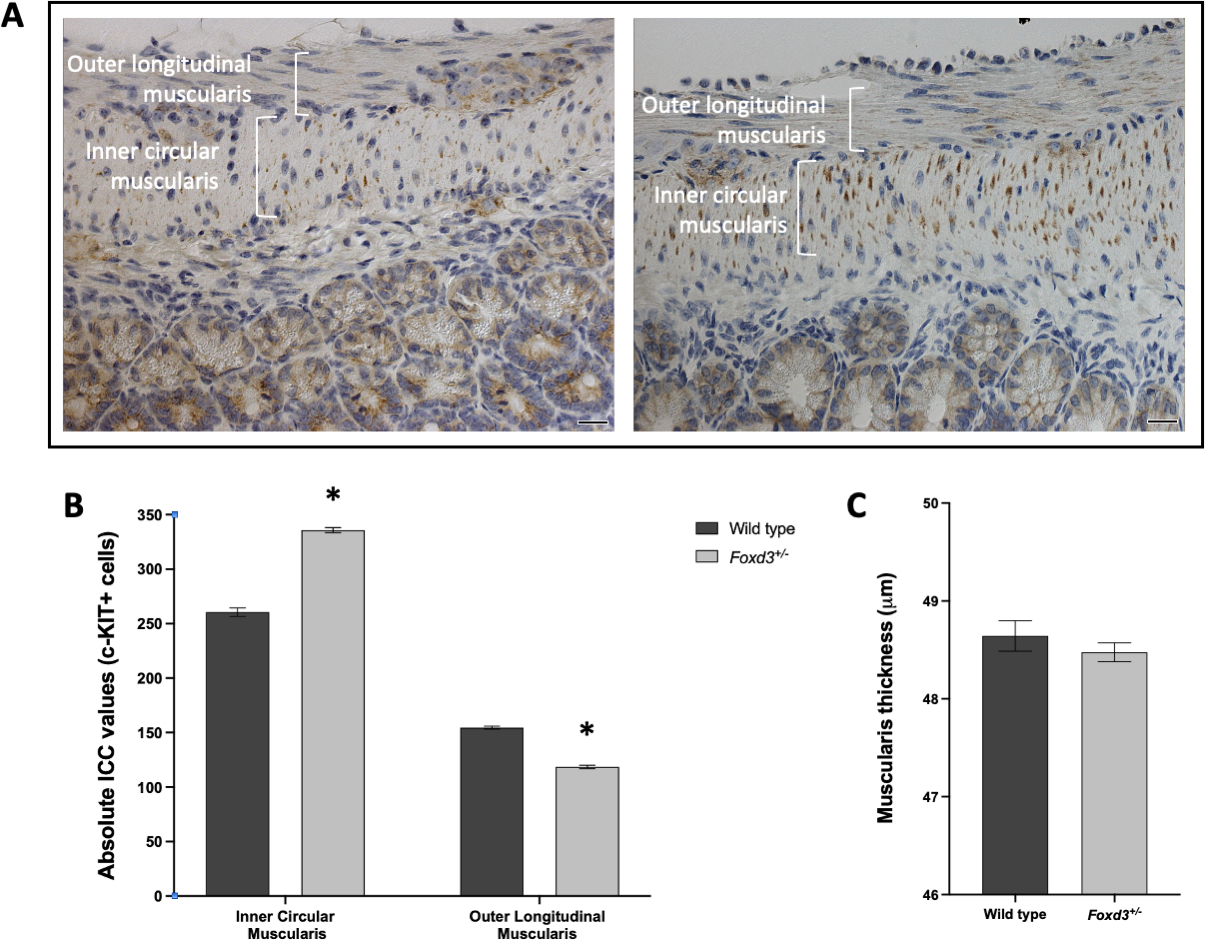
(A) Interstitial cells of Cajal (ICC) identified by c-Kit immunostaining; right: Foxd3+/− mutant showing a higher c-Kit staining in the inner circular muscularis and a lower c-Kit staining in the outer longitudinal muscularis when compared with a wild type 12-month old mice (left); bar indicates 20 μm; (B) c-Kit positive cells were counted in random fields from the ileum (n=3 wild type and n=5 Foxd3+/− mutant mice); (C) Thickness of the muscularis was measured in random fields (10–20 measurements/field) from the ileum (n=3 wild type and n=5 Foxd3+/− mutant mice). Data represented as mean ± SEM. * p <0.0001.
Discussion
Wt-GISTs are rare tumors accounting for about 15% of all gastrointestinal tumors and being more frequent at younger ages (Gopie, et al. 2018). Among the wt-GISTs, including some CT patients without SDHx variants, a frequently found somatic chromosomal alteration is the deletion of the short arm of chromosome 1 (1p31.1), spanning several genes, including FOXD3 (Derre, et al. 2001; El-Rifai, et al. 2000; Matyakhina, et al. 2007). In the present study, we were able to confirm the presence of 1p loss at the somatic level in 5 out of 22 patients (22.7%). A significantly higher frequency of FOXD3 coding changes was also observed in patients with wt-(not CT)-GISTs (8%) compared with 372 ethnically matched population controls. A significant difference was also observed when the frequency of variants was compared with a population database (https://gnomad.broadinstitute.org) (0.36%, p < 0.0001, odds ratio 22.96, 95% confidence interval 5.41–97.42). When compared to other genes with a potential predisposition to the development of wt-GISTs, the prevalence of FOXD3 variations in our wt-GISTs group was similar or higher. Also, based on in silico analysis, the two original residues of FOXD3 variants found in this work (R54H and del12) are highly conserved across species.
Epigenetic silencing of cytosines in CpG dinucleotides via methylation is a well-acknowledged GE regulatory mechanism (Sabatucci, et al. 2020). FOXD3 methylation has been previously reported in colorectal cancer, hepatocellular carcinoma, and ovarian cancer (He, et al. 2015; Luo, et al. 2019; Xu, et al. 2019). However, until now, it was not described in benign tumors such as wt-GISTs. In this study, we observed increased levels of FOXD3 upstream methylation in the tumors of patients with wild-type FOXD3 gene sequence, despite the analysis being limited to a small subset of patients (8 out of 58). It is important to note that due to the small number of patients analyzed, other genes, such as SDHx, could also potentially be subject to epigenetic silencing. Further investigations with larger patient cohorts are warranted to explore the potential epigenetic regulation of additional genes involved in the pathogenesis of these tumors. Protein analysis by western blot of one of these patients (CTRS03) showed a decrease in FOXD3 protein expression when compared with patients without any known FOXD3 defect. This indicates that epigenetic regulation through aberrant DNA methylation could be an important mechanism impacting FOXD3 expression and thereby contributing to the development of tumors such as wt-GISTs. Important to note that due to the it is possible that other patients may have epigenetic silencing of SDH.
In addition, in some CT patients, we observed the presence of an increased number of melanocytic lesions. Finally, strong pigmentation was also seen in foxd3 mutant zebrafish.
Next, we investigated how FOXD3 suppression could lead to GIST development. FOXD3 encodes a winged helix/forkhead class transcription factor that is expressed in pre-migratory neural crest cells and regulates neural crest cell fate through interaction with different key players in the nucleosome and chromatin organization to maintain multipotency and define cell destination (Lukoseviciute, et al. 2018; Stewart, et al. 2006; Xiao, et al. 2019). In rats, it has been demonstrated that Foxd3, together with Foxd4, is important for the development of hindgut (Wang, et al. 2018). Foxd3 and Kit expression are coordinated in melanocyte differentiation in zebrafish (Cooper, et al. 2009; Teng, et al. 2008). In the present work, we show that FOXD3 expression is negatively correlated with c-KIT expression in the human cell lines HEK293 and NTERA-2. In the Foxd3-haploinsufficient mice, an increase of c-Kit expression was observed in the inner circular muscularis of the ileum, which correlated with an increase in the absolute number of interstitial cells of Cajal. This observation provides a link between in vivo FOXD3 deficiency and an increase in the precursor cells of GISTs. GISTs have long been considered a stem cell neoplasm, thought to originate from the interstitial cells of Cajal (ICCs). ICCs are pacemaker cells of the GI tract expressing both neural (KIT) and mesenchymal (CD34) markers and are located between the circular and longitudinal muscle layers of the muscularis propria (the GI muscle wall) in intimate contact with smooth muscle cells and proximal to autonomic ganglia (Kindblom, et al. 1998). In foxd3 mutant zebrafish, the disruption of the GI neural network may indicate a disruption of tissue homeostasis, favoring the development of tumors in that region.
In conclusion, the identification of FOXD3 somatic variants, epimutation and somatic loss of FOXD3 in wt-GISTs, as well as the demonstration of the correlation between FOXD3 deficiency and ICC dysregulation in vitro and in vivo, is an important step toward understanding the molecular basics of GISTs. These results have multiple clinical applications, including providing personalized clinical decision support and development of targeted therapeutic agents against these rare tumors.
Supplementary Material
Fig S1. Tumor samples from Carney triad and wt-GIST patients available for this study
CT: Carney triad; GIST: Gastrointestinal stromal tumor; PGL: Paraganglioma; PHEO: pheochromocytoma; wt: wild type. Black rectangles represent sample availability; grey rectangles show the type of analysis performed for each sample.
Fig S2. Profiles of the 6 samples with an alteration at the FOXD3 locus
Green line: profiles of the 6 samples with an alteration at the FOXD3 locus. For each panel: the upper channel represents the B-allele frequency (proportion of B allele); the lower channel represents the LogR (signal intensity).
Acknowledgements
We thank Rick Dreyfuss, Shauna Everett, and Alan Hoofring from the NIH medical arts department for light microscopy images and preparation of figures and artwork. We also would like to thank Mr. Evan R. Ball, Dr. Miho Matsuda, Dr. Eitan Bornstein, Dr. Kiran Nadella, Dr. Eirini Bimpaki, Dr. Kit Man Tsang, Dr. Aidan Carney and The NIH Pediatric GIST Clinic participants, that contributed to several studies and/or patient recruitment, including Dr. Su Young Kim, Dr. Margarita Raygada, Dr. Lee J. Helman (National Cancer Institute, NIH, Bethesda, MD), Dr. Maya Lodish (University of California, San Francisco, CA), Dr. George D. Demetri (Harvard University, Boston, MA), Dr. Jonathan A. Fletcher, Dr. Katherine A. Janeway (Dana Farber Cancer Institute, Boston, MA) Dr. Suzanne George, Dr. Michael LaQuaglia (Memorial Sloan-Kettering Cancer Center, New York, NY), Dr. Alberto Pappo (Baylor College of Medicine, Houston, TX), and Dr. Margaret von Mehren (Fox Chase Cancer Center, Philadelphia, PA). Charis Eng is the Sondra J. and Stephen R. Hardis Endowed Chair in Cancer Genomic Medicine at the Cleveland Clinic, and an ACS Clinical Research Professor. The authors also would like to thank the NICHD’s Intramural Research Program - Molecular Genomics Core (Dr. Steven Coon, Dr. James Iben, and Dr. Li Tianwei) for its support.
Financial Support:
This work was supported in part by the intramural program of the Eunice Kennedy Shriver National Institute of Child Health and Human Development, National Institutes of Health, Bethesda, MD, USA (research project Z01-HD008920) (C.A.S.). The FOXD3 methylation assay was supported by National Cancer Institute (P01 CA101956), the German Cancer Research Center and the German Cancer Consortium (C.P.). The funders had no role in study design, data collection and analysis, decision to publish, or preparation of the manuscript.
Footnotes
Disclosure statement:
C.A.S. holds a patent on the PRKAR1A, PDE11A, and GPR101 genes and/or their function and his laboratory has received research funding from Pfizer Inc. C.A.S. is now Chief Scientific Officer of ELPEN, Inc. and serves as a consultant to Lundbeck, Pharma, Inc. and Sync, Inc.; he is also the Director of Genetics & Precision Medicine, at FORTH (www.forth.gr); none of these activities conflict with the contents of this manuscript. F.R.F. holds a patent on the GPR101 gene and/or its function. The other authors have nothing to disclose.
Data Availability
All relevant data are within the manuscript and its Supporting Information file. All numerical data generated during this article, underlying graphs or summary statistics, are available at https://doi.org/10.6084/m9.figshare.16439055.v1.
References
- Assie G, LaFramboise T, Platzer P, Bertherat J, Stratakis CA & Eng C 2008. SNP arrays in heterogeneous tissue: highly accurate collection of both germline and somatic genetic information from unpaired single tumor samples. American journal of human genetics 82 903–915. [DOI] [PMC free article] [PubMed] [Google Scholar]
- Boikos SA, Pappo AS, Killian JK, LaQuaglia MP, Weldon CB, George S, Trent JC, von Mehren M, Wright JA, Schiffman JD, et al. 2016. Molecular Subtypes of KIT/PDGFRA Wild-Type Gastrointestinal Stromal Tumors: A Report From the National Institutes of Health Gastrointestinal Stromal Tumor Clinic. JAMA Oncol 2 922–928. [DOI] [PMC free article] [PubMed] [Google Scholar]
- Carney JA 2009. Carney triad: a syndrome featuring paraganglionic, adrenocortical, and possibly other endocrine tumors. The Journal of clinical endocrinology and metabolism 94 3656–3662. [DOI] [PubMed] [Google Scholar]
- Cooper CD, Linbo TH & Raible DW 2009. Kit and foxd3 genetically interact to regulate melanophore survival in zebrafish. Developmental dynamics : an official publication of the American Association of Anatomists 238 875–886. [DOI] [PMC free article] [PubMed] [Google Scholar]
- Dermawan JK, Vanderbilt CM, Chang JC, Untch BR, Singer S, Chi P, Tap WD & Antonescu CR 2022. FGFR2::TACC2 fusion as a novel KIT-independent mechanism of targeted therapy failure in a multidrug-resistant gastrointestinal stromal tumor. Genes Chromosomes Cancer 61 412–419. [DOI] [PMC free article] [PubMed] [Google Scholar]
- Derre J, Lagace R, Terrier P, Sastre X & Aurias A 2001. Consistent DNA losses on the short arm of chromosome 1 in a series of malignant gastrointestinal stromal tumors. Cancer Genet Cytogenet 127 30–33. [DOI] [PubMed] [Google Scholar]
- Ehrich M, Nelson MR, Stanssens P, Zabeau M, Liloglou T, Xinarianos G, Cantor CR, Field JK & van den Boom D 2005. Quantitative high-throughput analysis of DNA methylation patterns by base-specific cleavage and mass spectrometry. Proceedings of the National Academy of Sciences of the United States of America 102 15785–15790. [DOI] [PMC free article] [PubMed] [Google Scholar]
- El-Rifai W, Sarlomo-Rikala M, Andersson LC, Knuutila S & Miettinen M 2000. DNA sequence copy number changes in gastrointestinal stromal tumors: tumor progression and prognostic significance. Cancer Res 60 3899–3903. [PubMed] [Google Scholar]
- Faucz FR, Horvath A, Rothenbuhler A, Almeida MQ, Libe R, Raffin-Sanson ML, Bertherat J, Carraro DM, Soares FA, Molina Gde C, et al. 2011. Phosphodiesterase 11A (PDE11A) genetic variants may increase susceptibility to prostatic cancer. The Journal of clinical endocrinology and metabolism 96 E135–140. [DOI] [PMC free article] [PubMed] [Google Scholar]
- Gopie P, Mei L, Faber AC, Grossman SR, Smith SC & Boikos SA 2018. Classification of gastrointestinal stromal tumor syndromes. Endocr Relat Cancer 25 R49–R58. [DOI] [PubMed] [Google Scholar]
- Guo Y, Costa R, Ramsey H, Starnes T, Vance G, Robertson K, Kelley M, Reinbold R, Scholer H & Hromas R 2002. The embryonic stem cell transcription factors Oct-4 and FoxD3 interact to regulate endodermal-specific promoter expression. Proceedings of the National Academy of Sciences of the United States of America 99 3663–3667. [DOI] [PMC free article] [PubMed] [Google Scholar]
- Hanna LA, Foreman RK, Tarasenko IA, Kessler DS & Labosky PA 2002. Requirement for Foxd3 in maintaining pluripotent cells of the early mouse embryo. Genes & development 16 2650–2661. [DOI] [PMC free article] [PubMed] [Google Scholar]
- He G, Hu S, Zhang D, Wu P, Zhu X, Xin S, Lu G, Ding Y & Liang L 2015. Hypermethylation of FOXD3 suppresses cell proliferation, invasion and metastasis in hepatocellular carcinoma. Exp Mol Pathol 99 374–382. [DOI] [PubMed] [Google Scholar]
- Kindblom LG, Remotti HE, Aldenborg F & Meis-Kindblom JM 1998. Gastrointestinal pacemaker cell tumor (GIPACT): gastrointestinal stromal tumors show phenotypic characteristics of the interstitial cells of Cajal. The American journal of pathology 152 1259–1269. [PMC free article] [PubMed] [Google Scholar]
- Lukoseviciute M, Gavriouchkina D, Williams RM, Hochgreb-Hagele T, Senanayake U, Chong-Morrison V, Thongjuea S, Repapi E, Mead A & Sauka-Spengler T 2018. From Pioneer to Repressor: Bimodal foxd3 Activity Dynamically Remodels Neural Crest Regulatory Landscape In Vivo. Dev Cell 47 608–628 e606. [DOI] [PMC free article] [PubMed] [Google Scholar]
- Luo GF, Chen CY, Wang J, Yue HY, Tian Y, Yang P, Li YK & Li Y 2019. FOXD3 may be a new cellular target biomarker as a hypermethylation gene in human ovarian cancer. Cancer Cell Int 19 44. [DOI] [PMC free article] [PubMed] [Google Scholar]
- Luo Y, Wu Y, Chang X, Huang B, Luo D, Zhang J, Zhang P, Shi H, Fan J & Nie X 2022. Identification of a novel FGFR2-KIAA1217 fusion in esophageal gastrointestinal stromal tumours: A case report. Front Oncol 12 884814. [DOI] [PMC free article] [PubMed] [Google Scholar]
- Matyakhina L, Bei TA, McWhinney SR, Pasini B, Cameron S, Gunawan B, Stergiopoulos SG, Boikos S, Muchow M, Dutra A, et al. 2007. Genetics of carney triad: recurrent losses at chromosome 1 but lack of germline mutations in genes associated with paragangliomas and gastrointestinal stromal tumors. The Journal of clinical endocrinology and metabolism 92 2938–2943. [DOI] [PubMed] [Google Scholar]
- McWhinney SR, Pasini B & Stratakis CA 2007. Familial gastrointestinal stromal tumors and germ-line mutations. The New England journal of medicine 357 1054–1056. [DOI] [PubMed] [Google Scholar]
- Miettinen M & Lasota J 2006. Gastrointestinal stromal tumors: review on morphology, molecular pathology, prognosis, and differential diagnosis. Archives of pathology & laboratory medicine 130 1466–1478. [DOI] [PubMed] [Google Scholar]
- Park YG, Nesterova M, Agrawal S & Cho-Chung YS 1999. Dual blockade of cyclic AMP response element- (CRE) and AP-1-directed transcription by CRE-transcription factor decoy oligonucleotide. gene-specific inhibition of tumor growth. The Journal of biological chemistry 274 1573–1580. [DOI] [PubMed] [Google Scholar]
- Sabatucci A, Berchet V, Bellia F, Maccarrone M, Dainese E, D’Addario C & Pucci M 2020. A new methodological approach for in vitro determination of the role of DNA methylation on transcription factor binding using AlphaScreen(R) analysis: Focus on CREB1 binding at hBDNF promoter IV. J Neurosci Methods 341 108720. [DOI] [PubMed] [Google Scholar]
- Saeed AI, Sharov V, White J, Li J, Liang W, Bhagabati N, Braisted J, Klapa M, Currier T, Thiagarajan M, et al. 2003. TM4: a free, open-source system for microarray data management and analysis. Biotechniques 34 374–378. [DOI] [PubMed] [Google Scholar]
- Stewart RA, Arduini BL, Berghmans S, George RE, Kanki JP, Henion PD & Look AT 2006. Zebrafish foxd3 is selectively required for neural crest specification, migration and survival. Developmental biology 292 174–188. [DOI] [PubMed] [Google Scholar]
- Szarek E, Farrand K, McMillen IC, Young IR, Houghton D & Schwartz J 2008. Hypothalamic input is required for development of normal numbers of thyrotrophs and gonadotrophs, but not other anterior pituitary cells in late gestation sheep. The Journal of physiology 586 1185–1194. [DOI] [PMC free article] [PubMed] [Google Scholar]
- Teng L, Mundell NA, Frist AY, Wang Q & Labosky PA 2008. Requirement for Foxd3 in the maintenance of neural crest progenitors. Development 135 1615–1624. [DOI] [PMC free article] [PubMed] [Google Scholar]
- Wang LJ, Wang WL, Gao H, Bai YZ & Zhang SC 2018. FOXD3/FOXD4 is required for the development of hindgut in the rat model of anorectal malformation. Exp Biol Med (Maywood) 243 327–333. [DOI] [PMC free article] [PubMed] [Google Scholar]
- Xiao L, Shan Y, Ma L, Dunk C, Yu Y & Wei Y 2019. Tuning FOXD3 expression dose-dependently balances human embryonic stem cells between pluripotency and meso-endoderm fates. Biochim Biophys Acta Mol Cell Res 1866 118531. [DOI] [PubMed] [Google Scholar]
- Xu M, Zhu J, Liu S, Wang C, Shi Q, Kuang Y, Fang X & Hu X 2019. FOXD3, frequently methylated in colorectal cancer, acts as a tumor suppressor and induces tumor cell apoptosis under ER stress via p53. Carcinogenesis. [DOI] [PubMed] [Google Scholar]
Associated Data
This section collects any data citations, data availability statements, or supplementary materials included in this article.
Supplementary Materials
Fig S1. Tumor samples from Carney triad and wt-GIST patients available for this study
CT: Carney triad; GIST: Gastrointestinal stromal tumor; PGL: Paraganglioma; PHEO: pheochromocytoma; wt: wild type. Black rectangles represent sample availability; grey rectangles show the type of analysis performed for each sample.
Fig S2. Profiles of the 6 samples with an alteration at the FOXD3 locus
Green line: profiles of the 6 samples with an alteration at the FOXD3 locus. For each panel: the upper channel represents the B-allele frequency (proportion of B allele); the lower channel represents the LogR (signal intensity).
Data Availability Statement
All relevant data are within the manuscript and its Supporting Information file. All numerical data generated during this article, underlying graphs or summary statistics, are available at https://doi.org/10.6084/m9.figshare.16439055.v1.