

Abstract
Background
Higher impact loading during walking is implicated in the pathogenesis of knee osteoarthritis. Accelerometry enables the measurement of peak tibial acceleration outside the laboratory. We characterized the relations of peak tibial acceleration to knee pain and impact loading during walking in adults with knee osteoarthritis.
Methods
Adults with knee osteoarthritis reported knee pain then walked at a self-selected speed on an instrumented treadmill for 3 minutes with an ankle-worn inertial measurement unit. Ground reaction forces and tibial acceleration data were sampled for 1 minute. Vertical impact peaks, and average and peak instantaneous load rates were determined and averaged across 10 steps. Peak tibial acceleration was extracted for all steps and averaged. Pearson’s correlations and multiple linear regression analyses assessed the relation of peak tibial acceleration to pain and impact loading metrics, independently and after controlling for gait speed and pain.
Findings
Higher peak tibial acceleration was associated with worse knee pain (r=0.39; p=0.01), and higher vertical average (r=0.40; p=0.01) and instantaneous (r=0.46; p=0.004) load rates. After adjusting for gait speed and pain, peak tibial acceleration was a significant predictor of vertical average (R2=0.33; p=0.003) and instantaneous (R2=0.28; p=0.02) load rates, but not strongly associated with vertical impact peak.
Interpretations
Peak tibial acceleration during walking is associated with knee pain and vertical load rates in those with knee osteoarthritis. Clinicians can easily access measures of peak tibial acceleration with wearable sensors equipped with accelerometers. Future work should determine the feasibility of improving patient outcomes by using peak tibial acceleration to inform clinical management.
1.0. Introduction
Knee osteoarthritis (OA) is a leading cause of disability in the United States,1,2 yet no disease modifying treatment exists. Pain, the most common symptom of knee OA, is associated with functional limitations3 and the primary reason patients seek clinical care.4 The mechanisms of OA-related pain are complex and likely contribute to the challenges in developing interventions that relieve pain. Because knee pain is often evoked by aberrant joint loading,5,6 the identification and modification of biomechanical risk factors associated with knee OA are a salient point of interest.
Amongst biomechanical risk factors, the external knee adduction moment (KAM) is widely studied because it is considered a surrogate measure of medial tibiofemoral joint loading and associated with the progression of knee OA.7,8 Various gait modification strategies for knee OA have effectively decreased KAM in laboratory environments,9–15 yet implementation in clinical settings remain elusive. The lack of clinical implementation can be attributed to a number of factors. These include the need for expensive equipment, long data processing time, and space associated with the motion capture environment required to deliver the intervention and evaluate joint kinetics and kinematics.
Impact loading, defined as the loading that occurs immediately after the foot contacts the ground, is another metric that may contribute to knee pain.16 Impact loading is quantified in terms of the magnitude and loading rate of the initial vertical ground reaction force peak (GRF). Importantly, the peak GRF has been noted to be a primary contributor to KAM.17,18 Higher impact loading is associated with cartilage damage and the prevalence of knee OA.19–21 Measurement of these force variables, similar to KAM, typically involve force plates or an instrumented treadmill which represent a potential barrier to clinical implementation.
Wearable inertial measurement units (IMUs) offer a more affordable and simple way to estimate impact loading via tibial accelerometry. Based on early work from Hennig and Lafortune22 and studies in runners, it is well understood that peak tibial acceleration (PTA; the maximum acceleration along the long axis of the tibia) occurs during the early stance phase of the gait cycle (Figure 1), and is associated with vertical load rates,23–26 and running-related injuries.27,28 As a result, gait modification interventions aimed to reduce PTA have been used to reduce lower extremity loading in runners.29,30 This relationship has yet to be determined in the context of knee OA but could have practical implications for the development of clinically accessible interventions that manage symptoms. Therefore, the relation of PTA during walking to pain and impact loading in adults with knee OA needs to be determined.
Figure 1.
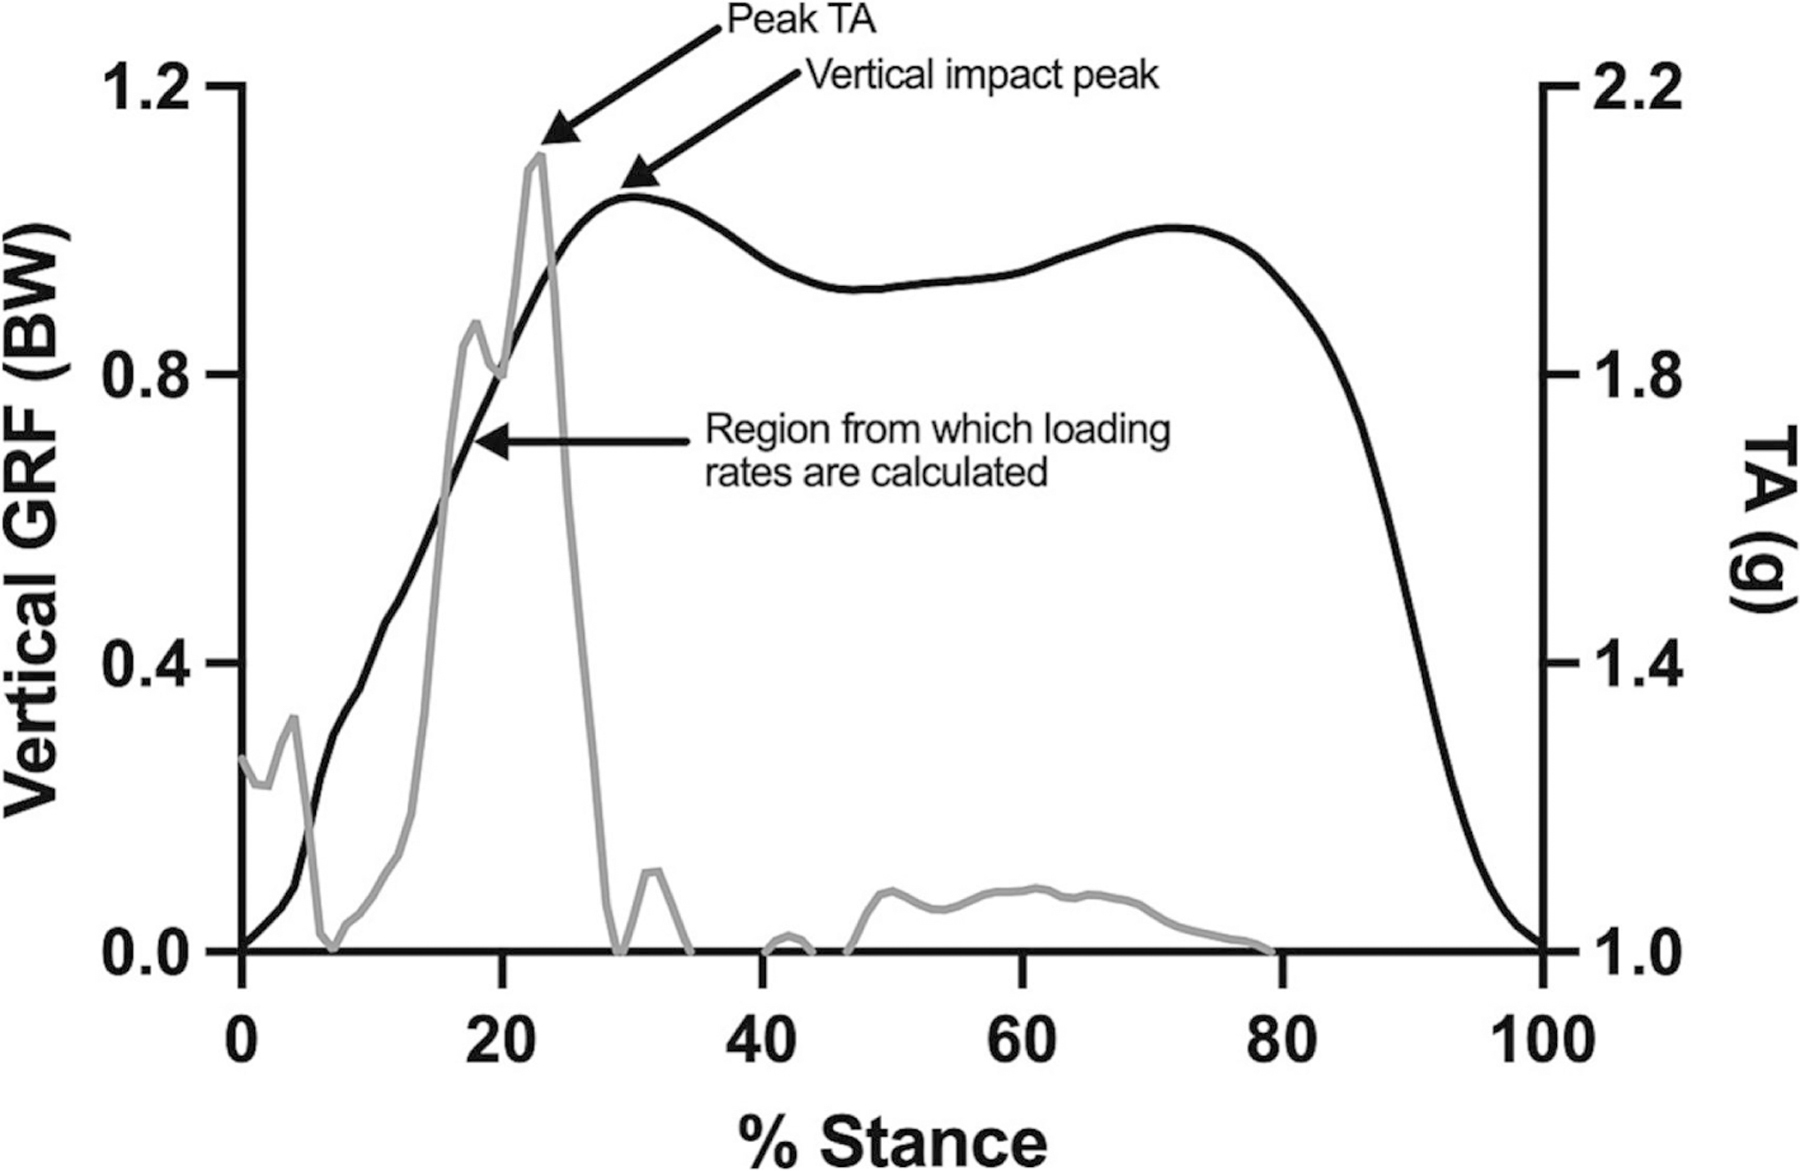
Representative data of vertical ground reaction force (GRF; black) and tibial acceleration (TA; grey)
The primary purpose of this study was to determine the relation of PTA to 1) knee pain severity, 2) vertical impact peaks, and 3) vertical average and instantaneous load rates while walking in adults with knee OA. After adjusting for gait speed and pain which are known to influence loading, we also aimed to determine whether PTA predicted impact loading metrics.
2.0. Methods
2.1. Participants
This study involved a convenience sample of participants from a randomized feasibility study.31 Participants were recruited from social media advertisements in the greater metropolitan area of Boston, MA. Those who met the National Institute for Health and Care Excellence (NICE) clinical definition of knee OA were enrolled. The NICE guidelines include individuals who are at least 45 years old; have had knee pain for at least 3 months; and have knee stiffness after periods of inactivity (e.g., sleeping) that lasts less than 30 minutes.32 In addition to these criteria, individuals were asked to rate the pain in each knee when walking from 0–10 (0 = no pain; 10 = worst pain imaginable) and included if they reported ≥ 3 out of 10 in either knee. Individuals were excluded if they walked with an assistive device, had a history of knee replacement or lower extremity surgery within the last year, or had any condition (e.g., neurological) that affected lower extremity function. Those who met the eligibility criteria provided verbal and written consent prior to participating. The study protocol was approved by the Institutional Review Board at Northeastern University (#18-05-11).
2.2. Procedures
Knee pain severity was assessed with the question, “How bad has the pain been in your knee, on average, in the past week?” and scored on a Visual Analog Scale (VAS). The VAS is a valid and reliable measure of pain intensity and often used in clinical settings and research of knee OA.33–35 Additionally, clinical use of the single-item VAS is relatively simple compared to longer questionnaires that require specific scoring methods. Participants responded for each knee separately by marking a 10 cm line where 0 cm represents “no pain” and 10 cm represents “worst possible pain”. The index knee was identified as the knee with the greatest amount of pain. When participants indicated equal pain severity for both knees, the index knee was identified by asking “Which knee causes more difficulty while walking?” and they were required to select right or left.
Participants wore standardized footwear (Gel-Excite 6, ASICS Corp., Kobe, Japan) and height and mass were measured using a stadiometer and digital scale, respectively. To determine gait speed, participants completed five, overground 10-m walk tests at their self-selected, comfortable speed. The speed of each trial was measured with timing gates (TCi system, Brower Timing Systems, LLC, Draper, UT, USA) from the middle 6-m to avoid initial acceleration and terminal deceleration.
An IMU (IMU Blue Thunder; IMeasureU Ltd., Auckland, New Zealand; dimensions: 40 mm x 30 mm x 15 mm, mass: 12 gm, acceleration range: ± 16 g) was firmly secured with a manufacturer-provided Velcro strap, immediately proximal and anterior to the medial malleolus of the index limb so that the y-axis of the sensor was aligned with the long axis of the tibia (Figure 2). Participants walked on an instrumented, split-belt treadmill (Bertec, Inc., Columbus, OH, USA) for a 5-minute warm-up and acclimation period. The treadmill speed was set to 85% of the participants average gait speed from the overground 10-m walk tests.36 The treadmill speed was lowered by an additional 10–23% for 6 participants who felt that the initial speed was too fast and not sustainable. Once a comfortable treadmill speed was set, participants walked for 3 minutes. Triaxial IMU data were sampled at 1000 Hz and GRFs were sampled at 1200 Hz during the last minute of the 3-minute walk.
Figure 2.
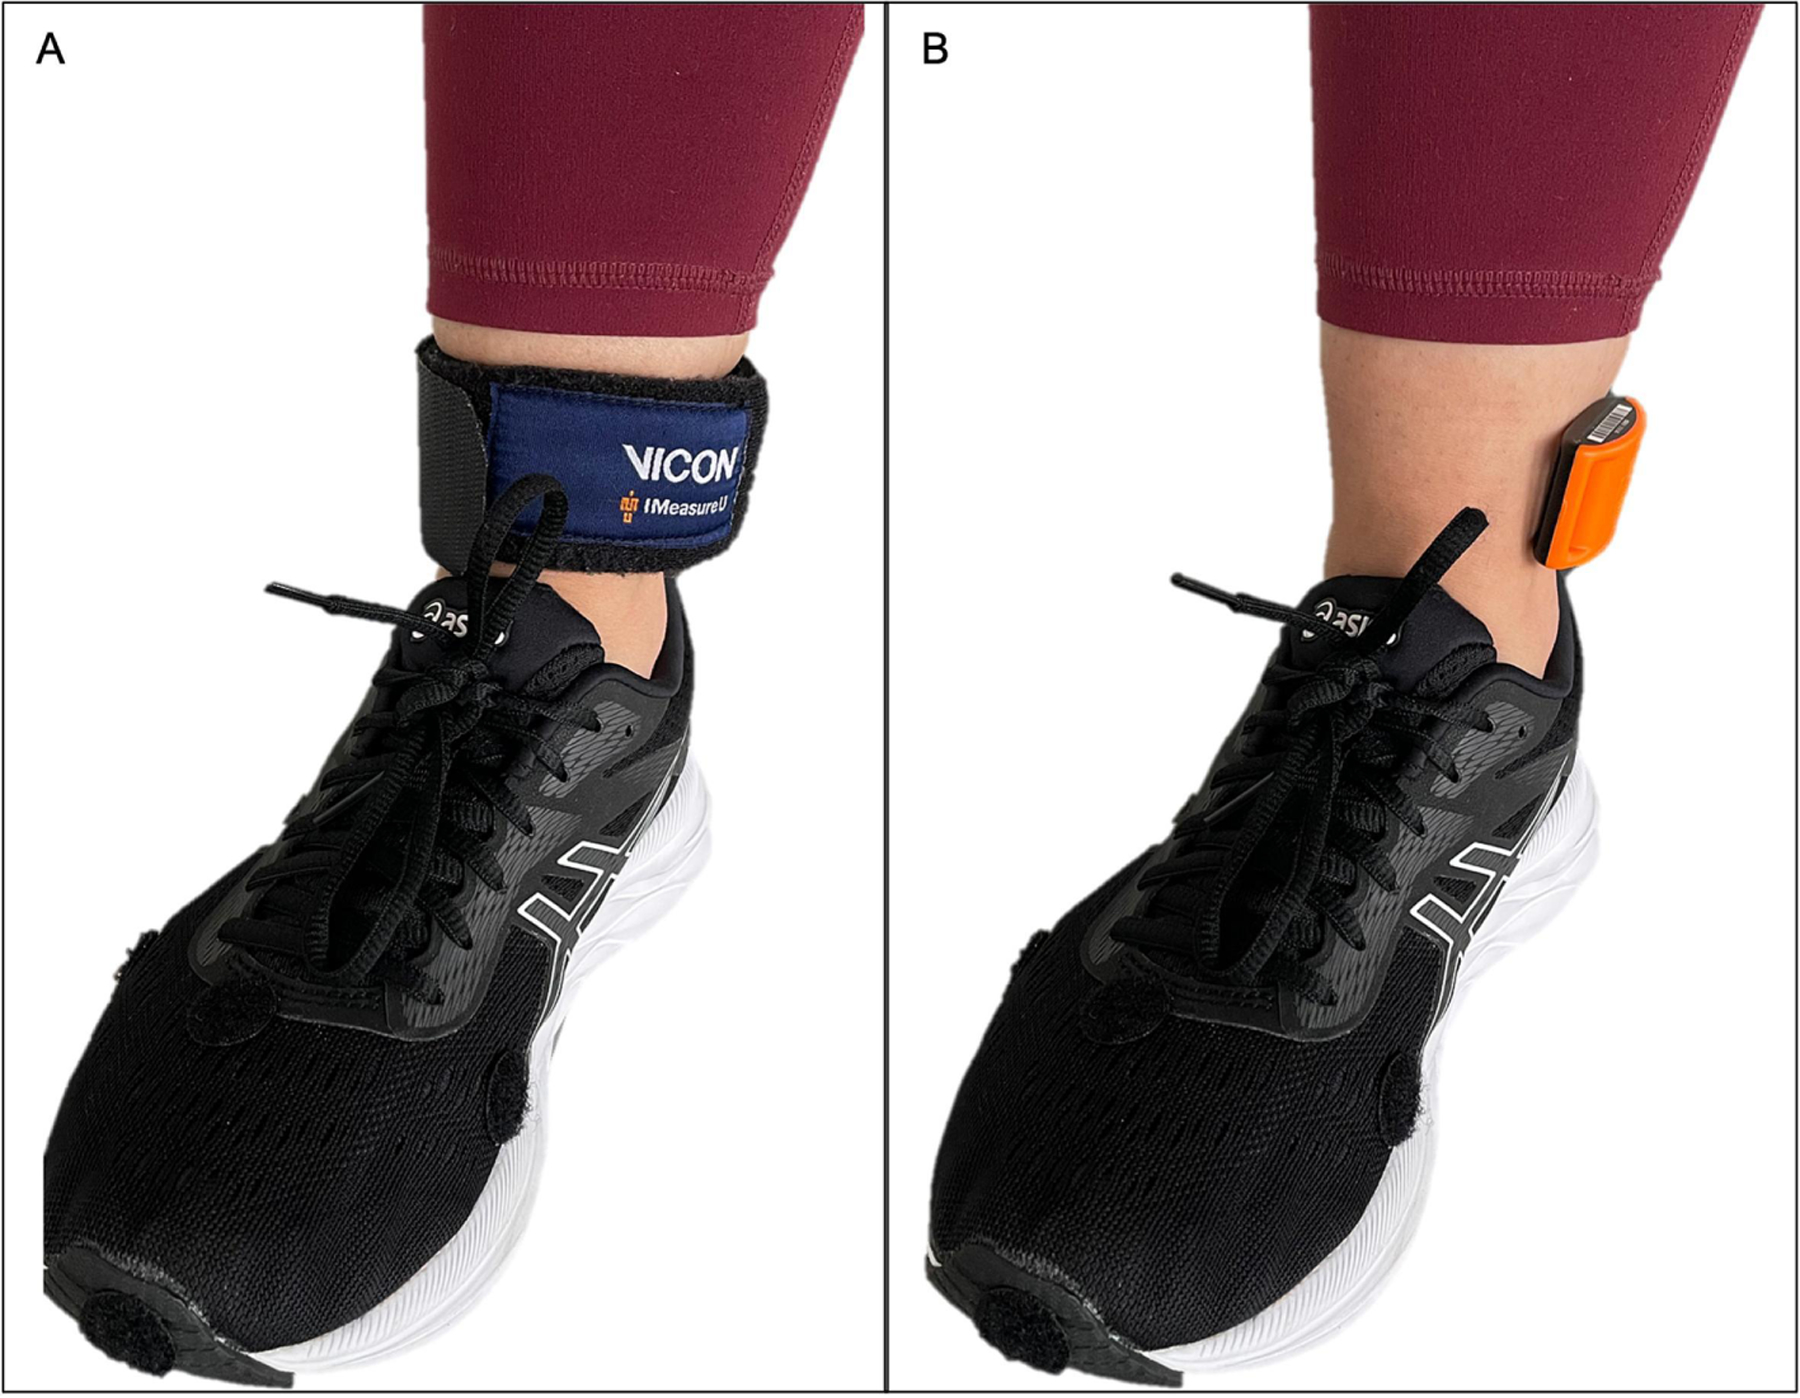
Placement of inertial measurement unit immediately proximal and anterior to the medial malleolus, with (A) and without (B) the strap provided by the manufacturer
2.3. Data Processing
A custom-written MATLAB program (MathWorks Inc., Natick, MA, USA) was used to process raw accelerations from the IMU. PTA was defined as the maximum acceleration along the y-axis and calculated for each step. Mean PTA was determined by averaging every step taken during the 1-minute trial, then normalized to gravitational equivalents (g) to account for acceleration due to gravity (g = −9.81 m/s2).
GRF data were processed with Visual3D software (C-Motion, Inc., Germantown, MD, USA) and trimmed to include 10 acceptable foot contacts. An acceptable foot contact was defined by having one foot on each belt during double limb support. Heel-strike and toe-off events were identified from trimmed GRF data that were low-pass filtered using a bidirectional 4th order Butterworth filter with a cut-off frequency of 12 Hz. The vertical impact peak (VIP) was defined as the maximum vertical force between heel-strike and mid-stance of the vertical GRF waveform. The vertical average loading rate (VALR) and vertical instantaneous loading rate (VILR) were calculated as the average and peak slope of the most linear portion from heel-strike to VIP.37 The VIP, VALR, and VILR were averaged across all 10 steps.
2.4. Statistical Analysis
Data from the index knee were analyzed for the current study. Continuous variables were presented as the mean ± standard deviation (SD). Data were checked for normality with Shapiro-Wilkes tests. Influential outliers were removed based on visual inspection of scatterplots. Pearson’s product-moment correlations were calculated to assess the relation of PTA to measures of knee pain and impact loading. Separate multiple linear regression models were used to assess the relation of PTA to each measure of impact loading, accounting for gait speed and knee pain. Predictors were added iteratively, starting with PTA, to assess the change in coefficient of determination (R2) with the addition of each variable. Prior to regression analyses, PTA, knee pain, and gait speed were investigated for collinearity by calculating variance inflation factors (VIFs). Model assumptions were assessed with q-q plots and scatterplots of residuals and predicted values. Results were considered statistically significant at p<0.05. All statistical analyses were performed with SAS software (version 9.3, SAS Institute, Cary, NC, USA).
3.0. Results
Forty-two adults were enrolled, and their characteristics are summarized in Table 1. IMU and VAS data were available in all 42 participants. Impact loading data were available in 40 of 42 participants; data were deemed missing or invalid due to lack of acceptable foot contacts for 2 participants. Three influential outliers were removed from the impact loading data for Pearson’s analyses. All model assumptions were met for the regression analyses and no multicollinearity was found (all VIFs < 1.3).38 Two influential outliers were removed for the models involving VALR and VILR, and four influential outliers were removed for the model involving VIP.
Table 1.
Demographics and clinical characteristics of participants with clinically defined knee OA (n=42)
| Age, years | 60.4 ± 12.6 |
| Female, % | 66.7 |
| Height, cm | 168.4 ± 9.8 |
| Mass, kg | 85.1 ± 20.0 |
| Body mass index, kg/m2 | 30.0 ± 6.8 |
| Treadmill gait speed, m/s | 1.1 ± 0.2 |
| Peak vertical tibial acceleration, g | 2.4 ± 0.4 |
| Knee pain severity, 0–100 mm Visual Analog Scale | 50.3 ± 20.1 |
| Vertical impact peak, BW | 1.1 ± 0.1 |
| Vertical average loading rate, BW/s | 9.5 ± 2.4 |
| Vertical instantaneous loading rate, BW/s | 12.8 ± 3.1 |
Variables are described as mean ± standard deviation unless noted otherwise
The correlation results for PTA, knee pain, and impact loading are shown in Table 2. Higher PTA was significantly associated with worse VAS knee pain (r=0.39). PTA was not found to be significantly associated with VIP (r=0.28). The strongest associations were found between PTA and vertical load rates. Higher PTA was significantly associated with VALR (r=0.40) and VILR (r=0.46).
Table 2.
Correlations between peak vertical tibial acceleration, knee pain, and impact loading variables
| PTA | ||
|---|---|---|
| Correlation coefficient | p-value | |
| VAS, 0–100 mm | 0.39 | 0.01 |
| VIP, BW | 0.28 | 0.10 |
| VALR, BW/s | 0.40 | 0.01 |
| VILR, BW/s | 0.46 | 0.004 |
VAS, Visual Analog Scale
VIP, Vertical Impact Peak
VALR, Vertical Average Loading Rate
VILR, Vertical Instantaneous Loading Rate
After adjusting for gait speed and pain, multiple linear regression analyses showed that PTA was a significant predictor of vertical load rates, but not VIP (Table 3). Approximately 5% of the variability of VIP was explained by PTA alone. Gait speed and pain explained an additional 28% and 4% of variability in VIP, respectively. Every 1.0 g increase in PTA accounted for a 0.06 BW increase in VIP, after adjusting for gait speed and pain. Approximately 12% of the variability of VALR was explained by PTA alone. Gait speed and pain explained an additional 15% and 6% of variability in VALR, respectively. Every 1.0 g increase in PTA accounted for a 2.68 BW/s increase in VALR, after adjusting for gait speed and pain. Approximately 27% of the variability of VILR was explained by PTA alone. Gait speed and pain explained an additional 1% of variability in VILR. Every 1.0 g increase in PTA accounted for a 3.71 BW/s increase in VILR, after adjusting for gait speed and pain.
Table 3.
Multiple linear regression analyses of peak vertical tibial acceleration, gait speed, and knee pain as predictors for impact loading variables
| Dependent Variable; Full Model Results | Predictors | Unstandardized β coefficient | Standard Error | R2 Change | 95% CI | p-value |
|---|---|---|---|---|---|---|
|
VIP R2 = 0.36 F(3, 36) = 6.19, p = 0.001 |
PTA | 0.06 | 0.04 | 0.05 | −0.02, 1.13 | 0.13 |
| Gait speed | 0.28 | 0.08 | 0.27 | 0.10, 0.45 | <0.01 | |
| Pain | <0.00 | <0.00 | 0.04 | −0.00, 0.01 | 0.14 | |
|
VALR R2 = 0.33 F(3, 36) = 5.49, p = 0.003 |
PTA | 2.68 | 1.05 | 0.12 | 0.54, 4.81 | 0.02 |
| Gait speed | 5.79 | 2.24 | 0.15 | 0.83, 10.75 | 0.02 | |
| Pain | −0.03 | 0.02 | 0.06 | −0.07, 0.01 | 0.09 | |
|
VILR R2 = 0.28 F(3, 34) = 3.88, p = 0.02 |
PTA | 3.71 | 1.19 | 0.27 | 1.28, 6.13 | <0.01 |
| Gait speed | 1.29 | 3.03 | <0.01 | −4.88, 7.47 | 0.67 | |
| Pain | −0.00 | 0.02 | <0.01 | −0.04, 0.04 | 0.86 |
VAS, Visual Analog Scale
VIP, Vertical Impact Peak
VALR, Vertical Average Loading Rate
VILR, Vertical Instantaneous Loading Rate
4.0. Discussion
The purpose of this cross-sectional study was to determine the relation of PTA to knee pain and impact loading during walking in adults with clinically defined knee OA. Our results suggest that an individual who walks with a higher PTA may have higher knee pain and higher vertical load rates. In addition, we found PTA to account for 28–33% of the variability in vertical load rates after adjusting for gait speed and knee pain. Thus, PTA may be an acceptable surrogate measure of impact loading that can be used in clinical environments, and in the development of rehabilitation treatments to manage symptoms of knee OA.
Previous investigations reporting PTA during walking in the knee OA population are limited. Turpin et al examined PTA of individuals with medial tibiofemoral OA before inserting shock-absorbing insoles in their usual shoes.39 Christiansen et al measured PTA of individuals with end-stage knee OA during the first and last minutes of a 6-minute walk test, within 2 weeks of receiving unilateral knee arthroplasty.40 Together these studies reported mean PTAs are approximately 1 SD (0.4 g) lower compared to our participants. Methodology differences in the accelerometer attachment and placement methods, as well as the gait analysis, may explain the higher PTA that we reported. In the prior studies, skin-mounted accelerometers were attached to the tibial tuberosity, compared to the current study which used an IMU placed above the medial malleolus. In addition, the gait analysis in the prior studies were assessed over 5 overground walking trials39 and 8 steps from a 6-minute walk test,40 compared to 60 seconds of treadmill walking in the current study. Since peak accelerations are higher with distal accelerometer placement compared to proximal,41 and during treadmill running compared to overground,42 the difference in PTAs reported are both reasonable and expected.
The association between PTA and VAS knee pain identified in the current study are consistent with a previous study that examined PTA during overground walking in knee OA patients, before and after pain relief.43 In this study, PTA and VAS pain significantly decreased from 2.0 g and 37 mm to 1.76 g and 1.8 mm, respectively, after local analgesia (10 ml lidocaine) was injected into the knee joint. This supports the notion that higher PTA is related to greater pain. With regards to the association between PTA and impact loading, results from the current study are similar to previous reports in runners. For instance, Tenforde et al reported moderate to strong correlations between PTA and vertical load rates in injured runners (r = 0.66–0.82),44 while others have reported slightly stronger correlations in healthy runnerPs (rre=-p0.r7o0o-0f.95).23,24,26 Variability in the strength of the correlation can be explained by several non-standardized factors, including running speed, fatigue, footstrike pattern, accelerometer attachment methods and placement, and running surface.45,46 As indicated in our regression models, some variance in vertical load rates remains unexplained by PTA, gait speed, and knee pain. Thus, further research is needed to identify the factors relevant to knee OA.
Our findings highlight the clinical applicability of using PTA as a surrogate measure for impact loading, particularly vertical load rates. There is growing interest in the development of treatments utilizing gait modification strategies that aim to address the aberrant impact loading characteristics and pain that manifests from knee OA. Previously reported gait modification interventions, though effective, have used methods cannot be easily implemented outside of a laboratory setting.11 In these interventions, reductions in the external knee adduction moment were obtained by modifying foot progression angle, increasing medial knee thrust, and increasing trunk lean with real-time biofeedback delivered via motion capture technology and force plates. Alternatively, commercially available IMUs offer the opportunity to simultaneously deliver real-time biofeedback and assess impact loading, by proxy of PTA, in a clinical or free-living environment using significantly less time and resources.
Prior gait modification interventions in runners have demonstrated that reductions in PTA is a motor pattern that can be taught and learned.29,30,47 Whether individuals with knee OA can feasibly reduce PTA while walking without exacerbating symptoms is unknown but holds potential as a treatment strategy. If the magnitude or rate of impact loading is reduced, then the amount of load transmitted to the knee joint may also reduce. In the absence of normative PTA data for knee OA, future research can also consider who may benefit most from this strategy (e.g., treatment responders and non-responders), and what percent reduction in PTA is both feasible and clinically meaningful. Using data from the current study as an example, individuals with mean PTA ≥ 2.4 g (i.e., 50th percentile) may be “treatment responders” because they have the most room to reduce PTA, compared to the individuals with the lowest mean PTA.
The results should be interpreted with consideration of several limitations. As with any study, there were a number of unmeasured factors (e.g., joint malalignment, type of OA and severity) that may introduce bias to the strength of the correlations reported. These variables may be considered in future research. Our gait analysis was performed on a treadmill and whether our findings transfer to outdoor or overground walking remains unknown. Additionally, the current study examined PTA and impact loading in the index limb only because patients typically seek clinical care for the symptomatic knee. It is conceivable that the associations between PTA and impact loading may differ if taking bilateral pain into consideration. Finally, the VAS is a more global assessment of knee pain that does not measure specific locations or patterns of pain. Similarly, both PTA and the impact loading variables are more representative of lower extremity movement patterns and not knee-specific measures. However, knee-specific measures require costly and cumbersome measurement techniques in comparison to measuring PTA with commercially available wearable devices.
5.0. Conclusion
This is the first study to characterize the relationship between PTA, knee pain, and impact loading metrics during walking in knee OA. Our analyses demonstrate that PTA is significantly associated with knee pain and vertical load rates, but not the vertical impact peak. Given the potential for clinical implementation, future work examining the effects of modifying PTA on pain and impact loading is warranted.
Highlights.
Pain and aberrant loading while walking is present in knee osteoarthritis
Tibial acceleration was explored as a clinically accessible measure for loading
Higher peak tibial acceleration was associated with worse knee pain
Higher peak tibial acceleration was associated with higher vertical load rates
Funding
Research reported in this publication was supported by the National Institute of Arthritis and Musculoskeletal and Skin Diseases of the National Institutes of Health under Award Number K23AR070913. The content is solely the responsibility of the authors and does not necessarily represent the official views of the National Institutes of Health. The sponsor had no role in the study design, collection, analysis and interpretation of data, writing the manuscript, or the decision to submit for publication.
Footnotes
Publisher's Disclaimer: This is a PDF file of an unedited manuscript that has been accepted for publication. As a service to our customers we are providing this early version of the manuscript. The manuscript will undergo copyediting, typesetting, and review of the resulting proof before it is published in its final form. Please note that during the production process errors may be discovered which could affect the content, and all legal disclaimers that apply to the journal pertain.
Declaration of interests
The authors declare the following financial interests/personal relationships which may be considered as potential competing interests:
Joshua Stefanik reports financial support was provided by National Institute of Arthritis and Musculoskeletal and Skin Diseases.
References
- 1.Lawrence RC, Felson DT, Helmick CG, et al. Estimates of the prevalence of arthritis and other rheumatic conditions in the United States. Part II. Arthritis Rheum 2008;58(1):26–35. doi: 10.1002/art.23176 [DOI] [PMC free article] [PubMed] [Google Scholar]
- 2.Ma VY, Chan L, Carruthers KJ. Incidence, prevalence, costs, and impact on disability of common conditions requiring rehabilitation in the United States: stroke, spinal cord injury, traumatic brain injury, multiple sclerosis, osteoarthritis, rheumatoid arthritis, limb loss, and back pain. Arch Phys Med Rehabil 2014;95(5). doi: 10.1016/J.APMR.2013.10.032 [DOI] [PMC free article] [PubMed] [Google Scholar]
- 3.White DK, Neogi T, Nguyen USDT, Niu J, Zhang Y. Trajectories of functional decline in knee osteoarthritis: The osteoarthritis initiative. Rheumatology (United Kingdom) 2016;55(5):801–808. doi: 10.1093/rheumatology/kev419 [DOI] [PMC free article] [PubMed] [Google Scholar]
- 4.Neogi T The Epidemiology and Impact of Pain in Osteoarthritis. Osteoarthritis and cartilage / OARS, Osteoarthritis Research Society 2013;21(9):1145. doi: 10.1016/J.JOCA.2013.03.018 [DOI] [PMC free article] [PubMed] [Google Scholar]
- 5.Vincent KR, Conrad BP, Fregly BJ, Vincent HK. The Pathophysiology of Osteoarthritis: A Mechanical Perspective on the Knee Joint. PM and R 2012;4(5 SUPPL.):S3. doi: 10.1016/j.pmrj.2012.01.020 [DOI] [PMC free article] [PubMed] [Google Scholar]
- 6.Felson DT. Osteoarthritis as a disease of mechanics. Osteoarthritis Cartilage 2013;21(1):10–15. doi: 10.1016/j.joca.2012.09.012 [DOI] [PMC free article] [PubMed] [Google Scholar]
- 7.Baliunas AJ, Hurwitz DE, Ryals AB, et al. Increased knee joint loads during walking are present in subjects with knee osteoarthritis. Osteoarthritis Cartilage 2002;10(7):573–579. doi: 10.1053/joca.2002.0797 [DOI] [PubMed] [Google Scholar]
- 8.Miyazaki T, Wada M, Kawahara H, Sato M, Baba H, Shimada S. Dynamic load at baseline can predict radiographic disease progression in medial compartment knee osteoarthritis. Ann Rheum Dis 2002;61(7):617–622. doi: 10.1136/ard.61.7.617 [DOI] [PMC free article] [PubMed] [Google Scholar]
- 9.Shull PB, Silder A, Shultz R, et al. Six-week gait retraining program reduces knee adduction moment, reduces pain, and improves function for individuals with medial compartment knee osteoarthritis. Journal of Orthopaedic Research 2013;31(7):1020–1025. doi: 10.1002/jor.22340 [DOI] [PubMed] [Google Scholar]
- 10.Richards R, van den Noort JC, van der Esch M, Booij MJ, Harlaar J. Gait retraining using real-time feedback in patients with medial knee osteoarthritis: Feasibility and effects of a six-week gait training program. Knee 2018;25(5):814–824. doi: 10.1016/j.knee.2018.05.014 [DOI] [PubMed] [Google Scholar]
- 11.Simic M, Hinman RS, Wrigley TV., Bennell KL, Hunt MA. Gait modification strategies for altering medial knee joint load: A systematic review. Arthritis Care Res (Hoboken) 2011;63(3):405–426. doi: 10.1002/acr.20380 [DOI] [PubMed] [Google Scholar]
- 12.Edd SN, Bennour S, Ulrich B, Jolles BM, Favre J. Modifying stride length in isolation and in combination with foot progression angle and step width can improve knee kinetics related to osteoarthritis; A preliminary study in healthy subjects. J Biomech Eng 2020;142(7). doi: 10.1115/1.4046713 [DOI] [PubMed] [Google Scholar]
- 13.Hunt MA, Simic M, Hinman RS, Bennell KL, Wrigley TV. Feasibility of a gait retraining strategy for reducing knee joint loading: Increased trunk lean guided by real-time biofeedback. J Biomech 2011;44(5):943–947. doi: 10.1016/j.jbiomech.2010.11.027 [DOI] [PubMed] [Google Scholar]
- 14.Hunt MA, Takacs J. Effects of a 10-week toe-out gait modification intervention in people with medial knee osteoarthritis: A pilot, feasibility study. Osteoarthritis Cartilage 2014;22(7):904–911. doi: 10.1016/j.joca.2014.04.007 [DOI] [PubMed] [Google Scholar]
- 15.Barrios JA, Crossley KM, Davis IS. Gait retraining to reduce the knee adduction moment through real-time visual feedback of dynamic knee alignment. J Biomech 2010;43(11):2208–2213. doi: 10.1016/j.jbiomech.2010.03.040 [DOI] [PMC free article] [PubMed] [Google Scholar]
- 16.Radin EL, Yang KH, Riegger C, Kish VL, O’Connor JJ. Relationship between lower limb dynamics and knee joint pain. Journal of Orthopaedic Research 1991;9(3):398–405. doi: 10.1002/jor.1100090312 [DOI] [PubMed] [Google Scholar]
- 17.Hunt MA, Birmingham TB, Giffin JR, Jenkyn TR. Associations among knee adduction moment, frontal plane ground reaction force, and lever arm during walking in patients with knee osteoarthritis. J Biomech 2006;39(12):2213–2220. doi: 10.1016/j.jbiomech.2005.07.002 [DOI] [PubMed] [Google Scholar]
- 18.Schmitz A, Noehren B. What predicts the first peak of the knee adduction moment? Published online 2014. doi: 10.1016/j.knee.2014.07.016 [DOI] [PMC free article] [PubMed]
- 19.Simon SR, Radin EL, Paul IL, Rose RM. The response of joints to impact loading - II In vivo behavior of subchondral bone. J Biomech 1972;5(3):267–272. doi: 10.1016/0021-9290(72)90042-5 [DOI] [PubMed] [Google Scholar]
- 20.Collins JJ, Whittle MW. Impulsive forces during walking and their clinical implications. Clinical Biomechanics 1989;4(3):179–187. doi: 10.1016/0268-0033(89)90023-5 [DOI] [PubMed] [Google Scholar]
- 21.Mündermann A, Dyrby CO, Andriacchi TP. Secondary gait changes in patients with medial compartment knee osteoarthritis: Increased load at the ankle, knee, and hip during walking. Arthritis Rheum 2005;52(9):2835–2844. doi: 10.1002/art.21262 [DOI] [PubMed] [Google Scholar]
- 22.Lafortune M, Hennig E. Contribution of angular motion and gravity to tibial acceleration. Med Sci Sports Exerc 1991;23(3):360–363. [PubMed] [Google Scholar]
- 23.Hennig EM, Milani TL, Lafortune MA. Use of Ground Reaction Force Parameters in Predicting Peak Tibial Accelerations in Running. J Appl Biomech 1993;9(4):306–314. doi: 10.1123/JAB.9.4.306 [DOI] [PubMed] [Google Scholar]
- 24.Laughton CA, McClay Davis I, Hamill J. Effect of strike pattern and orthotic intervention on tibial shock during running. J Appl Biomech 2003;19(2):153–168. doi: 10.1123/jab.19.2.153 [DOI] [Google Scholar]
- 25.Greenhalgh A, Sinclair J, Protheroe L, Chockalingam N. Predicting Impact Shock Magnitude: Which Ground Reaction Force Variable Should We Use? ISSN International Journal of Sports Science and Engineering 2012;06(04):1750–9823. [Google Scholar]
- 26.Van den Berghe P, Six J, Gerlo J, Leman M, De Clercq D. Validity and reliability of peak tibial accelerations as real-time measure of impact loading during over-ground rearfoot running at different speeds. J Biomech 2019;86:238–242. doi: 10.1016/j.jbiomech.2019.01.039 [DOI] [PubMed] [Google Scholar]
- 27.Davis I, Milner CE, Hamill J. Does Increased Loading During Running Lead to Tibial Stress Fractures? A Prospective Study. Med Sci Sports Exerc 2004;36(Supplement):S58. doi: 10.1249/00005768-200405001-00271 [DOI] [Google Scholar]
- 28.Milner CE, Ferber R, Pollard CD, Hamill J, Davis IS. Biomechanical factors associated with tibial stress fracture in female runners. Med Sci Sports Exerc 2006;38(2):323–328. doi: 10.1249/01.MSS.0000183477.75808.92 [DOI] [PubMed] [Google Scholar]
- 29.Crowell HP, Milnert CE, Hamill J, Davis IS. Reducing impact loading during running with the use of real-time visual feedback. Journal of Orthopaedic and Sports Physical Therapy 2010;40(4):206–213. doi: 10.2519/JOSPT.2010.3166/ASSET/IMAGES/LARGE/JOSPT-206-FIG006.JPEG [DOI] [PubMed] [Google Scholar]
- 30.Crowell HP, Davis IS. Gait retraining to reduce lower extremity loading in runners. Clinical Biomechanics 2011;26(1):78–83. doi: 10.1016/j.clinbiomech.2010.09.003 [DOI] [PMC free article] [PubMed] [Google Scholar]
- 31.Corrigan P, Davis IS, James KA, Crossley KM, Stefanik JJ. Reducing knee pain and loading with a gait retraining program for individuals with knee osteoarthritis: Protocol for a randomized feasibility trial. Osteoarthr Cartil Open 2020;2(4):100097. doi: 10.1016/j.ocarto.2020.100097 [DOI] [PMC free article] [PubMed] [Google Scholar]
- 32.Skou ST, Koes BW, Grønne DT, Young J, & Roos EM, Skou ST, Koes BW, Grønne DT, Young J, Roos EM. Comparison of three sets of clinical classification criteria for knee osteoarthritis: a cross-sectional study of 13,459 patients treated in primary care. Osteoarthritis Cartilage 2020;28(2):167–172. doi: 10.1016/j.joca.2019.09.003 [DOI] [PubMed] [Google Scholar]
- 33.Alghadir AH, Anwer S, Iqbal A, Iqbal ZA. Test–retest reliability, validity, and minimum detectable change of visual analog, numerical rating, and verbal rating scales for measurement of osteoarthritic knee pain. J Pain Res 2018;11:851. doi: 10.2147/JPR.S158847 [DOI] [PMC free article] [PubMed] [Google Scholar]
- 34.Hawker GA, Mian S, Kendzerska T, French M. Measures of adult pain: Visual Analog Scale for Pain (VAS Pain), Numeric Rating Scale for Pain (NRS Pain), McGill Pain Questionnaire (MPQ), Short-Form McGill Pain Questionnaire (SF-MPQ), Chronic Pain Grade Scale (CPGS), Short Form-36 Bodily Pain Scale (SF. Arthritis Care Res (Hoboken) 2011;63(SUPPL. 11):240–252. doi: 10.1002/acr.20543 [DOI] [PubMed] [Google Scholar]
- 35.da Costa BR, Saadat P, Basciani RM, Agarwal A, Johnston BC, Jüni P. Visual Analogue Scale has higher assay sensitivity than WOMAC pain in detecting between-group differences in treatment effects: a meta-epidemiological study. Osteoarthritis CartiPlargee -p20r2o1o;2f9(3):304–312. doi: 10.1016/j.joca.2020.10.004 [DOI] [PubMed] [Google Scholar]
- 36.Nagano H, Begg RK, Sparrow WA, Taylor S. A comparison of treadmill and overground walking effects on step cycle asymmetry in young and older individuals. J Appl Biomech 2013;29(2):188–193. [DOI] [PubMed] [Google Scholar]
- 37.Futrell EE, Jamison ST, Tenforde AS, Davis IS. Relationships between Habitual Cadence, Footstrike, and Vertical Load Rates in Runners. Med Sci Sports Exerc 2018;50(9):1837–1841. doi: 10.1249/MSS.0000000000001629 [DOI] [PubMed] [Google Scholar]
- 38.Kim JH. Multicollinearity and misleading statistical results. Korean J Anesthesiol 2019;72(6):558–569. doi: 10.4097/kja.19087 [DOI] [PMC free article] [PubMed] [Google Scholar]
- 39.Turpin KM, De Vincenzo A, Apps AM, et al. Biomechanical and Clinical Outcomes With Shock-Absorbing Insoles in Patients With Knee Osteoarthritis: Immediate Effects and Changes After 1 Month of Wear. Arch Phys Med Rehabil 2012;93(3):503–508. doi: 10.1016/J.APMR.2011.09.019 [DOI] [PubMed] [Google Scholar]
- 40.Christiansen C, Bade M, Paxton R, Stevens-Lapsley J. Measuring movement symmetry using tibial-mounted accelerometers for people recovering from total knee arthroplasty Cory. Clinical Biomechanics 2015;30(7):732–737. doi: 10.1016/j.clinbiomech.2015.04.013 [DOI] [PMC free article] [PubMed] [Google Scholar]
- 41.Lucas-Cuevas AG, Encarnación-Martínez A, Camacho-García A, Llana-Belloch S, Pérez-Soriano P. The location of the tibial accelerometer does influence impact acceleration parameters during running. J Sports Sci 2017;35(17):1734–1738. doi: 10.1080/02640414.2016.1235792 [DOI] [PubMed] [Google Scholar]
- 42.Aubol KG, Hawkins JL, Milner CE. Tibial acceleration reliability and minimal detectable difference during overground and treadmill running. J Appl Biomech 2020;36(6):457–459. doi: 10.1123/JAB.2019-0272 [DOI] [PubMed] [Google Scholar]
- 43.Henriksen M, Simonsen EB, Graven-Nielsen T, Lund H, Danneskiold-Samsøe B, Bliddal H. Impulse-forces during walking are not increased in patients with knee osteoarthritis. Acta Orthop 2006;77(4):650–656. doi: 10.1080/17453670610012747 [DOI] [PubMed] [Google Scholar]
- 44.Tenforde AS, Hayano T, Jamison ST, Outerleys J, Davis IS. Tibial Acceleration Measured from Wearable Sensors Is Associated with Loading Rates in Injured Runners. PM and R 2020;12(7):679–684. doi: 10.1002/PMRJ.12275 [DOI] [PubMed] [Google Scholar]
- 45.Sheerin KR, Reid D, Besier TF. The measurement of tibial acceleration in runners-A review of the factors that can affect tibial acceleration during running and evidence-based guidelines for its use. Gait Posture 2019;67:12–24. doi: 10.1016/J.GAITPOST.2018.09.017 [DOI] [PubMed] [Google Scholar]
- 46.Johnson CD, Outerleys J, Tenforde AS, Davis IS. A comparison of attachment methods of skin mounted inertial measurement units on tibial accelerations. J Biomech 2020;113. doi: 10.1016/J.JBIOMECH.2020.110118 [DOI] [PubMed]
- 47.Bowser BJ, Fellin R, Milner CE, Pohl MB, Davis IS. Reducing Impact Loading in Runners: A One-Year Follow-up. Med Sci Sports Exerc 2018;50(12):2500. doi: 10.1249/MSS.0000000000001710 [DOI] [PMC free article] [PubMed] [Google Scholar]