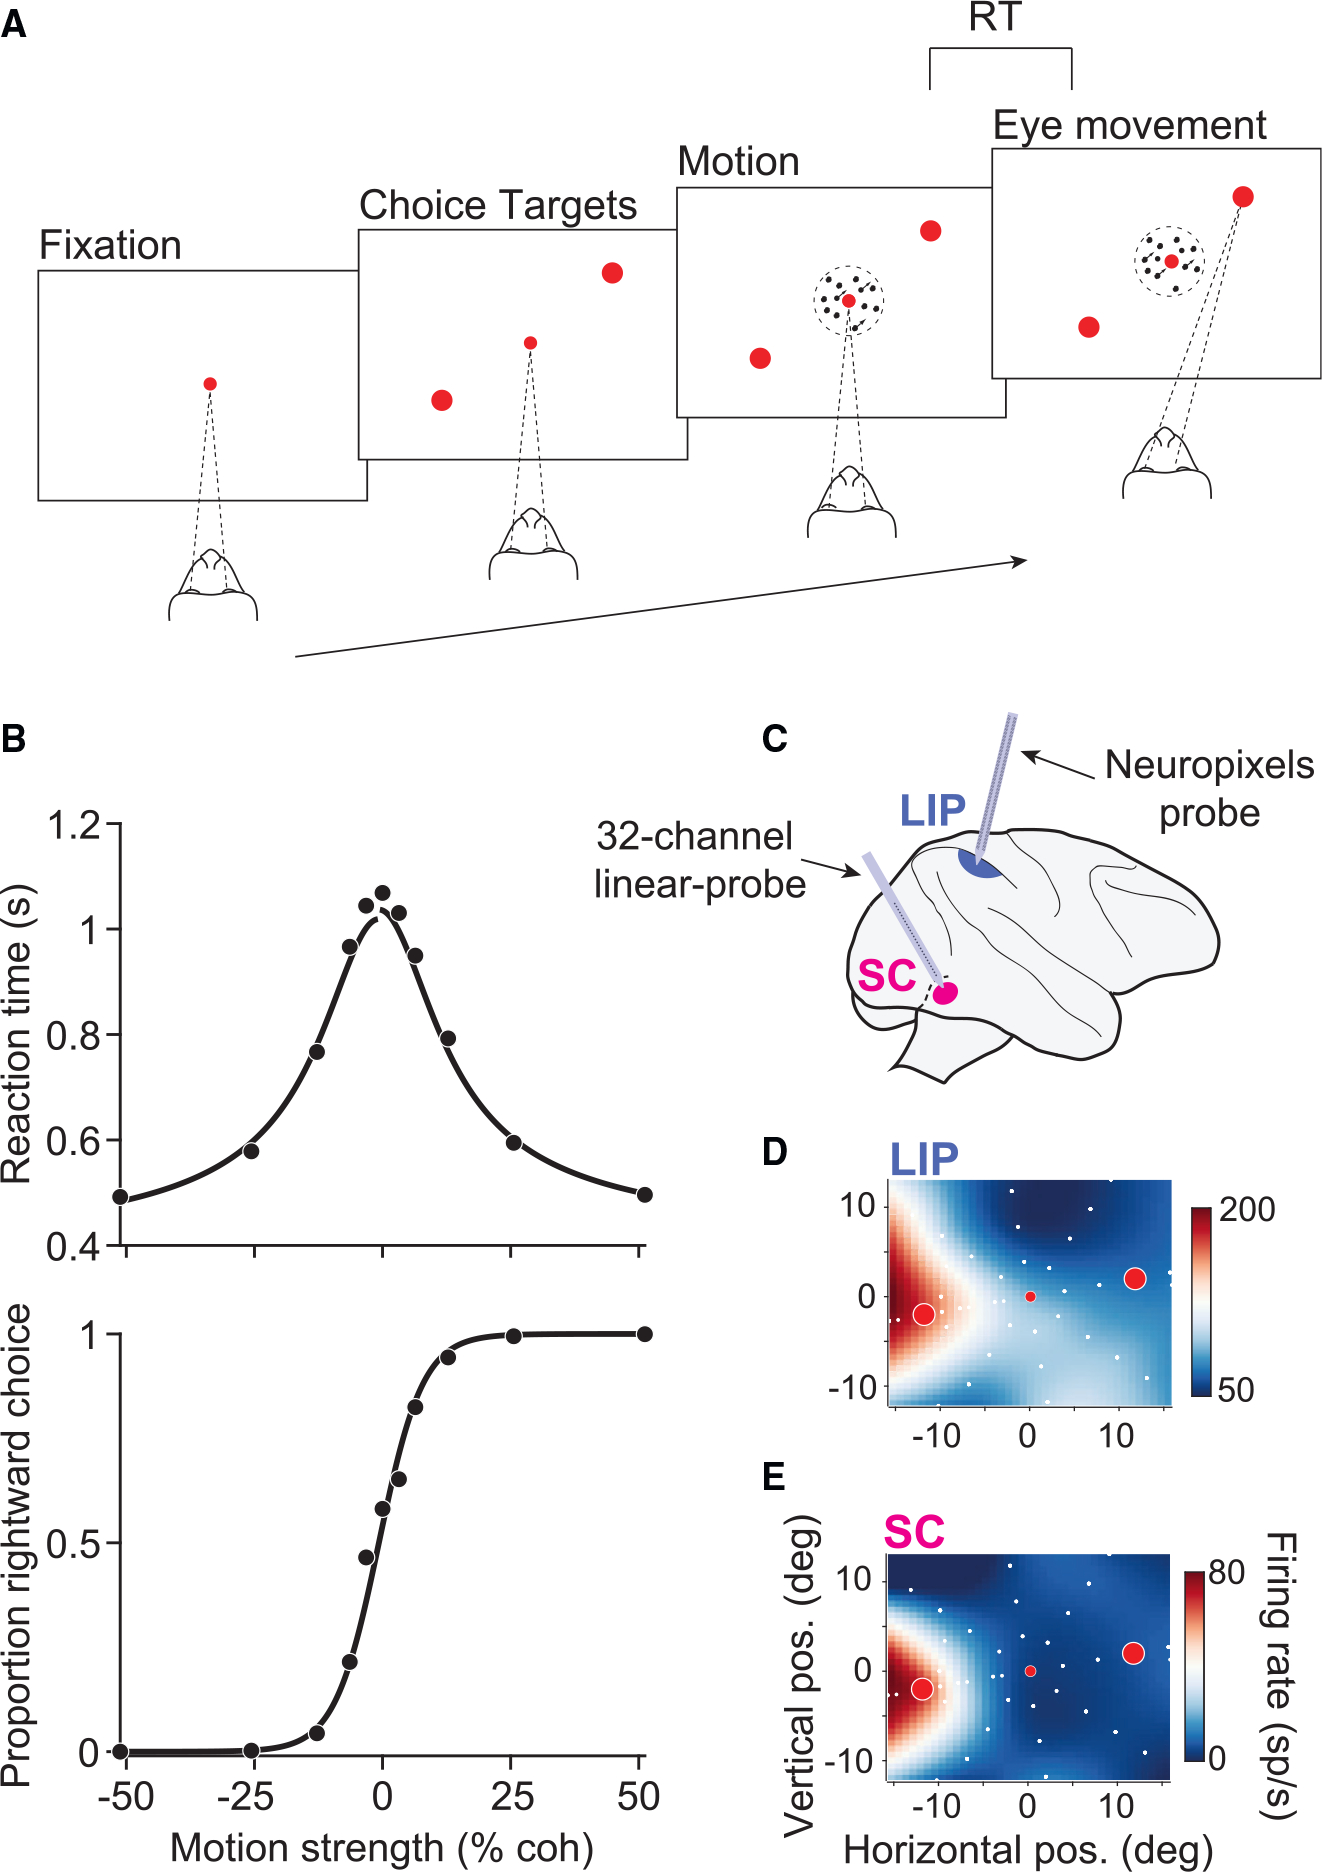
Figure 1. Behavioral task and experimental setup.

(A) RT motion discrimination task. Upon fixation and onset of the choice targets, a random-dot-motion stimulus appeared in the center of the display. Two monkeys discriminated the direction of motion and, when ready, indicated their choice with a saccade to one of two choice targets.
(B) Behavioral data pooled across all sessions and both monkeys (19,749 trials). RT (top) and the proportion of rightward choices (bottom) are plotted as a function of motion strength. Positive and negative motion strengths indicate rightward and leftward motion, respectively. Solid curves depict fits of a bounded evidence-accumulation model.
(C) Simultaneous recordings in SC and LIP. Populations of neurons were recorded in SC with a multi-channel V-probe and in LIP with a prototype macaque-Neuropixels probe.
(D) The RF of an example LIP neuron. The color map depicts the mean firing rate, interpolated across target locations (white circles), during the delay epoch of a visually guided saccade task. Red circles depict the location of the choice targets in the RDM task in this session.
(E) The RF of an example neuron in SC, recorded simultaneously as the example LIP neuron in (D).
