

SUMMARY
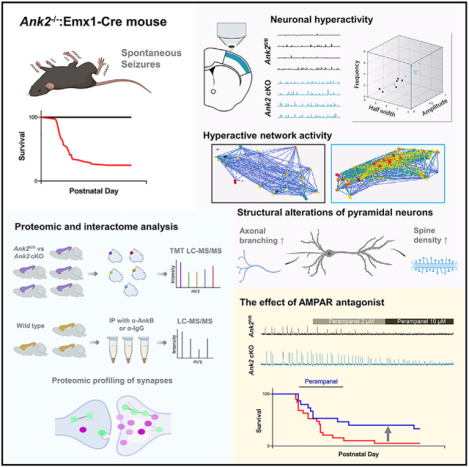
Rare genetic variants in ANK2, which encodes ankyrin-B, are associated with neurodevelopmental disorders (NDDs); however, their pathogenesis is poorly understood. We find that mice with prenatal deletion in cortical excitatory neurons and oligodendrocytes (ANK2−/−:Emx1-Cre), but not with adolescent deletion in forebrain excitatory neurons (ANK2−/−:CaMKIIα-Cre), display severe spontaneous seizures, increased mortality, hyperactivity, and social deficits. Calcium imaging of cortical slices from ANK2−/−:Emx1-Cre mice shows increased neuronal calcium event amplitude and frequency, along with network hyperexcitability and hypersynchrony. Quantitative proteomic analysis of cortical synaptic membranes reveals upregulation of dendritic spine plasticity-regulatory proteins and downregulation of intermediate filaments. Characterization of the ankyrin-B interactome identifies interactors associated with autism and epilepsy risk factors and synaptic proteins. The AMPA receptor antagonist, perampanel, restores cortical neuronal activity and partially rescues survival in ANK2−/−:Emx1-Cre mice. Our findings suggest that synaptic proteome alterations resulting from ANK2 deletion impair neuronal activity and synchrony, leading to NDDs-related behavioral impairments.
Graphical Abstract
In brief
Prenatal deletion of the ANK2 gene in mouse forebrain alters the synaptic proteome and enhances neuronal activity and synchronicity, leading to seizures and mortality. Normalization of neuronal and network activity through an AMPAR antagonist reduces hypersynchrony and lethality.
INTRODUCTION
According to Centers for Disease Control and Prevention, 1 in 36 children is diagnosed with autism spectrum disorders (ASDs), neurodevelopmental disorders (NDDs) characterized by communication deficits, impairment of social interaction, and stereotypical behaviors. ASDs are frequently associated with clinical diagnoses of epilepsy and intellectual disability (ID).1 Notably, in a large cohort, 30% of children with childhood-onset epilepsy were diagnosed with ASD.2 Extensive convergent evidence has implicated synaptic development and function as central to the pathogenesis of NDDs, including ASD and epilepsy.3 Indeed, a large fraction of ASD and epilepsy risk genes encode synaptic proteins, and increased dendritic spine density has been reported in postmortem studies in patients with ASD.3 Investigating the impact of NDD risk genes on synaptic composition and function may thus provide critical insight into pathogenesis and treatment.
Among over 1,100 risk genes from the Simons Foundation Autism Research Initiative (SFARI), ANK2 (encoding ankyrin-B; AnkB) is specifically interesting because mutations resulting in an ASD diagnosis are mostly non-syndromic and are less compatible with ID.4,5 However, how genetic risk variants in ANK2 lead to NDDs remains unknown. Ankyrin-B has a broad expression profile, including the brain, heart, skeletal muscle, and thymus.6 Alternative splicing results in multiple isoforms, the 220- and 440-kDa forms being the most abundant in the brain. Ankyrin-B is generally thought to contribute to the stability of perisomatic and proximal dendritic inhibitory synapses.7 In neurons, the 440-kDa isoform resides in unmyelinated axons.8 The 220-kDa variant of ankyrin-B, which is more prominent later in brain development, plays essential roles in long-range axonal transport9 and scaffolding NaV1.2 to the dendritic membrane.10
Mouse models have already provided insight into the biology of ankyrin-B. While mice constitutively lacking ANK2 die neonatally, a mouse with a mutation only in the 440-kDa isoform of ankyrin-B, similar to the R2608fs human ANK2 frameshift mutation in exon 37 (P2580fs), showed increased grooming, decreased spontaneous locomotor activity, and fewer ultrasonic vocalizations (USVs).11 These mice had a transiently increased number of mature dendritic spines, increased miniature excitatory postsynaptic current (mEPSC) frequency and amplitude, and decreased paired-pulse ratio in the cortex at P28, which returned to normal by P60. However, brain-specific knockouts of all ANK2 transcripts have not yet been investigated.
Here, we investigate the role of ankyrin-B in the brain and its impact on behavior using two ANK2 brain-specific conditional knockout (cKO) mouse models. ANK2−/−:Emx1-Cre mice display severe spontaneous seizures, increased mortality, hyperactivity, and social deficits, but no deficits of emotionality and working memory. Calcium imaging in cortical slices reveals increased average calcium event amplitude and frequency, along with network hyperexcitability and hypersynchrony. Using 10 plex tandem mass tags (TMT) and liquid chromatography-triple stage mass spectrometry (LC-MS3) multinotch analysis, we identify extensive alterations in cortical synaptic proteomes, including both up- and downregulated proteins. Upregulated proteins include multiple regulators of dendritic spine plasticity, while downregulated proteins are related to intermediate filaments. Analysis of the ankyrin-B protein interactome in the cortex using immunoprecipitation coupled with LC-MS/MS analysis provides mechanistic links between global proteomic alterations and the absence of ankyrin-B, highlighting a role for ASD and epilepsy risk factors. Notably, both neuronal network deficits and mortality are minimized by the AMPA receptor antagonist, perampanel. Our data provide insight into how increased neuronal excitability and network synchrony in ANK2 cKO mice can lead to NDDs like behavioral deficits.
RESULTS
Prenatal deletion of ANK2 in the forebrain causes spontaneous seizures, juvenile mortality, hyperactivity, and social impairment
A mutant mouse line with a specific point mutation on the 440-kDa isoform of ANK2 has been generated based on the R2608fs frameshift mutation in a patient with NDD.11 Whole-body ANK2 knockout mice could not survive over 50% at postnatal day 2 (P2), and more than 95% of lethality and 75% of weight loss were observed at P11 (Figure S1).12 To investigate the developmental and neuron type-specific impact of knocking out the ANK2 gene, we generated two cKO lines, prenatal deletion of ANK2 (ANK2−/−:Emx1-Cre) and postnatal deletion of ANK2 (ANK2−/−:CaMKIIα-Cre) in the forebrain, which were crossed with ANK2 floxed mice and CaMKIIα-Cre, which fully expresses Cre recombinase in the cortex after 4-week-old,13 or Emx1-Cre, which highly expresses Cre recombinase at embryonic day 10.5,14 mice. In both cases, western blotting of cortical homogenates showed ankyrin-B protein levels were sharply reduced when Cre was expressed (Figures S2A and S2N).
The most notable phenotype in ANK2−/−:Emx1-Cre mice was the appearance of spontaneous seizures starting about P20, which were lethal to ~50% of male and female mice by P36 (Figure 1A), and they all died before 9 months old. Previous studies have reported that Emx1-Cre is expressed in the afferent vagus nervous system, which regulates autonomic cardiorespiratory pathways.15 To confirm the neuronal role in mortality, ANK2−/−:NEX-Cre mice, in which ankyrin-B was removed from excitatory neurons in the neocortex and hippocampus (but not inhibitory neurons) during embryonic development, were observed, and they also showed similar lethality (Figure 1A). On the contrary, seizures were not observed in ANK2−/−:CaMKIIα-Cre mice. To understand the relationship between seizures and mortality, we investigated the timing between seizure onset and death in individual mice by analyzing long-term video recordings (Figure 1B and Video S1). The mice died within a minimum of 12 h and a maximum of 5 days following the detection of the first seizure (Figure 1B). Consistent with this, ANK2−/−:Emx1-Cre mice showed spontaneous seizures (Figures 1C and 1D) but not ANK2fl/fl mice. We then analyzed behavioral phenotypes of ANK2−/−:Emx1-Cre and ANK2−/−:CaMKIIα-Cre mice. We found that ANK2−/−:Emx1-Cre mice, but not ANK2+/−:Emx1-Cre (heterozygous deletion) or ANK2−/−:CaMKIIα-Cre mice, showed enhanced locomotor activity in an open field test (Figures 1E and 1H). Similarly, ANK2−/−:Emx1-Cre mice showed a reduced preference for a social novelty task (Figures 1G and 1J). It is well known that more males than females are diagnosed with ASDs.16 Therefore, sex differences for the behavioral phenotypes were investigated. Both mouse lines showed similar body weight and normal performance in forced swim, Y-maze, zero maze, and light/dark box tests in male or female mice (Figures S2B–S2M and S2O–S2S). Interestingly, hyperactive behavior was observed in both males and females of ANK2−/−:Emx1-Cre mice, whereas impairment in social novelty recognition was only significantly identified in male mice (Figures S3B and S3D). Ultrasonic vocalizations in ANK2−/−:Emx1-Cre mice at P7 were also normal in syllable number, duration, and total syllable energy (Figures S3E–S3L). These results indicate that early developmental, but not adolescent, ANK2 expression in forebrain pyramidal neurons is required for normal brain and behavioral development, and spontaneous seizures and ASD-like behaviors induced by depletion of ankyrin-B in the forebrain may be associated with distinct pathological pathways.
Figure 1. Deletion of ankyrin-B in the forebrain during early development, but not in adolescent forebrain pyramidal neurons, leads to spontaneous seizures, juvenile mortality, hyperactivity, and impaired social behavior.
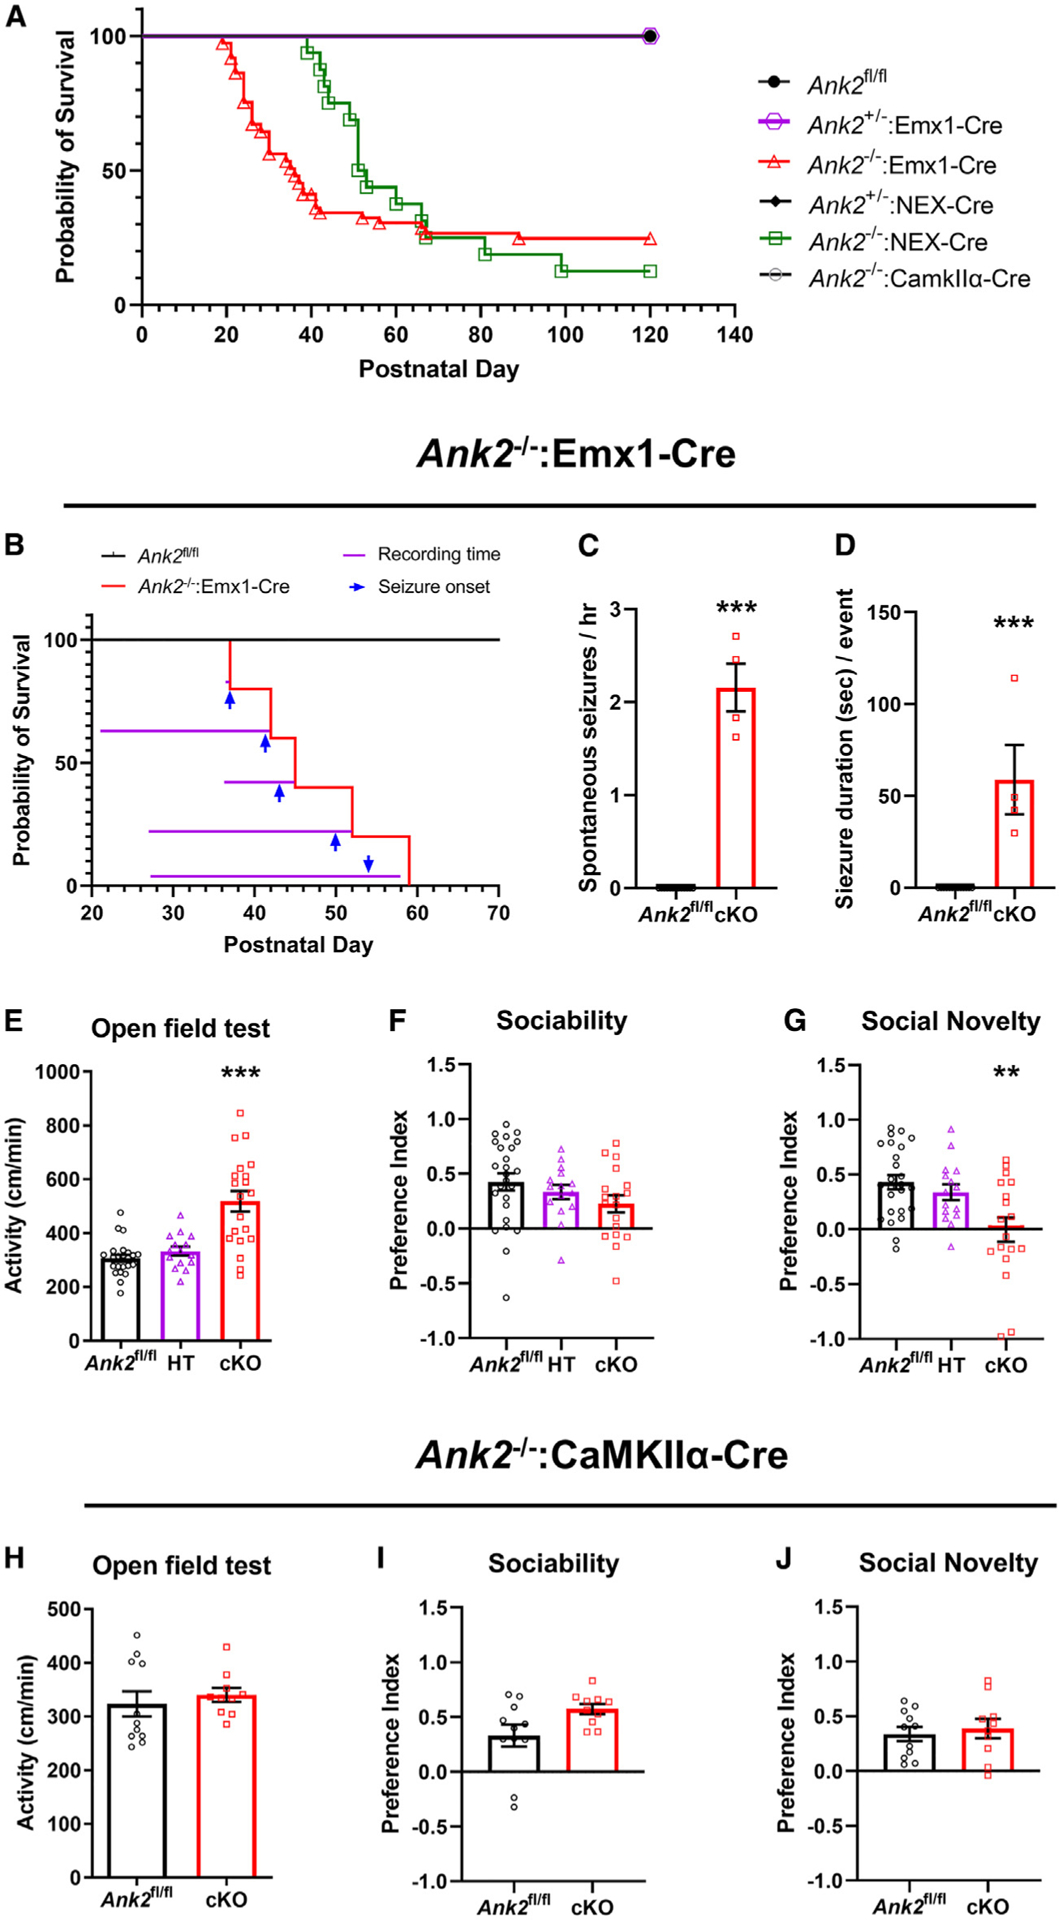
(A) Representative Kaplan-Meier survival curves. ANK2fl/fl, n = 66; ANK2+/−:Emx1-Cre, n = 42; ANK2−/−:Emx1-Cre, n = 73; ANK2+/−:NEX-Cre, n = 7; ANK2−/−:NEX-Cre, n = 16; ANK2−/−:CaMKIIα-Cre, n = 36 (male and female).
(B) Time point of seizure onset and death analyzed from long-term recordings. ANK2fl/fl, n = 13; ANK2−/−:Emx1-Cre, n = 5 (male and female).
(C) Number of spontaneous seizures per hour.
(D) Duration per seizure. Data were analyzed from the recorded movie files (B); ***p < 0.001; two-tailed unpaired t test.
(E) Activity in open field test for 30 min (male and female). ***p < 0.001.
(F) Quantification of time spent on social side (novel) or non-social side (empty) of social approach apparatus.
(G) Time spent with familiar subject or novel subject.ANK2fl/fl, n = 23–26; ANK2+/−:Emx1-Cre (HT), n = 13–15; ANK2−/−:Emx1-Cre (cKO), n = 15–20 (male and female); **p < 0.01; one-way ANOVA followed by a Bonferroni test.
(H–J) Quantification of activity in open field (H), sociability (I), and social novelty (J) in ANK2−/−:CaMKIIα-Cre (cKO) (male) (ANK2fl/fl, n = 11; cKO, n = 10). All data are represented as mean ± SEM. See also Figures S2 and S3.
ANK2−/−:Emx1-Cre mice show higher neural activity and synchrony
The presence of spontaneous seizures suggested that mice may have detectable circuit-level alterations potentially related to the seizure activity. Calcium imaging is an excellent technique for simultaneously measuring cellular activity in a large number of neurons. To confirm Ca2+ activity reflects neuronal firing, we recorded Ca2+ events with 2 μM tetrodotoxin (TTX), which could block the firing of action potentials in neurons (Figure S4). As expected, TTX reduced the Ca2+ influx in the cytosol. To investigate network activity in the cortex, we performed Ca2+ imaging in acute cortical slices from 2-week-old ANK2−/−:Emx1-Cre and ANK2fl/fl mice. Slices were incubated with the cell-permeant calcium sensor Cal520 AM and the astrocyte-specific marker sulforhodamine 101 (SR101) (Figure 2A). Layer 2/3 of the somatosensory 1 (S1) area was imaged under a multiphoton laser-scanning microscope in low-magnesium artificial cerebrospinal fluid (aCSF) (Figure 2B). ANK2−/−:Emx1-Cre mice showed significantly increased frequency (Figure 2C) and amplitude (Figure 2D) of Ca2+ events compared to ANK2fl/fl mice. Spontaneous synchronized network events were unbiasedly identified by using a Monte-Carlo simulation based on 1,000 random permutations of the Ca2+ peaks for each neuron. We quantified the minimal number of co-active cells per frame thatwould be considered as a synchronized network event using a threshold equal to the 99.9 percentile of the 1,000 simulations (Figures 2F and 2G). Another independent method used to assess the synchrony was the pairwise correlation that measured the R correlation coefficient (0 is equal to uncorrelated and +1 is equal to perfect correlation) for the signals of all pairs of neurons (Figure 2H). We found a significantly higher pairwise correlation (Figures 2H and 2I), frequency of network events, and percentage of co-active cells per synchronized events (Figures 2J and 2K), indicating increased synchrony in ANK2−/−:Emx1-Cre mice. To determine whether the enhancement of neuronal activity and synchronicity correlated with neuronal morphological changes, the apical dendritic spine density of pyramidal neurons was measured in the S1 cortex of 3-week-old ANK2fl/fl and ANK2−/−:Emx1-Cre mice. Interestingly, there was a significant increase in the number of spines in layer 2/3 but no difference in layer 5 (Figures S5A and S5B). Moreover, consistent with the previous results from primary cultured hippocampal neurons in a giant ANK2-specific mutant of DIV7,11 ANK2−/−:Emx1-Cre primary cultured cortical neurons showed increased axonal branching (Figures S5C and S5D). Altogether, these results indicate that layer 2/3 of the S1 cortex of ANK2−/−:Emx1-Cre mice is more active and synchronized than ANK2fl/fl animals, which may correlate with an epileptic phenotype.
Figure 2. Increased neuronal network activity and synchrony in cortical slices of ANK2−/−:Emx1-Cre mice.
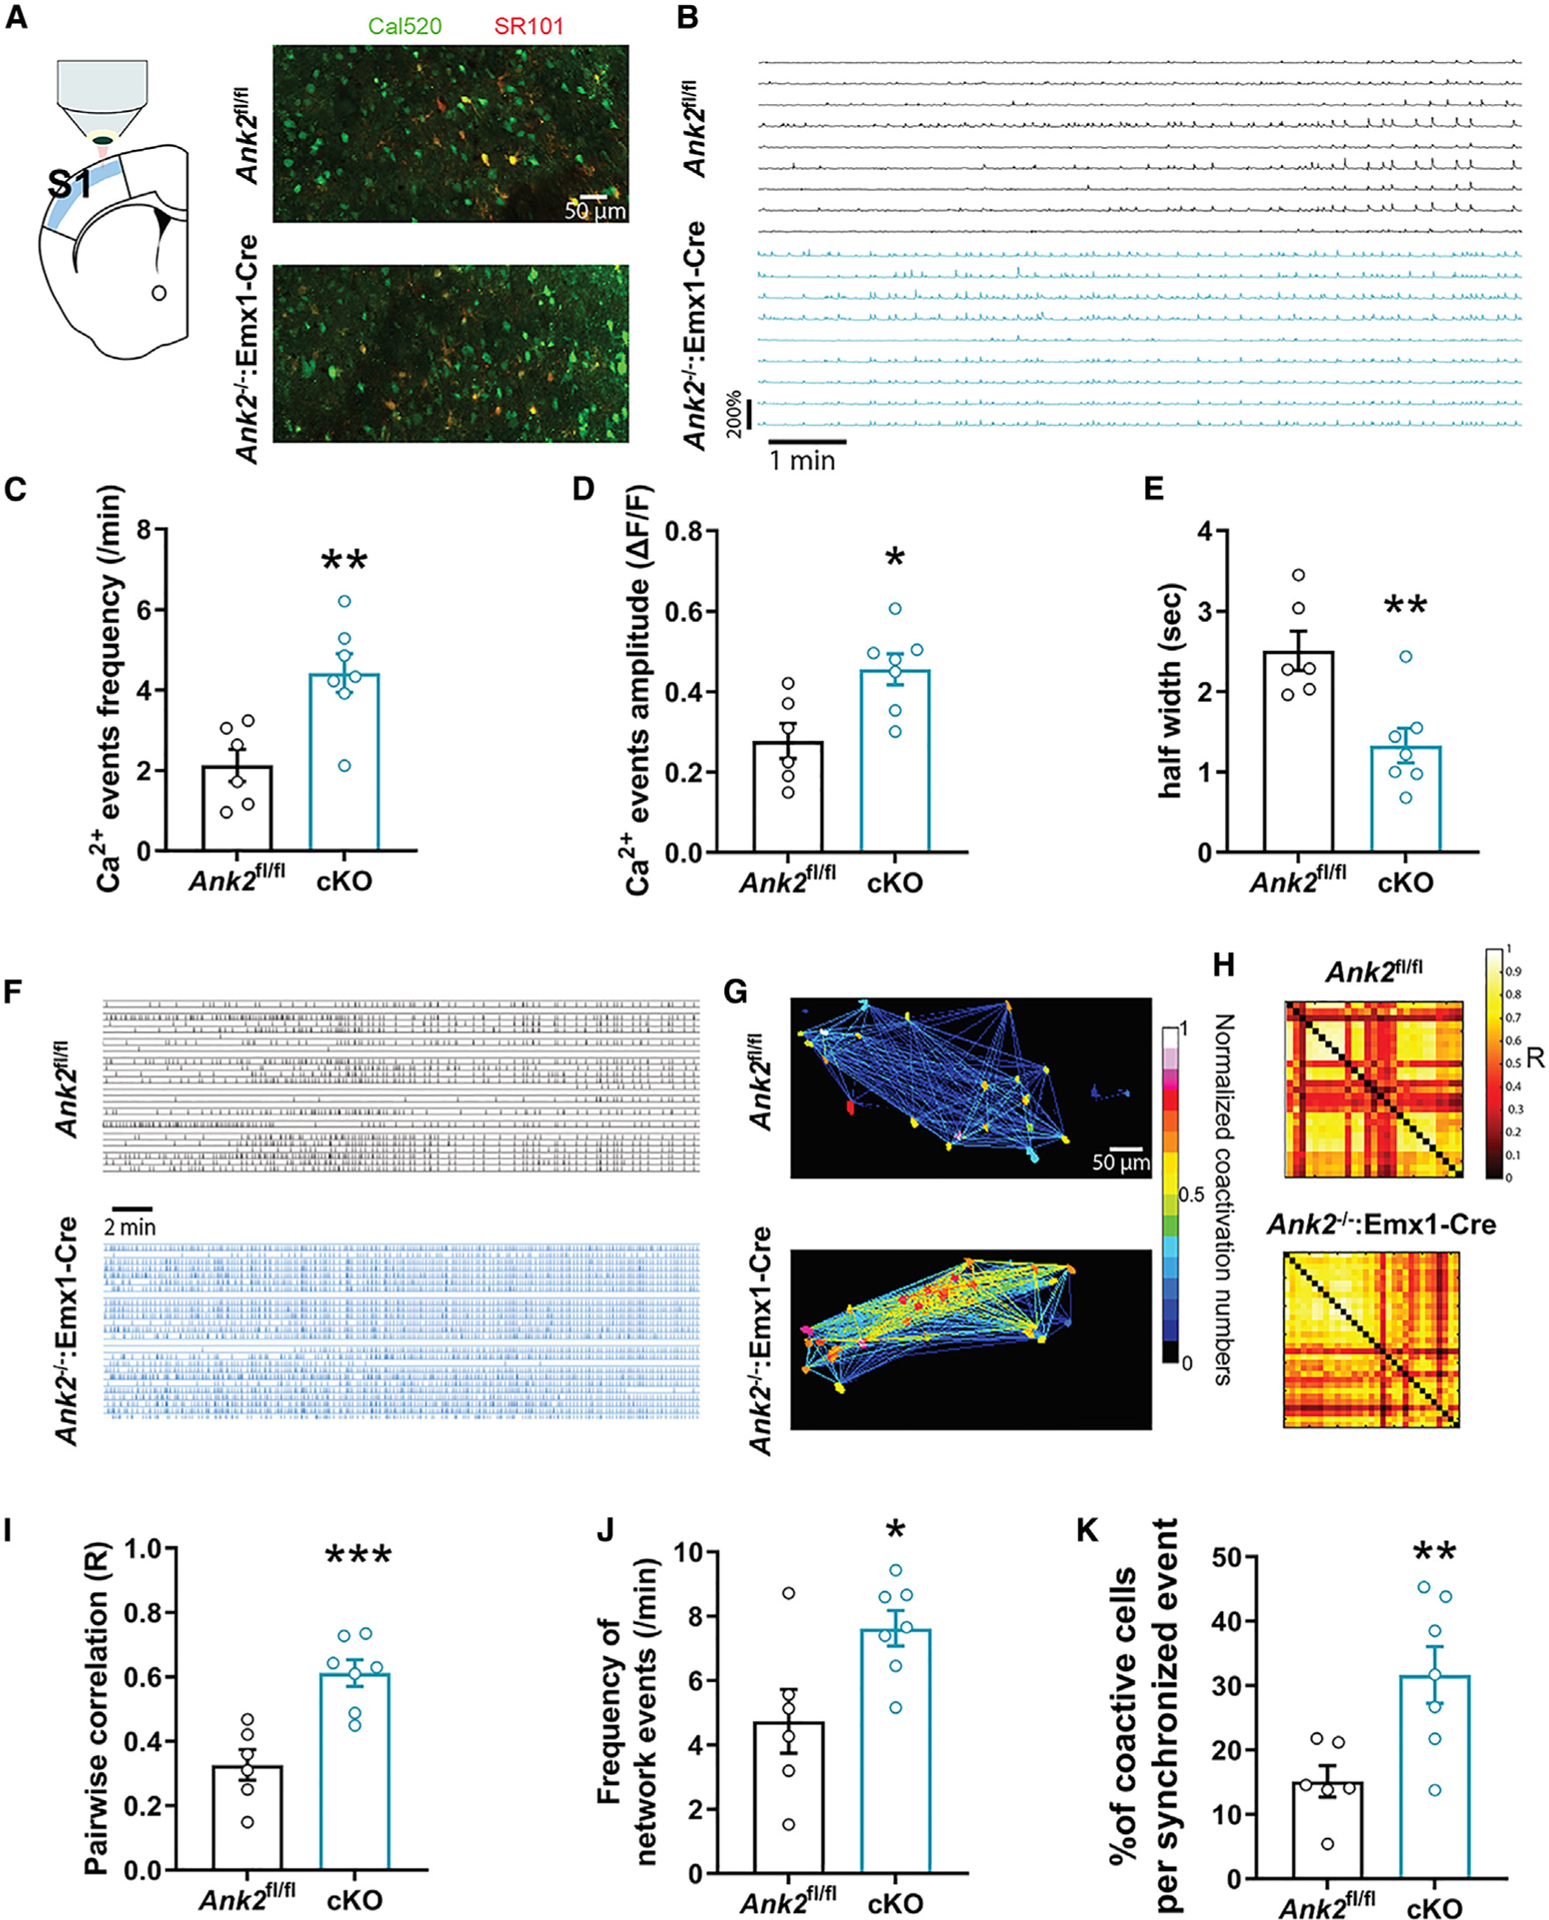
(A) Schematic of the imaging of layer 2/3 in S1 somatosensory area and representative images using the Cal520/Sr101 dyes in ANK2fl/fl and ANK2−/−:Emx1-Cre brain slices.
(B) Representative traces of 10 min recordings in ANK2fl/fl and ANK2−/−:Emx1-Cre mice slices in low-Mg aCSF.
(C–E) Ca2+ event frequency (C), amplitude (D), and half-width (E) in ANK2−/−:Emx1-Cre and ANK2fl/fl slices.
(F) Representative raster plots of the detected Ca2+ events during a 30-min recording session.
(G) The number of neuronal co-activations normalized from 0 to 1 and color coded in a heatmap illustrates the higher degree of functional connectivity between neurons in ANK2−/−:Emx1-Cre mice.
(H and I) Maps of pairwise correlation coefficients R show an increased correlation between pairs of neurons in ANK2−/−:Emx1-Cre vs. ANK2fl/fl slices.
(J) Network events are more frequent in ANK2−/−:Emx1-Cre compared to ANK2fl/fl slices.
(K) ANK2−/−:Emx1-Cre slices show higher percentage of co-active neurons during network events than ANK2fl/fl. n = number of slices, six in ANK2fl/fl, seven in ANK2−/−:Emx1-Cre from three animals per genotype (male and female). Two-tailed unpaired t test was performed. *p < 0.05, **p < 0.01, ***p < 0.001. All data are represented as mean ± SEM. See also Figure S4.
Absence of ankyrin-B reshapes the postsynaptic proteome
We hypothesized that genetic alterations lead to changes in protein that could underlie circuit and behavioral phenotypes. To gain mechanistic insight into the molecular alterations in the cortex of ANK2−/−:Emx1-Cre mice, we performed discovery-based proteomic analysis using 10 plex TMT LC-MS3 multinotch analysis of crude synaptosomal preparations isolated from ANK2−/−:Emx1-Cre and ANK2fl/fl mice (Figure 3A). We detected extensive proteome remodeling and identified 94 proteins that were significantly different between the two groups (Table S1). A volcano plot shows the fold changes in protein levels relative to significance (Figure 3B). Surprisingly, there were twice as many upregulated proteins (61, in purple, p < 0.05) as downregulated proteins (33, in green, p < 0.05; 0.5-fold less). Gene ontology (GO) analysis using the cellular component analysis from the SynGO database17 revealed that postsynaptic density (PSD) membranes were enriched in upregulated proteins, and postsynaptic intermediate filament cytoskeletons were enriched in downregulated proteins (Figure S6). GO analysis followed by hypergeometric testing revealed that altered protein datasets were enriched in postsynaptic and presynaptic elements but not in neurodevelopmental and neuropsychiatry risk factors (Figure 3C). To understand how the deletion of ankyrin-B reshaped the protein networks at the synapse, we graphically represented the dysregulated proteins in relationship to their locations at synapses and their known interactions (Figure 3D). Notably, upregulated postsynaptic proteins included Kalrn, Cacng8, Tiam1, Arrb2, Pcdh8, and Ptprz1, known regulators of postsynaptic structure and function, while downregulated proteins included the neurofilament proteins (Nefl, Nefm, and Ina) and a ribosomal protein (Rps4x). We confirmed the expression levels of Kalrn and Rps4x by western blotting of P2 from the cortex of ANK2fl/fl and ANK2−/−:Emx1-Cre mice (Figure 3E). Taken together, our data suggest that the absence of ankyrin-B affects the abundance of postsynaptic proteins.
Figure 3. The proteome is remodeled in the cortical synapse of ANK2−/−:Emx1-Cre mice.
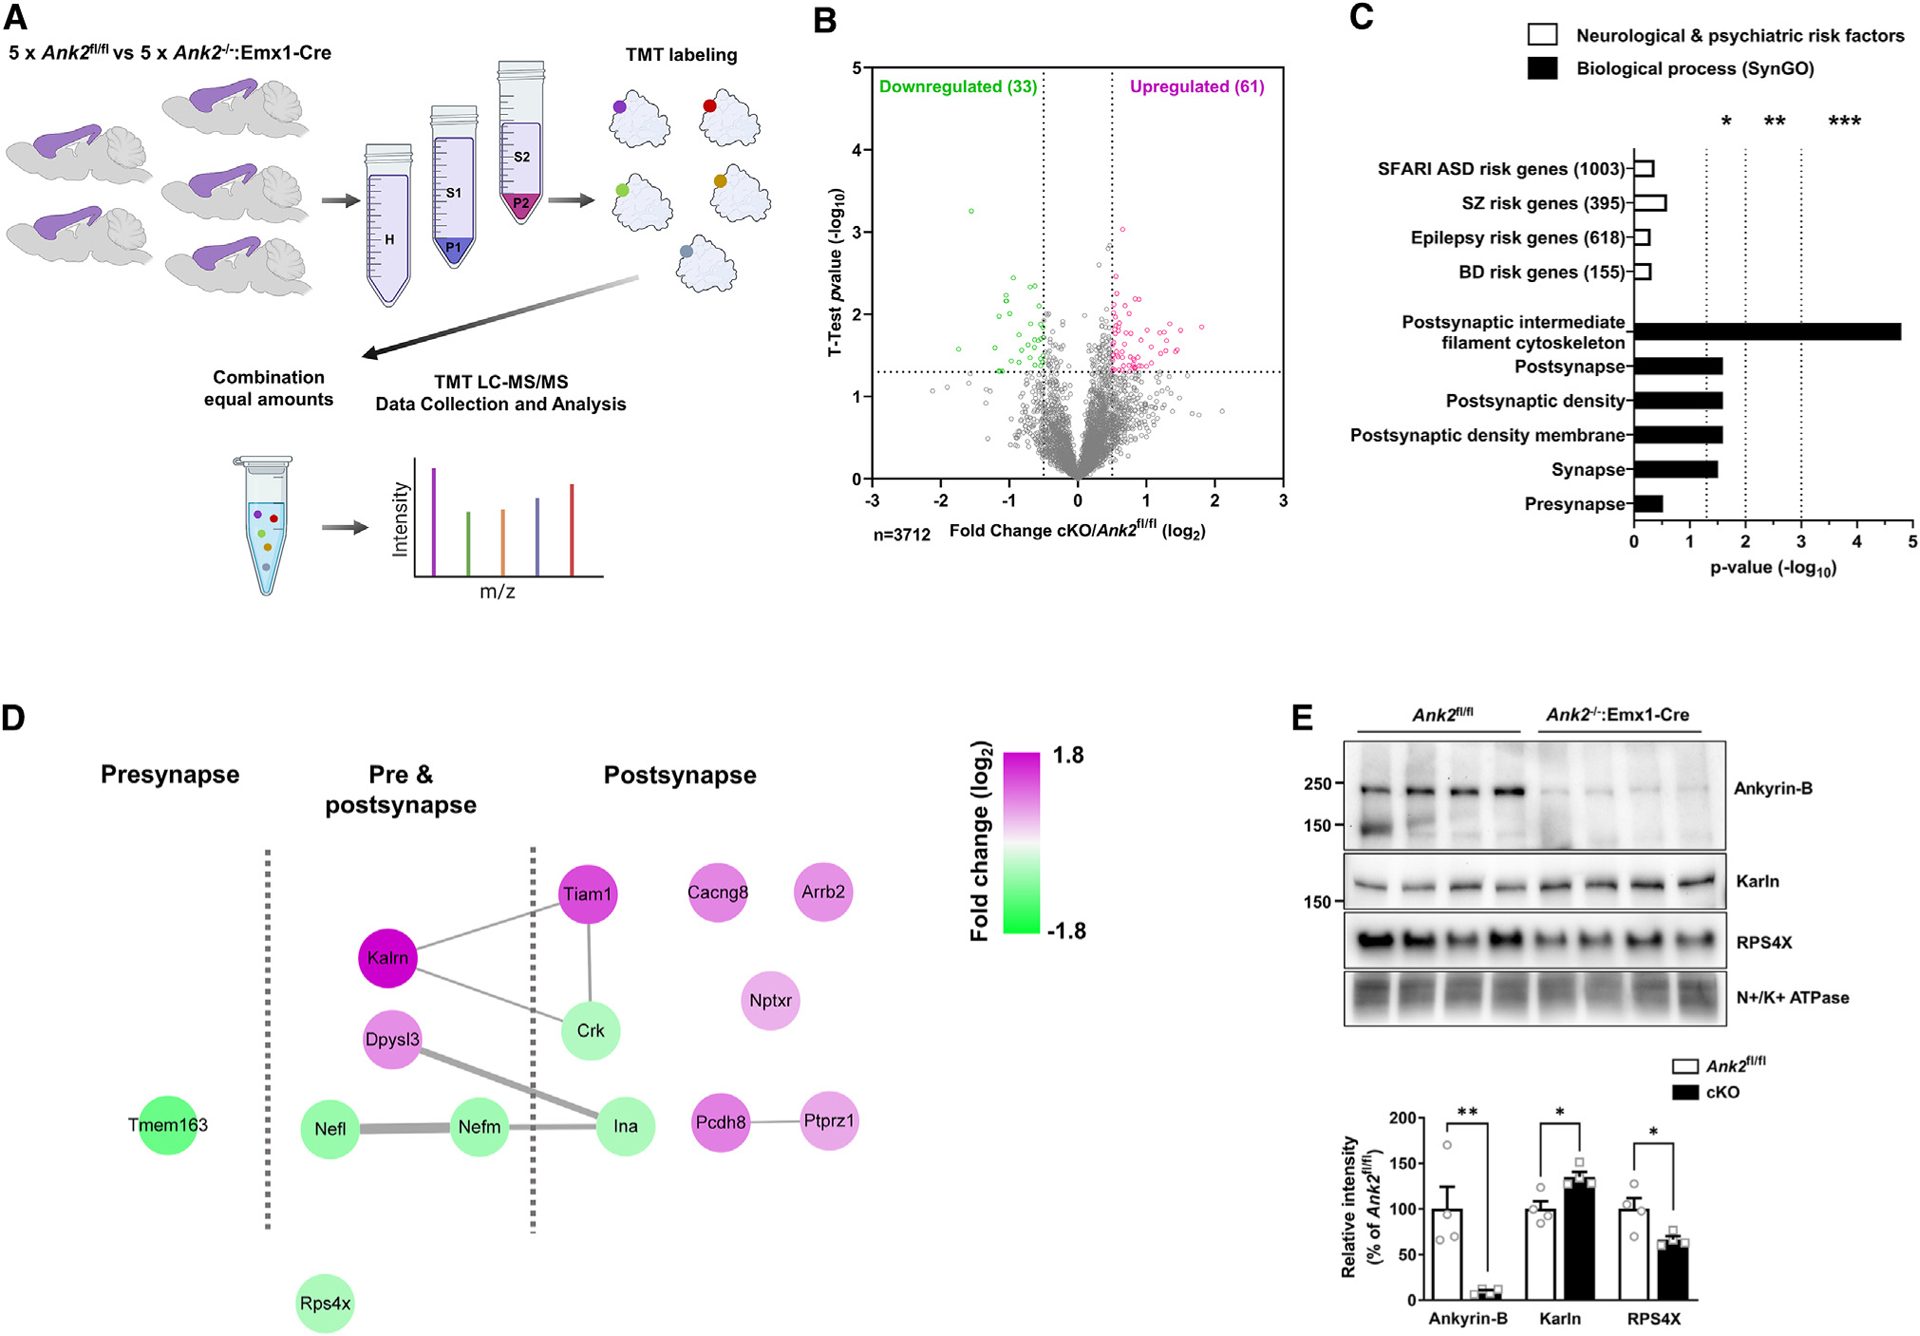
(A) Scheme of experimental workflow for 10 plex TMT LC-MS3 multinotch analysis from the cortex of ANK2−/−:Emx1-Cre vs. ANK2fl/fl male mice.
(B) Volcano plot showing the protein level fold change relative to significance between ANK2fl/fl and ANK2−/−:Emx1-Cre mice. ANK2fl/fl, n = 5; ANK2−/−:Emx1-Cre, n = 5. Significantly upregulated proteins are in pink (p < 0.05), significantly downregulated proteins are in green (p < 0.05), and the other proteins are in gray.
(C) Graph showing the significance of either upregulated or downregulated proteins present in psychiatric risk genes. Significance was tested by hypergeometric tests. Gene ontology (GO) analysis of biological processes by SynGO.
(D) Scheme of the dysregulated proteomics in synapses.
(E) Representative images of western blot from P2 fractionated samples. The graph shows relative abundance of proteins in cortex of 3-week-old ANK2fl/fl and ANK2−/−:Emx1-Cre mice (n = 4 per each group). *p < 0.05; **p < 0.01; two-tailed unpaired t test was performed. All data are represented as mean ± SEM. See also Figure S6. SFARI, Simons Foundation Autism Research Initiative; ASD, autism spectrum disorder, SZ, schizophrenia; BD, bipolar disorder.
Homeostatic plasticity formation through the adjustment of synaptic connection strength is achieved by regulating the surface expression of AMPA receptors, and the strong correlation between changes in dendritic spines and AMPA receptors has been demonstrated.3 To investigate how the lack of ANK2 affects the expression of AMPA receptors in the brain, we analyzed the expression levels of GluA1 and GluA2, and both were observed to be similar. (Figure S6D). These results were confirmed by analysis of the correlation between GluA1 or GluA2 puncta sizes and mushroom-type spine head sizes using super-resolution microscopy, which also showed no difference (Figures S7C–S7E). Unexpectedly, the increase in spine density previously shown in layer 2/3 of the S1 cortex was not observed in cultured neurons (Figures S7A and S7B). It may indicate that appropriate localization of neurons in specific layers and synaptic communications with surrounding cells could be essential for regulating spine development by ankyrin-B.
The ankyrin-B interactome is enriched in synaptic proteins and NDD risk factors
Ankyrin-B is primarily recognized as an axonal protein, since it is concentrated at the axon initial segment (AIS), nodes of Ranvier (NOR), and axonal terminals. In axons, it is involved in the transport of organelles, including synaptic vesicles. At the AIS and NOR, it is associated with several calcium channels, IP3R, and ion transporters.18,19 However, its protein interaction networks have not yet been examined at synapses in the brain. To identify ankyrin-B interaction partners in the cortex, we performed affinity purification with LC-MS/MS analysis (Figure 4A) from P2 synaptosomal fraction from the adult mouse cortex. We immunoprecipitated ankyrin-B-interacting proteins using an ankyrin-B antibody that recognizes both isoforms (Figures S2A and S2N) and analyzed these proteins globally in an unbiased manner. We identified a total of 78 ankyrin-B-interacting proteins that were at least 2-fold more enriched over immunoglobulin G (IgG) based on the number of spectral counts (SC) (5 ≤ SC mean) (Figures 4B and S8A andTable S2). GO analysis showed that ankyrin-B-interacting proteins were significantly enriched in ASD and epilepsy risk genes but not schizophrenia or bipolar disorder risk genes (Figures 4C and S8C). As synapses were one of the top GO cellular compartment processes, we performed a SynGO analysis to characterize subsynaptic localization (Figure 4D). Interactors included both postsynaptic and presynaptic proteins. These results indicate that ankyrin-B also participates in the postsynaptic protein network, interacting with several essential PSD proteins associated with ASD risk factors, including Shank3, Homer1, Gria2 (GluA2), Dpysl3, Wasf1, and Nckap1 (Figure 4E). We confirmed the interaction of ankyrin-B with GluA2 and Shank3 by co-immunoprecipitation, followed by western blot analysis (Figures 4F and 4G). Presynaptic proteins included synaptic vesicle membrane and presynaptic active zone proteins Cltb (Clathrin), Syt1, Syn2, Pclo (Piccolo), and Bsn (Bassoon) (Figure 4E). Many of these proteins were not previously known to participate in ankyrin-B complexes (Figure S8D).
Figure 4. Mapping of the ankyrin-B interactome identifies synaptic protein partners.
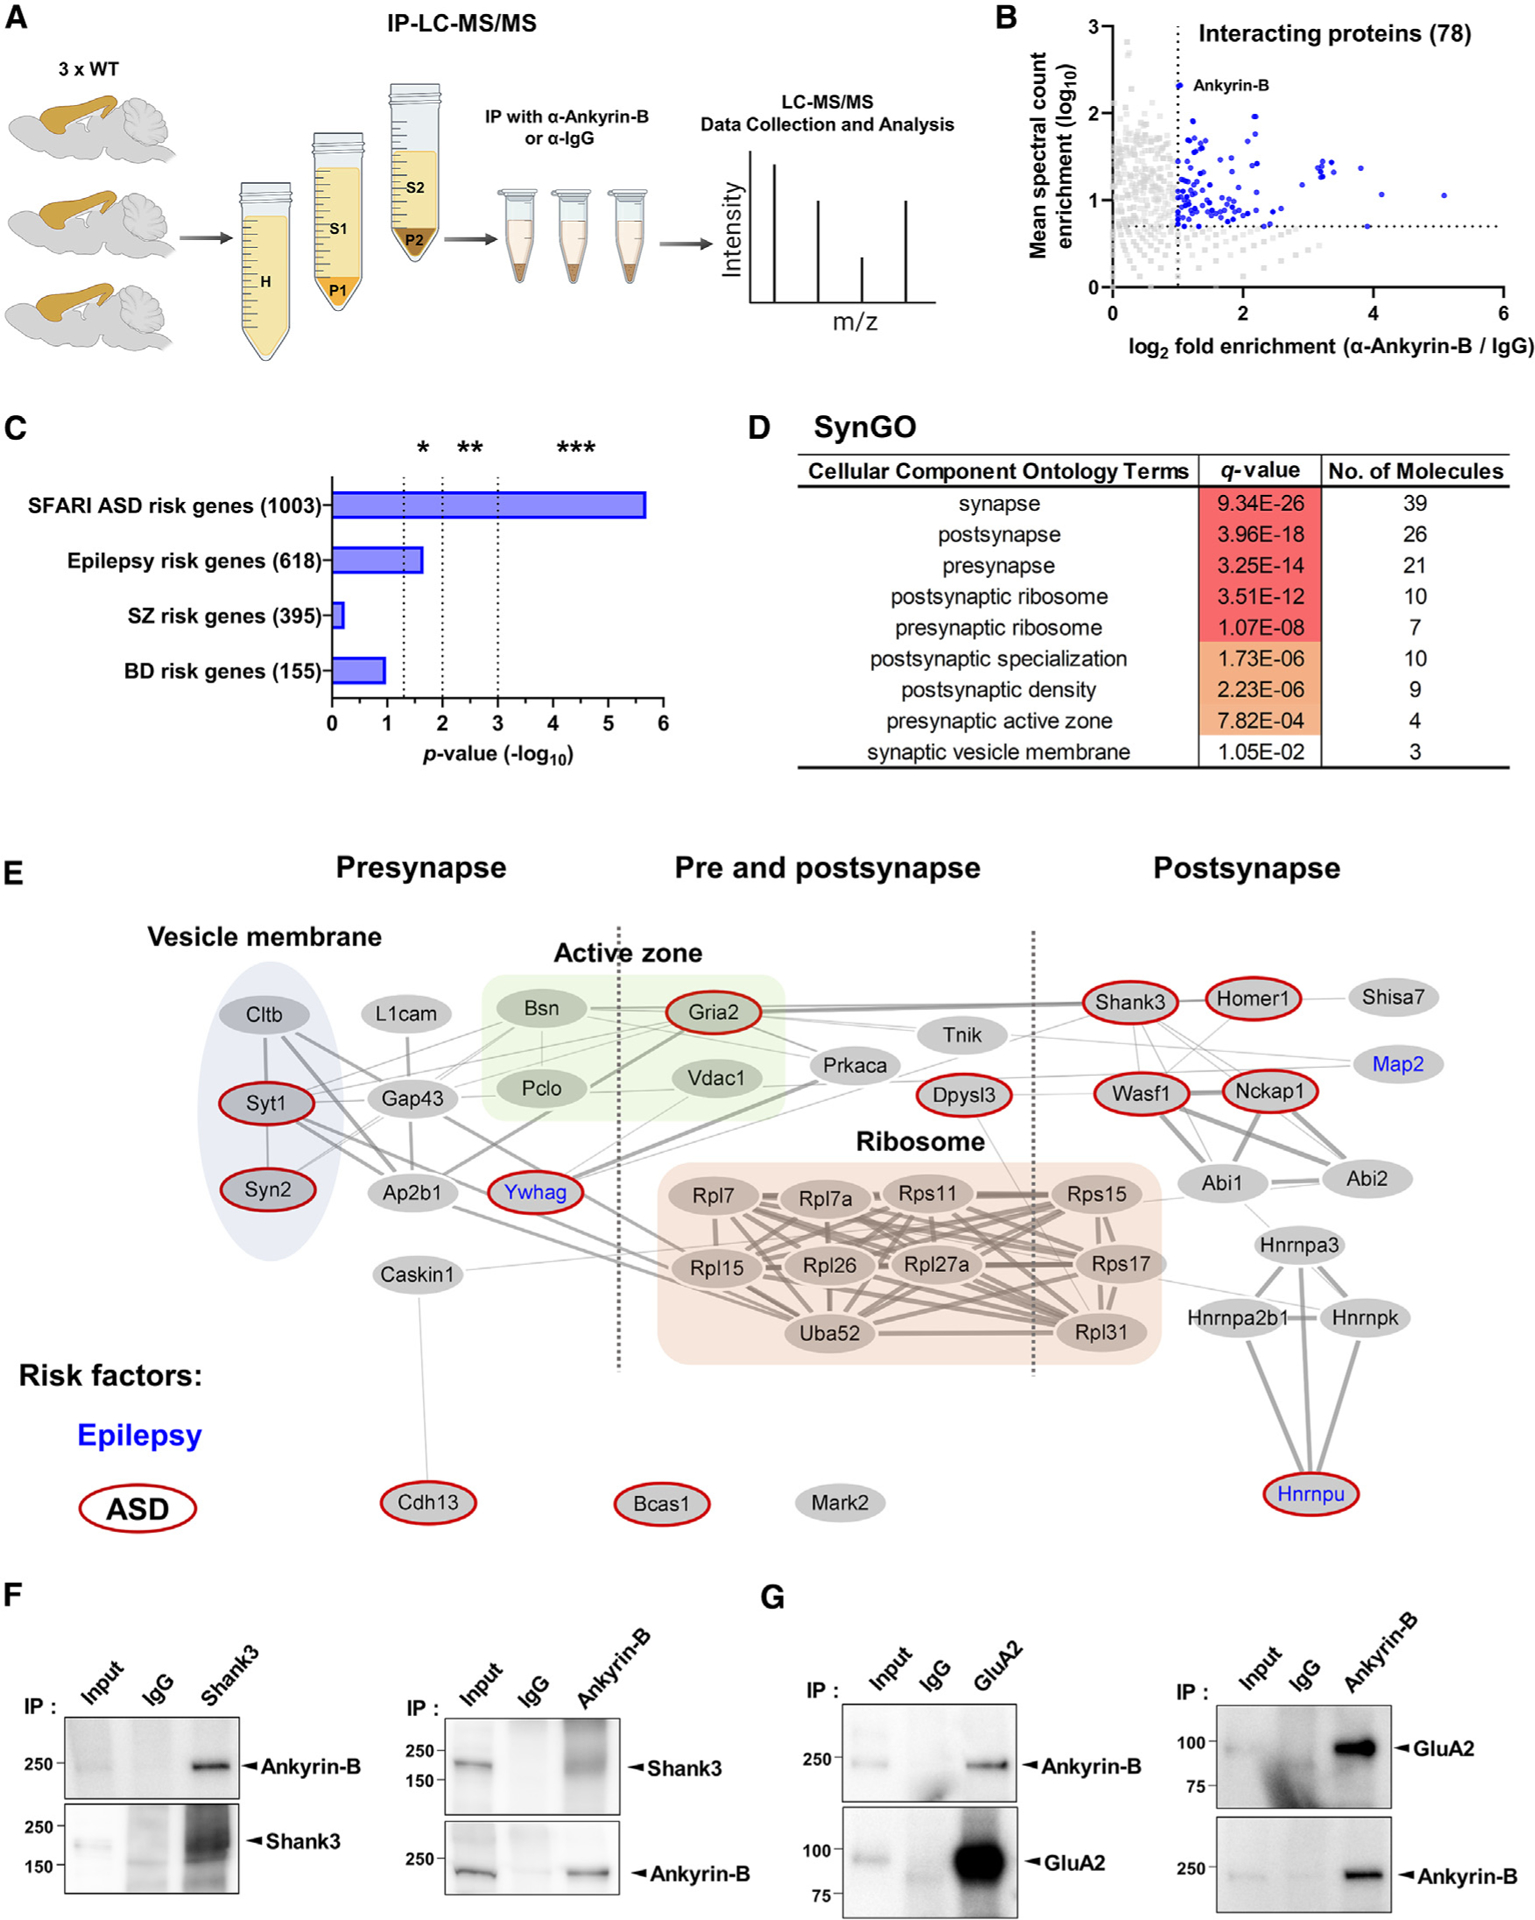
(A) Scheme of experimental workflow for the identification of proteins immunoprecipitated with an anti-ankyrin-B antibody from homogenized cortex using LC-MS/MS (n = 3 per each group).
(B) Scatterplot showing the 78 identified proteins from IP-LC-MS/MS. Each sample set was analyzed by the t test (p < 0.05), and corresponding proteins (2-foldmore than IgG) are depicted in blue.
(C) Enrichment analysis of ankyrin-B-interacting proteins in neurodevelopmental and psychiatric disorder risk factors. Significance was analyzed by hypergeometric tests.
(D) Analysis of enrichment in synaptic cellular components in the interactome by SynGO.
(E) Scheme of ankyrin-B in teractome at synapses. Epilepsy risk factors in blue letters and ASD risk factors in red borders are indicated.
(F and G) Co-immunoprecipitation experiments with anti-ankyrin-B or anti-Shank3 (F) and anti-ankyrin-B or anti-GluA2 (G) from the P2 fraction. IgG, control IgG; IP, immunoprecipitation. See also Figure S8. SFARI, Simons Foundation Autism Research Initiative; ASD, autism spectrum disorder; SZ, schizophrenia; BD, bipolar disorder.
Perampanel normalizes neuronal network activity and improves survival
Although the expression of AMPA receptor subunits was not different in the forebrain and mushroom-type spine heads of ANK2−/−:Emx1-Cre mice, ankyrin-B interacted directly with GluA2. We reasoned that circuit hyperactivity might be caused at least in part by increased AMPA receptor-mediated synaptic transmission. To test this hypothesis, we treated cortical slices from ANK2−/−:Emx1-Cre mice with the AMPA receptor antagonist perampanel, an anti-epileptic drug. Acute bath application of 10-μM perampanel significantly reduced spontaneous neuronal Ca2+ event rates and amplitude in ANK2−/−:Emx1-Cre slices to near ANK2fl/fl levels, as shown by multiphoton Ca2+ imaging (Figures 5C and 5D). Although perampanel did not significantly reduce the percentage of co-active cells during network events in ANK2−/−:Emx1-Cre slices, the ANK2−/−:Emx1-Cre neuronal synchrony reverted to ANK2fl/fl levels (Figure 5E). The ability of perampanel to normalize neuronal network activity suggested that it may also improve survival in live ANK2−/−:Emx1Cre mice. To test this, we injected ANK2−/−:Emx1-Cre and ANK2fl/fl mice with either the vehicle or perampanel for 40 days daily, starting at P21. Perampanel significantly increased the survival rate of ANK2−/−:Emx1-Cre mice, and this effect persisted even after stopping perampanel injection at P60 (Figure 5F). In contrast, treatment with valproic acid, another anti-epileptic drug acting through increasing neuronal concentration of GABA, did not affect the mortality of ANK2−/−:Emx1-Cre mice (Figure S8C). These results indicate that normalization of neuronal and network activity through blockage of AMPA receptor-mediated synaptic transmission can reduce lethality caused by the deletion of ANK2 gene.
Figure 5. Perampanel, an AMPA receptor antagonist, restores neuronal network activity and improves survival of ANK2−/−:Emx1-Cre mice.
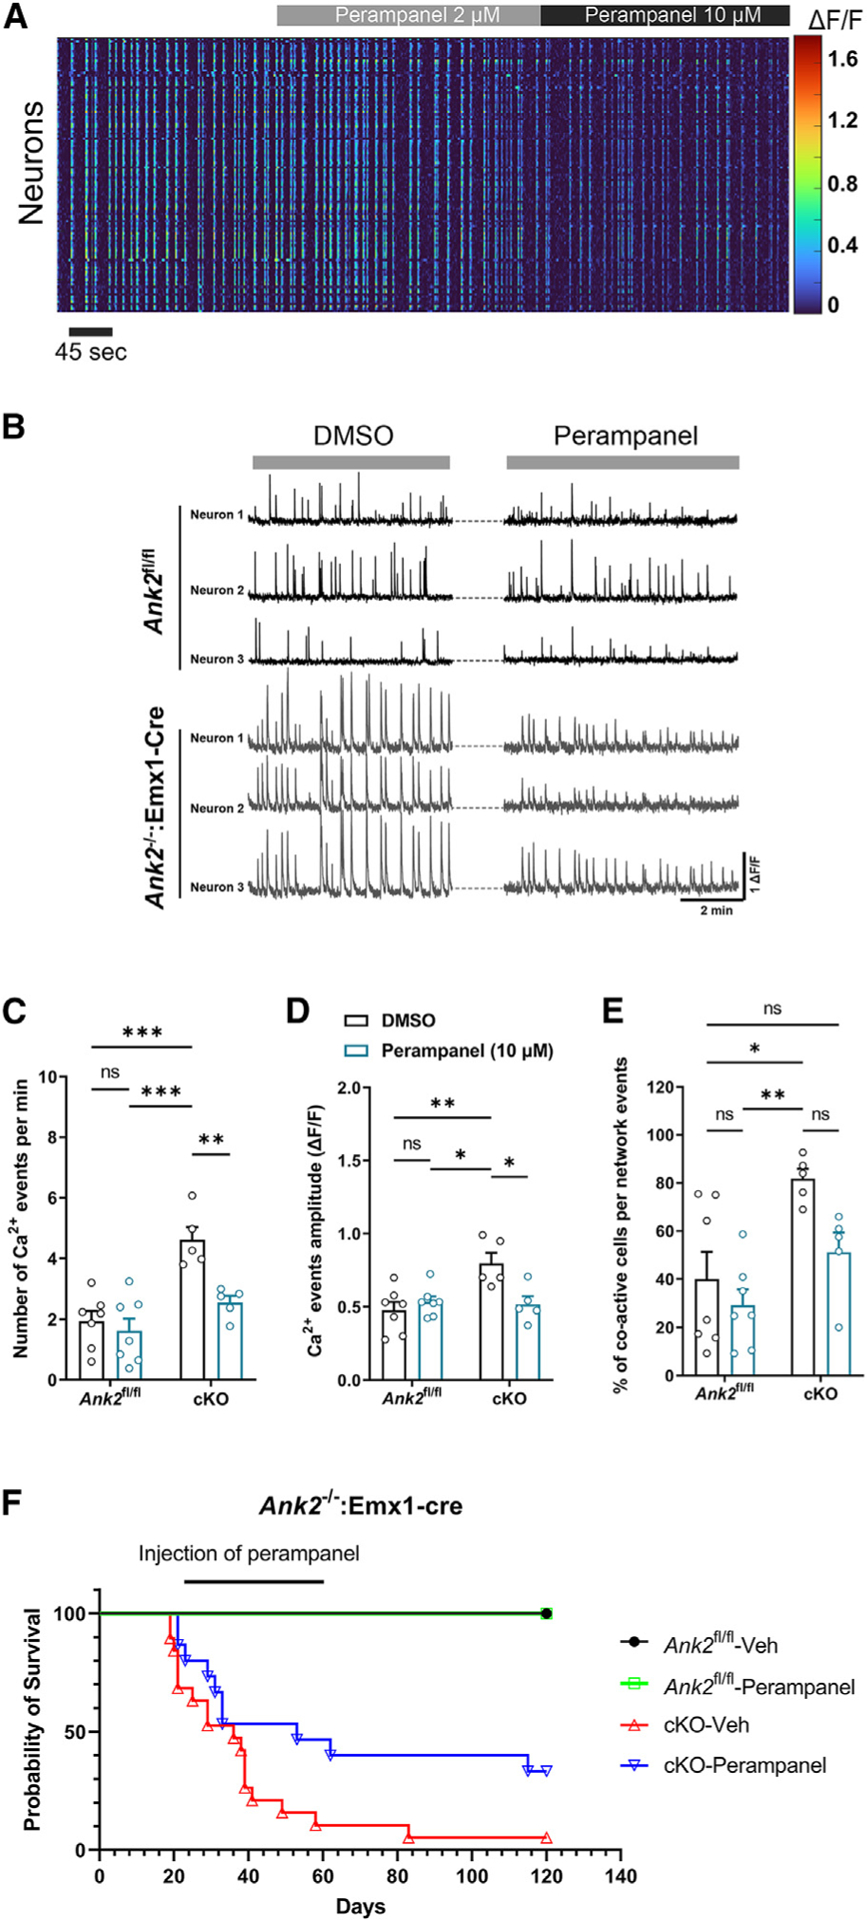
(A) Representative heatmap of the effects of increasing doses of perampanel on cortical neuronal activity in brain slice.
(B) Representative traces of three neurons in ANK2fl/fl and ANK2−/−:Emx1-Cre brain slices treated with DMSO (vehicle) or perampanel (10 μM).
(C–E) number of events (C), amplitude (D), and percentage of co-active cells per network (E) of Ca2+ events in ANK2−/−:Emx1-Cre brain slices compared to ANK2fl/fl slices treated with 10 μM of perampanel.
(F) Survival curve of ANK2−/−:Emx1-Cre mice (male and female) chronically injected with perampanel (0.2 mg/kg). two-way ANOVA, Tukey post hoc test was performed. *p < 0.05, **p < 0.01, ***p < 0.001. All data are represented as mean ± SEM. See also Figure S9.
DISCUSSION
All abnormalities in ANK2−/−:Emx1-Cre mice were absent in ANK2−/−:CaMKIIa-Cre mice, suggesting that ankyrin-B contributes to brain development in a spatiotemporal manner. ANK2−/−:Emx1-Cre mice differ in several phenotypes from the three mutant mouse lines (ANK2R2608fs/R2608fs: lack of 440-kDa ankyrin-B; ANK2exon37−/−:Nestin-Cre: lack of 440-kDa ankyrin-B in neuronal and glial precursors; heterozygous ANK2−/+: haploinsufficient of 220-kDa and 440-kDa ankyrin-B)11 (Figure S1). In contrast to all these lines, ANK2−/−:Emx1-Cre mice show spontaneous seizures during early development and increased mortality. ANK2−/−:Emx1-Cre mice showed hyperactivity and reduced preference for social novelty, whereas the other lines showed hypoactivity and normal social behavior. On the other hand, ANK2−/−:Emx1-Cre mice had normal USVs and no repetitive behaviors, while truncation mutant mice showed reduced USVs and increased repetitive behaviors.11 These differences could be caused by the isoforms affected, residual protein amounts, or presence of truncated proteins. Notably, none of the mutant mouse lines had deficits in working memory.
We found a robust increase in Ca2+ events, calcium network activity, and synchrony in the ANK2−/−:Emx1-Cre cortex. The increase in synchrony is similar to another mouse model of NDDs we recently investigated, which is also associated with seizure phenotypes.20 These activity changes could reflect increased synaptic structural connectivity, activity, or intrinsic excitability. The synchronous firing also increases with synapse density.21 Altered Ca2+ homeostasis may also contribute to increased network activity, as ankyrin-B is known to interact directly with Ca2+ channels.22,23 Neuronal activity typically propagates from cortical layer 2/3 to layer 5.24 More neurons are required to be stimulated to initiate activityin layer 2/3 thanin layer 5.Increases inspine density inlayer 2/3 ofthe S1cortex ofANK2−/−:Emx1-Cre micemay readily trigger spontaneous neuronal activity. In addition, increases in axonal branching in primary cortical cultured neurons from ANK2−/−:Emx1-Cre mice were observed at DIV7 (Figures S5C and S5D). In a previous study, significant increases in connectivity in the cortex in P28 mutant mice in a giant ankyrin-B mutation mouse model were confirmed through a brain-wide diffusion tensorimaging method.11 It has been reported that axon branching plays an essential role in the interconnectivity that forms networks within neurons in the brain.25
Quantitative proteomics of the cortical synaptosome fraction detected extensive proteome alterations, which primarily affected postsynaptic proteins. In particular, several upregulated proteins, including Kalrn, Tiam1, Cacng8, and Nptxr play important roles in the formation, maturation, stabilization, and remodeling of spiny synapses on excitatory neurons. Activation of Kalrn and Tiam1, both Rac/Rho guanine-nucleotide exchange factors, enhances AMPA receptor-mediated synaptic transmission along with dendritic spine density and size.26–28 Cacng8 (TARPγ8) is a transmembrane AMPA receptor regulatory protein (TARP) known to regulate the trafficking and gating properties of AMPA receptors.29 Nptxr, neuronal pentraxin receptor, controls clustering of AMPA receptors at a subset of excitatory synapses.30 Unexpectedly, we found no difference between ANK2fl/fl and ANK2−/−:Emx1-Cre mice in the correlation between GluA1 and GluA2 puncta sizes and nanodomains in mushroom-type spine heads using super-resolution microscopy along with both protein expression levels by western blot analysis. However, since the synaptic proteome analysis was performed with the whole forebrain, we could not identify which protein groups cause changes in the spine density of layer 2/3 due to ANK2 deficiency. Further studies are required to investigate precise mechanisms.
How could the loss of a scaffolding protein like ankyrin-B lead to an increase in postsynaptic protein levels? At the Drosophila neuromuscular junction, ankyrin-B stabilizes synapses through lattice-like networks and limits protein mobility at synapses.31 In mammalian neurons, ankyrin-B forms an axonal barrier that limits protein diffusion.8 By analogy, ankyrin-B may form a barrier that limits the amount of proteins in the synapse, and its loss may leave space for more molecules to move in, ultimately increasing the abundance of synaptic proteins. Interestingly, the downregulated proteins, including Nefl, Nefm, and Ina, are predominantly neurofilament-related. Nefl is known to play an essential role in the dendritic spine structure and function,32 and it has been reported to interact with the NMDA receptor subunit NR1 as a core synaptic scaffold protein.33 In particular, a decrease in NEFL gene expression in the anterior cingulate gyrus, the motor cortex, and thalamus regions of patients with autism has been reported.34 On the other hand, NEFL fragment levels in serum are elevated compared to healthy controls.35 This may be reminiscent of the loss of cortical microtubule organization in mice carrying a human ANK2 variant.11
Behavioral experiments showed that only male ANK2−/−:Emx1Cre mice had impairment in the social novelty. Among the proteins observed from the global proteome and ankyrin-B interactome in the cortex, L1cam, Amot, and Rps4x were identified as a result of comparing the X chromosome gene. Rps4x, which was reduced in the cortex of ANK2−/−:Emx1-Cre mice, has not yet been registered as an autism risk gene in the SFARI database. Recent research reported that Rps4x messenger RNA was located in the axon by the 5′ UTR loop-forming motif-mediated localization and that locally synthesized Rps4x was involved in protein synthesis in the axon and regulated axon terminal branching.36 Although we have not investigated the mechanisms of impairment in behavioral outcomes and their association with Rps4x in detail, further studies are considered necessary.
We investigated the organization of ankyrin-B scaffold machinery at the synapse by examining its interactome and found that many protein binding partners are risk factors for NDDs like ASD and epilepsy. The synaptic interactors include the GluA2 AMPA receptor subunit along with other proteins involved in processes like synapse organization, synaptic vesicle clustering and cycle, and translational regulation. Loss of ankyrin-B may thus affect highly connected components of synaptic networks associated with NDDs and AMPA receptor regulation. Only three of these interactions were previously reported in BioGRID (Figure S8D). After examining the results of combining the two proteomic datasets, we propose that ankyrin-B loss depletes synapses of a scaffolding lattice that stabilizes protein mobility, leading to an influx of synaptic proteins, including AMPA receptor regulators. This, in turn, may increase AMPA receptor function, leading to increased functional connectivity, network activity, and synchrony.
Perhaps the most important implication of our proteomics findings is that therapeutic targeting of dysregulated protein networks may provide an effective strategy to validate in mutant mice presenting heterozygous mutations found in patients with ANK2 variants. In accordance with the upregulation of an AMPA receptor regulating network and interaction of ankyrin-B with GluA2, the AMPA receptor-antagonist perampanel, an anti-epileptic drug, effectively normalized neuronal activity and synchrony in the cortex of ANK2−/−:Emx1-Cre mice. In parallel, in vivo delivery of perampanel significantly improved the survival ratio of ANK2−/−:Emx1-Cre mice. These effects are likely due to AMPA receptor antagonism and not general anti-epileptic effects because valproic acid, another anti-epileptic drug acting through a GABAergic mechanism, did not show any effect. Nevertheless, the mortality of ANK2−/−:Emx1-Cre mice was partially rescued by perampanel. Epilepsy-related mortality could be fully rescued through combination therapy with other anti-epileptic drugs such as Na+ channel blockers, a K+ channel opener, and Ca2+ channel binding drugs. A recent report supports that ankyrin-B regulates dendritic localization of NaV1.2 (encoded by Scn2a) and excitability of apical dendritic regions.10
Taken together, our findings suggest that complete loss of ankyrin-B from forebrain pyramidal neurons during embryonic development leads to increased neuronal network activity and synchrony, due to upregulation of synaptic proteins, ultimately causing epilepsy and death. These phenotypes are more severe than those caused by isoform-specific truncations that may present milder forms of seizures and abnormal cortical activity that does not reach the threshold for seizures. This may have implications for other genetic risk factors and mice models, where altered network activity and synchrony may underlie ASD in milder forms and epilepsy and ASD in more severe forms.
Limitations of the study
This study shows how homozygous deletion of ANK2 in the forebrain affects neuronal activity and behavioral relevance in the early developmental period. Notably, in silico network-based approaches, performed by using protein-protein interaction, coexpression, and shared biological processes/pathways, ANK2 was identified in a high-confidence epilepsy module.37 A recent study showed that seven of 12 patients with ANK2 loss-of-function de novo variants are associated with epilepsy.38 However, whether ANK2 is an authentic epilepsy risk gene remains to be validated more by human genetic studies. In addition, large-scale exome sequencing studies have identified multiple loss-of-function missense variants in the ANK2 gene in patients with NDDs. Further studies using various missense mutation models will be necessary.
STAR★METHODS
RESOURCE AVAILABILITY
Lead contact
Further information and requests for resources should be directed to and will be fulfilled by the Lead Contact, Peter Penzes (p-penzes@northwestern.edu).
Materials availability
All unique/stable reagents generated in this study are available from the lead contact with a completed Materials Transfer Agreement.
Data and code availability
The datasets generated in this study are available via MassIVE with identifier MSV000091894. The data are publicly available.
This paper does not report original code.
The published article includes all datasets generated or analyzed during this study. All data are available from the lead contact upon request.
Any additional information required to reanalyze the data reported in this paper is available from the lead contact upon request.
EXPERIMENTAL MODEL AND STUDY PARTICIPANT DETAILS
Mice
Ankyrin-B floxed mice, which were generously given by Dr. Peter Mohler, were crossed with CaMKIIa-Cre (The Jackson Laboratory; #005359) or Emx1-Cre (The Jackson Laboratory; #005628) or NEX-Cre mice (Goebbels et al., 2006). Specific homozygous deletion of ankyrin-B (ANK2−/−:CaMKIIα-Cre) mice mated with AnkBflox/flox to maintain the colonies. To generate hemi and homozygous deletion of ankyrin-B mice (ANK2+/−:Emx1-Cre, ANK2−/−:Emx1-Cre, ANK2+/−:NEX-Cre, or ANK2−/−:NEX-Cre), the heterozygous deletion of ankyrin-B mice mated with ANK2fl/fl mice. Littermates that did not express Cre recombinase were used as control (ANK2fl/fl). The mice were housed with mixed-genotype and the same gender home cages until testing for all assays. Mice were kept within an SPF barrier area in an air-conditioned room on a 12:12 h light/dark schedule, under constant conditions of temperature and humidity. Food and tap water (membrane filter purified and autoclaved water) were provided ad libitum. All experiments were conducted with both male and female mice except behavioral studies with ANK2−/−:CaMKIIa-Cre mice, TMT LC-MS3 multinotch analysis, and IP-LC-MS/MS experiments which were used with only male mice. 4–5- or 12–14-weeks old mice were used for behavioral analyses. Postnatal day 7 pups were recorded for ultrasonic vocalization. 3 weeks old mice were used for TMT-LC/MS and network experiments, and Golgi-Cox staining. All experiments were performed in accordance with Institutional Animal Care and Use Committee (IACUC) at Northwestern University.
Neuronal cell culture and transfection
Dissociated cultures of primary cortical neurons were prepared at E18.5 from crossbreeding with ANK2fl/fl and ANK2+/−:Emx1-Cre mice. Brains were dissected in ice-cold Leibowitz’s L-15 media with penicillin/streptomycin, and cortical tissue isolated, digested with 0.25% trypsin-EDTA solution at 37°C, and mechanically dissociated in high-glucose Dulbecco’s Modified Eagle Medium (DMEM) supplemented with 10% FBS, 1.4 mM L-glutamine, and 6.0 g/L glucose. Cortical neurons were plated at 320,000 cells per 18 × 18 mm coverslip precoated with poly-D-lysine (German coverslips; GG-18–1.5-PDL). Neuronal cultures were maintained at 37°C in 5% CO2 in Neurobasal media supplemented with B27 and GlutaMax-1 and penicillin/streptomycin. Neurons were transfected at DIV6 or DIV20 with Lipofectamine 2000, providing a transfection efficiency of 2 mg pEGFP-N2 (#6801–1; Clontech) and Lipofectamine 2000 (Invitrogen) were diluted in DMEM + HEPES (10 mM), mixed thoroughly together, and incubated for 20–30 min at 37°C before adding to cultured cells. Following transfection, neurons were supplanted in antibiotic-containing feeding media containing half conditioned and half fresh media and allowed to express constructs for 1 day.
METHOD DETAILS
Immunocytochemistry and confocal microscopy
Cells were fixed for 10 min in 4% formaldehyde in PBS at 4°C. After 3 times PBS washing for 5 min, fixed neurons were permeabilized and blocked simultaneously in PBS containing 1% bovine serum albumin (BSA) and 0.3% Triton X-100 for 1 h at room temperature. Primary antibody, ankyrin-G (NeuroMab; 75–146), was added in PBS containing 1% BSA and 0.3% Triton X-100 overnight at 4°C, followed by 3 times for 10 min washes in PBS. Secondary antibody (Invitrogen; anti-mouse Alexa 647) was incubated for 1 h at room temp, also in 1% BSA and 0.3% Triton X-100 in PBS. Three further washes (5 min each) were performed before coverslips were mounted using Fluorescent Mounting Medium (Dako). Confocal images of immunostained neurons were obtained with a Nikon C2+ confocal microscope. Images of neurons at DIV7 were taken using the 63x oil-immersion objective (NA = 1.4) as z series of 15–20 images, taken at 0.4 μm intervals and 640.57 μm × 640.57 μm with 1024 × 1024 pixel resolution.
SIM imaging and analysis
With EM gain and no binning, the acquisition was set to 10 MHz, 14 bits. The EM gain multiplier restrained below 300, and auto exposure was set between 50 and 500 ms. Within the first quarter of the scale (<4000), the laser power was adjusted to keep LUTs. Images of neurons at DIV21 were taken using the 100x oil-immersion objective as z series of 3–6 images, taken at 0.24 μm intervals and 62.64 μm × 62.64 μm with 1948 × 1948 pixel resolution. Imaging and reconstruction parameters were determined with the assistance of the expertise in the Center for Advanced Microscopy at Northwestern University. The single-plane where the spine head was in focus, based on the cell fill, was chosen for analysis. Each spine head was outlined using the ImageJ software manually in the channel of the cell fill to detect the area. Within the spine head, GluA1 or GluA2 puncta was outlined manually, and the size was recorded. 81.61 ± 3.36 μm from ANK2fl/fl and 86.81 ± 4.10 μm from ANK2−/−:Emx1-Cre dendritic regions were selected, and puncta counts were made; puncta smaller than 0.006 μm2 were excluded from the analysis.
Behavior analysis
Open field test
Mice were placed in an arena measuring 56 cm × 56 cm and recorded using an overhead camera. The analysis was done using EthovisionXT software (Noldus). The software provides the total distance traveled. The locomotor activity recorded for 30 min was analyzed.
Forced swim test
The apparatus used in the forced swim test was a clear round container (20 cm high × 14 cm diameter) with a column of water (16 cm deep) maintained at 25°C. Each mouse was placed in the container for 6 min and recorded using a USB digital camera and recording software. The activity was measured only from 2 min to 6 min and scored using the mobility threshold settings within the EthovisionXT software by measuring the percentage change in an area of the tracked object from one sample to the next. Immobility was defined as less than 5% movement using these settings and was validated by a human observer.
Y maze test
The mice were placed in the Y-maze and allowed to enter any of the three arms for 5 min while being recorded by a video tracking system and the EthovisionXT software. The order of arm entries was recorded and analyzed for spontaneous alternation. An alternation was scored for each set of three consecutive choices where no repeated entries occur. The number of successive three-arm alternations was divided by the maximum number of arm entries within 5 min to yield the percentage of spontaneous alterations. Calculate the percent (%) alternation using the following formula: % Alternation = (Number of Alternations/[Total number of arm entries−2])×100. The chance level of alternation is 50%. This task requires working memory, as animals must maintain and update a mental log of recent arm entries.
Zero maze test
Mice were recorded for 10 min on a round track (56 cm diameter) divided into four sections of the equal area by two sets of walls along the track, separated by 180° around the track. Mice were placed on the track in the center of the closed area and were examined for a preference for the closed or open arms during a 10 min session recorded using an overhead camera. Meantime spent in the closed quadrants was compared among genotypes. The analysis was done using EthovisionXT software.
Light/dark box test
Mice were recorded free roaming for 5 min in an arena measuring 25 cm × 50 cm × 25 cm, with 1/2 of the arena being covered by a lid, creating dark and light compartments. Mice were placed in the light compartment of the apparatus, and they were allowed to move freely. The recorded video was analyzed by the EthovisionXT software.
Social interaction
A social approach apparatus was used to quantify the tendency of an experimental mouse to engage in social interaction with a novel mouse. The behavioral testing apparatus was a glass rectangular box (76.2 cm long × 30.5 cm wide × 30.5 cm tall). A mesh cylinder (11.4 cm diameter) was placed at each end of the chamber. The mesh cylinder allowed for air exchange and for animal auditory, visual, and olfactory interaction, but prevented fighting. For each animal, the assay consisted of a 5 min habituation phase, in which two empty mesh cylinders were present, a 5 min rest phase in a neutral cage, and a 5 min testing phase in which a stimulus mouse was placed in one of the mesh cylinders. During analysis, the arena was divided into three zones: social, nonsocial, and intermediate. The end of the arena containing the enclosed stimulus mouse was designated the social side and was alternated for each test mouse. After 30 min of the social interaction test, a new mouse (novel) was placed into the previous non-social interaction site with the same mouse (familiar) in the social interaction site to analyze the social novelty test. All stimulus mice were 12 weeks old wildtype mice, and a different stimulus mouse was used for each test mouse. The animal position was logged via automated video tracking. Time spent on each side during each phase of the test and time spent in proximity (within 5 cm) of the stimulus mouse during the test phase was recorded for each mouse and analyzed by EthovisionXT software.
USVs
Postnatal 7 days pup was separated from the home cage and placed in autoclaved rectangular polyethylene cages measuring 29 × 18 × 12.5 cm with standard bedding, covered by a metal wire lid. Both video and audio recordings of the sessions are made in sound attenuating cubicles for 5 min. Ultrasonic vocalizations (USVs) will be recorded from the high-frequency output of a Pettersson D500X Ultrasound detector/recorder. Sonograms are analyzed by Mouse Ultrasonic Profile ExTraction (MUPET) (Van Segbroeck et al., 2017) with MATLAB software (MathWorks). Frequency-modulated USVs are defined as having a bandwidth >5 kHz.
Quantitative proteomics and analysis
Littermates that 5 ANK2−/−:Emx1-Cre mice and 5 ANK2fl/fl mice (all males) from 3 cohorts were used for the proteomic analysis. 3 weeks old mouse cortex from ANK2/:Emx1-Cre was dissected and homogenized in sucrose buffer (20mM HEPES pH 7.4, 320mM sucrose, 5mM EDTA with Roche protease inhibitors) and centrifuged at 3,000 g for 20 min, 4°C. The collected supernatant was centrifuged further at 16,000 g for 30 min at 4°C to obtain membrane pellet (P2) and collect supernatant for cytosolic proteins (S2). Pellets were resuspended with binding buffer (50 mM Tris-HCl pH 7.5, 1% Triton X-100, 150 mM NaCl, 1 mM EDTA, 1mM AEBSF with protease inhibitor cocktail and phosphatase inhibitor) and solubilized for 1 h at 4°C. Next, the proteins were reduced at 5 mM DTT for 20 mins and alkylated at 15 mM iodoacetamide for 20 mins. The reaction was quenched by adding DTT to 50 mM and incubation for 15 mins. The solution was then diluted to 50 mM HEPES, 1.5 M Guanidine. 1 μg of Lys-C protease (Pierce) was added to each sample and incubated for 3 h at room temperature whilst vortexing. 2 μg of trypsin protease (Pierce) was added next and samples were incubated overnight at 37°C while vortexing. Following digestion, the samples were acidified 0.5% TFA, bound to alkylated resin (Pierce C18 spin columns), and washed with 5% acetonitrile, 0.5% TFA. Samples were eluted from the resin with 80% acetonitrile, 0.5% formic acid buffer. Eluted samples were dried down using vacuum centrifugation, and resuspended in 50 mM HEPES. MicroBCA (Pierce) was used to determine peptide mass concentration. 80 μg of each sample were aliquoted for TMT labeling with 0.4 mg of a respective TMT label (Thermo Scientific). For each of vehicle and bumetanide treatment, the samples were labeled as follows: 5 × ANK2fl/fl to labels 126, 127n, 127c, 128n, and 128c respectively; and 5 × ANK2−/−:Emx1-Cre to labels 129n, 129c, 130n, 130c, 131, respectively. Labeling reaction took place for 1 h and 15 min at room temperature. The reaction was quenched by bringing sample solutions to 0.3% (v/v) hydroxylamine and incubated for 15 min at room temperature. The ten samples (for each treatment) were then combined at a ratio of 1:1:1:1:1:1:1:1:1:1. The combined samples were then acidified to 0.5% TFA, bound to alkylated resin (HyperSep C18 vacuum cartridges), and washed with 5% acetonitrile, 0.5% TFA before being eluted with 80% acetonitrile, 0.5% formic acid. Eluted combinatory samples were dried down using vacuum centrifugation and subsequently resuspended in 0.1% TFA. Samples were fractionated using strong cation exchange nitrocellulose spin columns (Pierce). Six elution fractions for each sample were created corresponding to 50 mM sodium acetate (NaAcO), 100 mM NaAcO, 250 mM NaAcO, 500 mM NaAcO, 1 M NaAcO, and 4 M NaAcO. Every fraction was desalted by acidification to pH = 2 with TFA, binding to alkylated resin (Pierce C18 spin columns), washing with 5% acetonitrile, 0.5% TFA and eluted with 80% acetonitrile, 0.5% formic acid. Fractions were dried using vacuum centrifugation, and resuspended in LCMS Buffer A: 5% acetonitrile, 0.125% formic acid. Fractions were quantified using microBCA (Pierce).
3 μg from each fraction were loaded for LC-MS analysis using a Thermo Orbitrap Fusion coupled to a Thermo EASY nLC-1200 UPLC pump and vented Acclaim Pepmap 100, 75 μm × 2 cm nanoViper trap column and nanoViper analytical column: Thermo—164570, 3 μm, 100 Å, C18, 0.075 mm, 500 mm with stainless steel emitter tip assembled on the Nanospray Flex Ion Source with a spray voltage of 2000V. For the chromatographic run, Buffer A contained (as above) and Buffer B contained 95% acetonitrile, 0.125% formic acid. A 4-h gradient was established beginning with 100% A, 0% B and increased to 7% B over 5 mins, then to 25% B over 160 mins, 36% B over 40 mins, 45% B over 10 mins, 95% B over 10 mins, and held at 95% B for 15 mins before terminating the scan. The multinotch MS3 method parameters include: Ion transfer tube temp = 300°C, Easy-IC internal mass calibration, default charge state = 2 and cycle time = 3 s. MS1 detector set to orbitrap with 60 K resolution, wide quad isolation, mass range = normal, scan range = 300–1800 m/z, max injection time = 50 m, AGC target = 2 3 105, microscans = 1, RF lens = 60%, without source fragmentation, and datatype = positive and centroid. MIPS was set as on, included charge states 2–7 and reject unassigned. Dynamic exclusion was enabled with n = 1 exclusion for 60 s with 10 ppm tolerance for high and low. An intensity threshold was set to 5 × 10³. Precursor selection decision = most intense, top speed, 3 s. MS2 settings include isolation window = 0.7, scan range = auto normal, collision energy = 35% CID, scan rate = turbo, max injection time = 50 m, AGC target = 1 × 10⁴, Q = 0.25. The top ten precursors were selected for MS3 analysis. Precursors were fragmented using 65% HCD before orbitrap detection. A precursor selection range of 400–1200 m/z was chosen with mass range tolerance. An exclusion mass width was set to 18 ppm on the low and 5 ppm on the high. Isobaric tag loss exclusion was set to TMT reagent. Additional MS3 settings include an isolation window = 2, orbitrap resolution = 60 K, scan range = 120–500 m/z, AGC target = 1*104, max injection time = 120 m, microscans = 1, and datatype = profile.
Spectral raw files were extracted into MS1, MS2, and MS3 files using the in-house program RawConverter. Spectral files were pooled from fractions and an unfractionated portion for each sample and searched against the UniProt mouse protein database (reviewed_iso_cont_3_25_14) and matched to sequences using the ProLuCID/SEQUEST algorithm (ProLuCID ver. 3.1) with 50 p.p.m. peptide mass tolerance for precursor ions and 600 p.p.m. for fragment ions. The search space included all fully and half-tryptic peptide candidates that fell within the mass tolerance window with no miscleavage constraint, assembled and filtered with DTASelect2 (ver. 2.1.3) through the Integrated Proteomics Pipeline (IP2 v.5.0.1, Integrated Proteomics Applications, Inc., CA, USA). Static modifications included 57.02146 C and 229.162932 K and N-term. Peptide probabilities and false discovery ratios were produced using a target/decoy approach. Each protein identified was required to have a minimum of one peptide of minimal length five. A false discovery rate of 1% was used for data filtering. Isobaric labeling analysis was performed with Census 2. TMT channels were normalized by dividing it over the sum of all channels. No intensity threshold was applied.
To calculate the fold change ANK2−/−:Emx1-Cre vs. ANK2fl/fl, the normalized average intensity values for proteins from Census were used and the values were standardized to the mean of the five ANK2fl/fl samples. The fold change could then be calculated as the mean of the ANK2−/−:Emx1-Cre standardized values. p values were calculated by one-tailed Student’s t-test. For GO analysis, the list of significantly upregulated or downregulated proteins was queried against all proteins quantified in the dataset using a statistical overrepresentation test of the SynGO. Biological processes which were a subset of a larger group that was also statistically significant defaulted to the more encompassing annotation and its associated q-value.
Coimmunoprecipitation assays
The cortex of 3 weeks old ANK2fl/fl mouse was dissected and homogenized in sucrose buffer (20mM HEPES pH 7.4, 320mM sucrose, 5mM EDTA with Roche protease inhibitors) and centrifuged at 3,000 g for 20 min, 4⁰C. The collected supernatant was centrifuged further at 16,000 g for 30 min at 4°C to obtain membrane pellet (P2) and collect supernatant for cytosolic proteins (S2). Pellets were resuspended with binding buffer (50 mM Tris-HCl pH 7.5, 1% Triton X-100, 150 mM NaCl, 1 mM EDTA, 1mM AEBSF with protease inhibitor cocktail and phosphatase inhibitor) and solubilized for 1 h at 4°C. Proteins were immunoprecipitated with 3 μg of antibody overnight at 4°C, followed by 1 h incubation with protein A/G beads. Beads were then washed extensively, and bound complexes were analyzed by SDS-PAGE and western blotting.
Gene set analysis
A list of genome-wide significant BD risk factors was compiled from published GWAS (Hou et al., 2016; Iossifov et al., 2014). de novo variants from exome sequencing studies in ASD and SZ were acquired from the SFARI Gene database and supplementary material (De Rubeis et al., 2014; Fromer et al., 2014; Iossifov et al., 2014). Neuropsychiatric risk gene sets from de novo exome sequencing data were filtered to only include variants predicted to affect protein sequence (i.e. missense, frameshift, nonsense, splice-site, and start lost mutations). A hypergeometric test was used to test for the statistical significance of each overlap.
Golgi-Cox staining
Deeply anesthetized ANK2fl/fl or ANK2−/−:Emx1-Cre mice were sacrificed. The brain was removed from the skull as quickly as possible. Next procedures were followed by the manufacturer’s instructions (FD Rapid GolgiStain Kit). Mounted samples which cut 100 μm thickness sections were imaged on a microscope (C2+ microscope; Nikon) using a 63x oil-immersion objective lens (NA = 1.4). For apical dendritic spine quantification, only the first branch of apical dendrite over 100 μm away from cell body was concerned for the analysis of spine linear density (# of spines/10 μm dendritic length).
In vivo calcium imaging and analysis
2 weeks old three ANK2−/−:Emx1-Cre and three ANK2fl/fl were deeply anesthetized with isoflurane (3.5% in 100% O2), decapitated and the brain is rapidly extracted and placed in ice-cold high Mg2+/low Ca2+ artificial cerebrospinal fluid (aCSF) (95% O2, 5% CO2, pH = 7.3). After 1h of recovery at 33°C, slices are incubated with the cell-permeant calcium sensor Cal520 AM and the astrocytespecific marker Sulforhodamine 101 (SR101) in 95% O2, 5% CO2 for 45 min. Slices are then washed in recovery aCSF for at least 30 min before imaging. The Layer2/3 of the somatosensory1 area is then placed under a multiphoton laser-scanning microscope and superfused with aCSF at 3 mL/min at 33°C Cal520 signal is acquired at 4.8 frames per seconds with a laser power around 20 mW at 820 nm. Synchronized spontaneous network events are induced by changing the aCSF to a 0 Magnesium aCSF. Region of interests (ROIs) segmenting the somas are detected on ImageJ using a custom-made script detecting the contour of elements with a size ranging from 40 to 500 μm2 and presenting a Z score variation of intensity equal or superior to 2.5: showing the presence of calcium transients. Calcium signal is then imported in MATLAB, normalized using local baseline and smoothed with a wavelet filter. The signal changes are expressed in the percentage of variation around the baseline (ΔF/F0). Calcium events are automatically detected using the “findpeaks” function of the software with a minimum of 20% variation above the baseline. Cells presenting no peaks are automatically discarded from the analysis. A Monte-Carlo simulation using 1,000 permutations of the peaks for each neuron is used to unbiasedly detect the minimal number of co-active cells that can be considered as a synchronized network event (threshold equal to the 99.9 percentile of the sum of events for the 1000 simulations). Another independent method to assess the synchrony we use is the pairwise correlation that measures the R2 coefficient correlation (0 is equal to uncorrelated and +1 equal to perfect correlation) for the signals of all pairs of neurons.
Drug treatment
Perampanel (0.2 mg/kg) was given by i.p. injection every day (except Sunday) from P21 to P60. Valproate was given via chow food from P21 to P60. Mice were fed with chow containing 1.7% sodium valproic acid (Zhu et al., 2017).
QUANTIFICATION AND STATISTICAL ANALYSIS
All statistical tests were performed with GraphPad Prism9. A two-sample comparison was performed using unpaired Student’s t-test, and multiple comparisons were made using two-way ANOVA or one-way ANOVA followed by a Bonferroni test. Bar graphs are displayed as mean ± SEM. Significance was shown with an asterisk represents *p < 0.05, **p < 0.01, ***p < 0.001.
Supplementary Material
KEY RESOURCES TABLE
| REAGENT or RESOURCE | SOURCE | IDENTIFIER |
|---|---|---|
| Antibodies | ||
| Mouse monoclonal anti-AnkB | NeuroMab | Cat#75–144; RRID: AB_10673094 |
| Rabbit polyclonal anti-Kalirin | MilliPORE SiGMA | Cat#07–122; RRID: AB 310380 |
| Rabbit polyclonal anti-RPS4X | Proteintech | Cat# 14799–1-AP; RRID: AB 2238567 |
| Mouse monoclonal anti-Sodium Potassium ATPase Alpha 1 | NOVUS BIOLOGICALS | Cat# NB300–146; RRID: AB 2060981 |
| Rabbit monoclonal anti-NF-L | Abcam | Cat# ab223343; RRID: AB 2891198 |
| Rabbit monoclonal anti-GAPDH | Cell Signaling | Cat# 5174; RRID: AB 10622025 |
| Rabbit polyclonal anti-Shank3 | Synaptic Systems | Cat#162 302; RRID: AB_2619862 |
| Rabbit polyclonal anti-GluA1 | MilliPORE SiGMA | Cat#AB1504; RRID: AB_2113602 |
| Rabbit polyclonal anti-GluA2 | MilliPORE SiGMA | Cat#AB10529; RRID: AB_10807819 |
| Mouse monoclonal anti-AnkG | NeuroMab | Cat#75–146; RRID: AB_10673030 |
| Goat anti-mouse 647 | Thermo Fisher Scientific | Cat#A-21134; RRID: AB_2535773 |
| Bacterial and virus strains | ||
| E. coli HST08 | TaKaRa | Cat#636766 |
| Chemicals, peptides, and recombinant proteins | ||
| Perampanel | Toronto Research Chemicals | Cat#P285520 |
| Valproic acid sodium salt | Millipore SiGMA | Cat#P4543 |
| Tetrodotoxin | TOCRIS | Cat#1078 |
| Critical commercial assays | ||
| Micro BCA™ Protein Assay Kit | Thermo Fisher Scientific | Cat#23235 |
| TMT10plex™ Isobaric Label Reagents and Kits | Thermo Fisher Scientific | Cat#90113 |
| FD Rapid GlogiStain Kit | FD NeuroTechnologies, Inc. | Cat#PK401 |
| Deposited data | ||
| Raw Mass Spectrometry Data Files | This paper | MSV000091894 |
| Experimental models: Organisms/strains | ||
| Mouse/B6.129(Cg)-ANK2tm1.1Pmoh/MnrJ | The Jackson Laboratory | #031428 |
| Mouse/B6.Cg-Tg(Camk2a-cre)T29–1Stl/J | The Jackson Laboratory | #005359 |
| Mouse/B6.129S2-Emx1tm1(cre)Krj/J | The Jackson Laboratory | #005628 |
| Mouse/B6.129(Cg)-Tg(NEX-cre) | Goebbels et al., 2006 | N/A |
| Oligonucleotides | ||
| AnkB F: GC AGTC TCA ACA CAA CTA AGC CAT CCT TTT | Dr. Peter Mohler | N/A |
| AnkB R: GCT GAG GAG GTA GAC AAG AAC CTT TTT GTG | Dr. Peter Mohler | N/A |
| Camk2a F: GTT CTC CGT TTG CAC TCA GG | The Jackson Laboratory | N/A |
| Camk2a R: CAG GTT CTT GCG AAC CTC AT | The Jackson Laboratory | N/A |
| Emx1 F: CAA CGG GGA GGA CAT TGA | The Jackson Laboratory | N/A |
| Emx1 R: TCG ATA AGC CAG GGG TTC | The Jackson Laboratory | N/A |
| NEX F: GAG TCC TGG AAT CAG TCT TTT TC | Goebbels et al., 2006 | N/A |
| NEX R: CCG CAT AAC CAG TGA AAC AG | Goebbels et al., 2006 | N/A |
| Recombinant DNA | ||
| pEGFP-N2 | Clontech | #6801–1 |
| Software and algorithms | ||
| FIJI (ImageJ) | NIH | https://fiji.sc/ |
| NIS-Elements v4.51.00 | Nikon | https://www.microscope.healthcare.nikon.com/products/software/nis-elements |
| Prism 9 | GraphPad | http://www.graphpad.com/scientific-software/prism/ |
| MATLAB | MathWorks | https://www.mathworks.com/products/matlab.html |
| MUPET | USC | https://sail.usc.edu/mupet/ |
| ProLuCID ver. 3.1 | prolucid | https://www.prolucid.ca/ |
| IP2 v.5.0.1 | Integrated Proteomics Applications Inc. | www.integratedproteomics.com |
| SynGO | SYNGO | https://www.syngoportal.org/ |
| Image Lab 3.0 | Bio-Rad Laboratories | http://www.bio-rad.com/en-us/product/image-lab-software |
Highlights.
ANK2-deficient mice show spontaneous seizures and increased mortality
ANK2-deficient mice show increased neuronal excitability and network synchrony
Proteomic analysis reveals specific alterations in the postsynaptic proteome
AMPAR antagonist improves circuit deficits and survival endpoints in cKO mice
ACKNOWLEDGMENTS
This work was supported by R01MH107182 to P.P. and an Individual Biomedical Research Award from The Hartwell Foundation (J.N.S). This work was supported by Northwestern University’s Center for Advanced Microscopy and a Cancer Center Support Grant (NCI CA060553), as well as the Northwestern University Behavioral Phenotyping Core. Graphical abstract, Figure 3A, and Figure 4A were created with Biorender.com (https://biorender.com/).
Footnotes
SUPPLEMENTAL INFORMATION
Supplemental information can be found online at https://doi.org/10.1016/j.celrep.2023.112784.
DECLARATION OF INTERESTS
The authors declare that they have no conflict of interest.
REFERENCES
- 1.Besag FMC, and Vasey MJ (2020). Seizures and Epilepsy in Autism Spectrum Disorder. Child Adolesc. Psychiatr. Clin. N. Am 29, 483–500. 10.1016/j.chc.2020.02.002. [DOI] [PubMed] [Google Scholar]
- 2.Tuchman R (2015). Autism and Cognition Within Epilepsy: Social Matters. Epilepsy Curr. 15, 202–205. 10.5698/1535-7511-15.4.202. [DOI] [PMC free article] [PubMed] [Google Scholar]
- 3.Forrest MP, Parnell E, and Penzes P (2018). Dendritic structural plasticity and neuropsychiatric disease. Nat. Rev. Neurosci 19, 215–234. 10.1038/nrn.2018.16. [DOI] [PMC free article] [PubMed] [Google Scholar]
- 4.Sanders SJ, He X, Willsey AJ, Ercan-Sencicek AG, Samocha KE,Cicek AE, Murtha MT, Bal VH, Bishop SL, Dong S, et al. (2015). Insights into Autism Spectrum Disorder Genomic Architecture and Biology from 71 Risk Loci. Neuron 87, 1215–1233. 10.1016/j.neuron.2015.09.016. [DOI] [PMC free article] [PubMed] [Google Scholar]
- 5.Satterstrom FK, Kosmicki JA, Wang J, Breen MS, De Rubeis S,An JY, Peng M, Collins R, Grove J, Klei L, et al. (2020). Large-Scale Exome Sequencing Study Implicates Both Developmental and Functional Changes in the Neurobiology of Autism. Cell 180, 568–584.e23. 10.1016/j.cell.2019.12.036. [DOI] [PMC free article] [PubMed] [Google Scholar]
- 6.Koenig SN, and Mohler PJ (2017). The evolving role of ankyrin-B in cardiovascular disease. Heart Rhythm 14, 1884–1889. 10.1016/j.hrthm.2017.07.032. [DOI] [PMC free article] [PubMed] [Google Scholar]
- 7.Guan H, and Maness PF (2010). Perisomatic GABAergic innervation inprefrontal cortex is regulated by ankyrin interaction with the L1 cell adhesion molecule. Cerebr. Cortex 20, 2684–2693. 10.1093/cercor/bhq016. [DOI] [PMC free article] [PubMed] [Google Scholar]
- 8.Galiano MR, Jha S, Ho TSY, Zhang C, Ogawa Y, Chang KJ,Stankewich MC, Mohler PJ, and Rasband MN (2012). A distal axonal cytoskeleton forms an intra-axonal boundary that controls axon initial segment assembly. Cell 149, 1125–1139. 10.1016/j.cell.2012.03.039. [DOI] [PMC free article] [PubMed] [Google Scholar]
- 9.Lorenzo DN, Badea A, Davis J, Hostettler J, He J, Zhong G,Zhuang X, and Bennett V (2014). A PIK3C3-ankyrin-B-dynactin pathway promotes axonal growth and multiorganelle transport. J. Cell Biol 207, 735–752. 10.1083/jcb.201407063. [DOI] [PMC free article] [PubMed] [Google Scholar]
- 10.Nelson AD, Catalfio AM, Gupta JM, Min L, Caballero-Floran RN,Dean KP, Elvira CC, Derderian KD, Kyoung H, Sahagun A, et al. (2022). Physical and functional convergence of the autism risk genes Scn2a and ANK2 in neocortical pyramidal cell dendrites. Preprint at bioRxiv. 10.1101/2022.05.31.494205. [DOI] [PMC free article] [PubMed] [Google Scholar]
- 11.Yang R, Walder-Christensen KK, Kim N, Wu D, Lorenzo DN, Badea A, Jiang YH, Yin HH, Wetsel WC, and Bennett V (2019). ANK2 autism mutation targeting giant ankyrin-B promotes axon branching and ectopic connectivity. Proc. Natl. Acad. Sci. USA 116, 15262–15271. 10.1073/pnas.1904348116. [DOI] [PMC free article] [PubMed] [Google Scholar]
- 12.Scotland P, Zhou D, Benveniste H, and Bennett V (1998). Nervous system defects of AnkyrinB (−/−) mice suggest functional overlap between the cell adhesion molecule L1 and 440-kD AnkyrinB in premyelinated axons. J. Cell Biol 143, 1305–1315. 10.1083/jcb.143.5.1305. [DOI] [PMC free article] [PubMed] [Google Scholar]
- 13.Spratt PWE, Ben-Shalom R, Keeshen CM, Burke KJ Jr., Clarkson RL, Sanders SJ, and Bender KJ (2019). The Autism-Associated Gene Scn2a Contributes to Dendritic Excitability and Synaptic Function in the Prefrontal Cortex. Neuron 103, 673–685.e5. 10.1016/j.neuron.2019.05.037. [DOI] [PMC free article] [PubMed] [Google Scholar]
- 14.Gorski JA, Talley T, Qiu M, Puelles L, Rubenstein JLR, and Jones KR (2002). Cortical excitatory neurons and glia, but not GABAergic neurons, are produced in the Emx1-expressing lineage. J. Neurosci 22, 6309–6314. 20026564. [DOI] [PMC free article] [PubMed] [Google Scholar]
- 15.Ning Y, Noebels JL, and Aiba I (2022). Emx1-Cre Is Expressed in Peripheral Autonomic Ganglia That Regulate Central Cardiorespiratory Functions. eNeuro 9, ENEURO.0093, 22.2022. 10.1523/ENEURO.0093-22.2022. [DOI] [PMC free article] [PubMed] [Google Scholar]
- 16.Maenner MJ, Shaw KA, Bakian AV, Bilder DA, Durkin MS, Esler A, Furnier SM, Hallas L, Hall-Lande J, Hudson A, et al. (2021). Prevalence and Characteristics of Autism Spectrum Disorder Among Children Aged 8 Years - Autism and Developmental Disabilities Monitoring Network, 11 Sites, United States, 2018. MMWR. Surveill. Summ 70, 1–16. 10.15585/mmwr.ss7011a1. [DOI] [PMC free article] [PubMed] [Google Scholar]
- 17.Koopmans F, van Nierop P, Andres-Alonso M, Byrnes A, Cijsouw T,Coba MP, Cornelisse LN, Farrell RJ, Goldschmidt HL, Howrigan DP, et al. (2019). SynGO: An Evidence-Based, Expert-Curated Knowledge Base for the Synapse. Neuron 103, 217–234.e4. 10.1016/j.neuron.2019.05.002. [DOI] [PMC free article] [PubMed] [Google Scholar]
- 18.Le Scouarnec S, Bhasin N, Vieyres C, Hund TJ, Cunha SR, Koval O, Marionneau C, Chen B, Wu Y, Demolombe S, et al. (2008). Dysfunction in ankyrin-B-dependent ion channel and transporter targeting causes human sinus node disease. Proc. Natl. Acad. Sci. USA 105, 15617–15622. 10.1073/pnas.0805500105. [DOI] [PMC free article] [PubMed] [Google Scholar]
- 19.Choi CSW, Souza IA, Sanchez-Arias JC, Zamponi GW, Arbour LT, and Swayne LA (2019). Ankyrin B and Ankyrin B variants differentially modulate intracellular and surface Cav2.1 levels. Mol. Brain 12, 75. 10.1186/s13041-019-0494-8. [DOI] [PMC free article] [PubMed] [Google Scholar]
- 20.Forrest MP, Dos Santos M, Piguel NH, Wang YZ, Hawkins NA,Bagchi VA, Dionisio LE, Yoon S, Simkin D, Martin-de-Saavedra MD, et al. (2023). Rescue of neuropsychiatric phenotypes in a mouse model of 16p11.2 duplication syndrome by genetic correction of an epilepsy network hub. Nat. Commun 14, 825. 10.1038/s41467-023-36087-x. [DOI] [PMC free article] [PubMed] [Google Scholar]
- 21.Brewer GJ, Boehler MD, Pearson RA, DeMaris AA, Ide AN, andWheeler BC (2009). Neuron network activity scales exponentially with synapse density. J. Neural. Eng 6, 014001. 10.1088/1741-2560/6/1/014001. [DOI] [PMC free article] [PubMed] [Google Scholar]
- 22.Kline CF, Scott J, Curran J, Hund TJ, and Mohler PJ (2014). Ankyrin-B regulates Cav2.1 and Cav2.2 channel expression and targeting. J. Biol. Chem 289, 5285–5295. 10.1074/jbc.M113.523639. [DOI] [PMC free article] [PubMed] [Google Scholar]
- 23.Garcia-Caballero A, Zhang FX, Hodgkinson V, Huang J, Chen L,Souza IA, Cain S, Kass J, Alles S, Snutch TP, and Zamponi GW (2018). T-type calcium channels functionally interact with spectrin (alpha/beta) and ankyrin B. Mol. Brain 11, 24. 10.1186/s13041-018-0368-5. [DOI] [PMC free article] [PubMed] [Google Scholar]
- 24.Marshel JH, Kim YS, Machado TA, Quirin S, Benson B, Kadmon J, Raja C, Chibukhchyan A, Ramakrishnan C, Inoue M, et al. (2019). Cortical layer-specific critical dynamics triggering perception. Science 365, eaaw5202. 10.1126/science.aaw5202. [DOI] [PMC free article] [PubMed] [Google Scholar]
- 25.Bodakuntla S, Nedozralova H, Basnet N, and Mizuno N (2021). Cytoskeleton and Membrane Organization at Axon Branches. Front. Cell Dev. Biol 9, 707486. 10.3389/fcell.2021.707486. [DOI] [PMC free article] [PubMed] [Google Scholar]
- 26.Xie Z, Srivastava DP, Photowala H, Kai L, Cahill ME, Woolfrey KM, Shum CY, Surmeier DJ, and Penzes P (2007). Kalirin-7 controls activity-dependent structural and functional plasticity of dendritic spines. Neuron 56, 640–656. 10.1016/j.neuron.2007.10.005. [DOI] [PMC free article] [PubMed] [Google Scholar]
- 27.Herring BE, and Nicoll RA (2016). Kalirin and Trio proteins serve criticalroles in excitatory synaptic transmission and LTP. Proc. Natl. Acad. Sci. USA 113, 2264–2269. 10.1073/pnas.1600179113. [DOI] [PMC free article] [PubMed] [Google Scholar]
- 28.Rao S, Kay Y, and Herring BE (2019). Tiam1 is Critical for Glutamatergic Synapse Structure and Function in the Hippocampus. J. Neurosci 39, 9306–9315. 10.1523/JNEUROSCI.1566-19.2019. [DOI] [PMC free article] [PubMed] [Google Scholar]
- 29.Kato AS, Gill MB, Ho MT, Yu H, Tu Y, Siuda ER, Wang H, Qian YW, Nisenbaum ES, Tomita S, and Bredt DS (2010). Hippocampal AMPA receptor gating controlled by both TARP and cornichon proteins. Neuron 68, 1082–1096. 10.1016/j.neuron.2010.11.026. [DOI] [PMC free article] [PubMed] [Google Scholar]
- 30.Chapman G, Shanmugalingam U, and Smith PD (2019). The Role of Neuronal Pentraxin 2 (NP2) in Regulating Glutamatergic Signaling and Neuropathology. Front. Cell. Neurosci 13, 575. 10.3389/fncel.2019.00575. [DOI] [PMC free article] [PubMed] [Google Scholar]
- 31.Pielage J, Cheng L, Fetter RD, Carlton PM, Sedat JW, and Davis GW (2008). A presynaptic giant ankyrin stabilizes the NMJ through regulation of presynaptic microtubules and transsynaptic cell adhesion. Neuron 58, 195–209. 10.1016/j.neuron.2008.02.017. [DOI] [PMC free article] [PubMed] [Google Scholar]
- 32.Yuan A, Veeranna, Sershen H, Sershen H, Basavarajappa BS,Smiley JF, Hashim A, Bleiwas C, Berg M, Guifoyle DN, Subbanna S, et al. (2018). Neurofilament light interaction with GluN1 modulates neurotransmission and schizophrenia-associated behaviors. Transl. Psychiatry 8, 167. 10.1038/s41398-018-0194-7. [DOI] [PMC free article] [PubMed] [Google Scholar]
- 33.Ehlers MD, Fung ET, O’Brien RJ, and Huganir RL (1998). Splice variant-specific interaction of the NMDA receptor subunit NR1 with neuronal intermediate filaments. J. Neurosci 18, 720–730. [DOI] [PMC free article] [PubMed] [Google Scholar]
- 34.Anitha A, Nakamura K, Thanseem I, Yamada K, Iwayama Y, Toyota T, Matsuzaki H, Miyachi T, Yamada S, Tsujii M, et al. (2012). Brain region-specific altered expression and association of mitochondria-related genes in autism. Mol. Autism 3, 12. 10.1186/2040-23923-12. [DOI] [PMC free article] [PubMed] [Google Scholar]
- 35.He WC, Zhang XJ, Zhang YQ, and Zhang WJ (2020). Elevated serum neurofilament light chain in children autism spectrum disorder: A case control study. Neurotoxicology 80, 87–92. 10.1016/j.neuro.2020.06.012. [DOI] [PubMed] [Google Scholar]
- 36.Shigeoka T, Koppers M, Wong HHW, Lin JQ, Cagnetta R, Dwivedy A, de Freitas Nascimento J, van Tartwijk FW, Ströhl F, Cioni JM, et al. (2019). On-Site Ribosome Remodeling by Locally Synthesized Ribosomal Proteins in Axons. Cell Rep. 29, 3605–3619.e10. 10.1016/j.celrep.2019.11.025. [DOI] [PMC free article] [PubMed] [Google Scholar]
- 37.Peng J, Zhou Y, and Wang K (2021). Multiplex gene and phenotype network to characterize shared genetic pathways of epilepsy and autism. Sci. Rep 11, 952. 10.1038/s41598-020-78654-y. [DOI] [PMC free article] [PubMed] [Google Scholar]
- 38.Teunissen MWA, Lewerissa E, van Hugte EJH, Wang S, Ockeloen CW, Koolen DA, Pfundt R, Marcelis CLM, Brilstra E, Howe JL, et al. (2023). ANK2 loss-of-function variants are associated with epilepsy, and lead to impaired axon initial segment plasticity and hyperactive network activity in hiPSC-derived neuronal networks. Hum. Mol. Genet d-dad081 10.1093/hmg/ddad081. [DOI] [PMC free article] [PubMed] [Google Scholar]
Associated Data
This section collects any data citations, data availability statements, or supplementary materials included in this article.
Supplementary Materials
Data Availability Statement
The datasets generated in this study are available via MassIVE with identifier MSV000091894. The data are publicly available.
This paper does not report original code.
The published article includes all datasets generated or analyzed during this study. All data are available from the lead contact upon request.
Any additional information required to reanalyze the data reported in this paper is available from the lead contact upon request.