

Abstract
Facilitative carbohydrate transporters (GLUTs, SLC2 gene family) are transmembrane proteins transporting hexoses and other sugars based on cellular metabolic demands. While a direct link between GLUTs and metabolic disorders has framed them as important biological and medicinal targets, targeting disease-relevant GLUTs remains challenging. In this study, we aimed to identify substrate–GLUT interactions that would discriminate between major fructose transporters. We examined the uptake distribution for conformational and configurational isomers of fructose using the corresponding conformationally locked fluorescently labeled mimetics as probes for assessing GLUT preferences in real time. Through comparative analysis of the uptake of the probes in the yeast-based single GLUT expression systems and the multi-GLUT mammalian cell environment, we established the ability of fructose transporters to discriminate between fructose conformers and epimers. We demonstrated that recreating the conformational and configurational mixture of fructose with molecular probes allows for the specific probe distribution, with fructofuranose mimetic being taken up preferentially through GLUT5 and β-d-fructopyranose mimetic passing through GLUT2. The uptake of α-d-fructopyranose mimetic was found to be independent of GLUT5 or GLUT2. The results of this study provide a new approach to analyzing GLUT5 and GLUT2 activity in live cells, and the findings can be used as a proof-of-concept for multi-GLUT activity screening in live cells. The research also provides new knowledge on substrate–GLUT interactions and new tools for monitoring alterations in GLUT activities.
Graphical Abstract

INTRODUCTION
The family of GLUTs (SLC2 gene family) includes 14 members that mainly transport glucose through the cellular membrane.1 In addition, GLUTs transport galactose, fructose, and other carbohydrates. Most GLUTs are promiscuous These transporters have different distribution patterns and expression levels across tissues.2 Among GLUTs, a selected few show specific links with diseases, suggesting that targeting them can improve the discrimination between normal and diseased cells. Deregulation in the non-specific glucose/fructose transporter GLUT2 is linked to obesity and diabetes3 and is a prognostic factor for liver cancers.4 Glucose-transporting GLUT3 exhibits increased expression in various types of cancer, while it is primarily expressed strictly in the brain.5 Fructose-specific GLUT5 is associated with various cancers, as well as with obesity, fatty liver disease, and other metabolic deregulations.6 The non-specific glucose and fructose transporter GLUT12 is linked to early-stage and late-stage breast cancers.7
Among GLUTs, fructose transporters have been particularly investigated as important biological and medicinal targets8,9 due to their connection to the development of various metabolic disorders. Between fructose-transporting GLUTs, only GLUT5 has been established as fructose-specific (Km ~ 11–16 mM).10,11 GLUT2 is a non-specific low-affinity and high-capacity transporter12 that can transport glucose (Km ~ 17 mM), fructose (~76 mM), galactose (~92 mM), and glucosamine (0.8 mM).13 Interestingly, despite the low sensitivity to fructose, the high-capacity GLUT2 is a primary fructose transporter in the liver (where GLUT5 is absent). Furthermore, GLUT12 has been suggested to significantly contribute to fructose uptake even in the presence of GLUT5.14 While the need for fructose transporters is primarily justified by its nutritional properties, the impact of fructose appears to be much broader. As a nutrient, fructose directly participates in glycolysis and increases cell proliferation and migration.15,16 Fructose also acts as a signaling molecule in cell proliferation. Moreover, short-term exposure to fructose appears to play a protective antiapoptotic role in cancers by inhibiting reactive oxygen species production.17 All these multidirectional effects are hallmarks of fructose metabolism for different cancer types and subtypes.
Despite the essential role that GLUTs play in health and disease, our understanding of each GLUT’s roles and the ability to target relevant GLUTs for disease diagnosis and therapy are very limited. Efforts toward GLUT-targeted delivery of imaging and bioactive agents have identified the need to target disease-relevant GLUT(s) to achieve discrimination in diagnostic and therapeutic applications. Current developments toward specific targeting of individual disease-relevant GLUTs encompass screening for high-affinity ligands as GLUT inhibitors.11,18,19 Some progress has been made toward designing substrates that pass through a particular transporter and serve as analytical tools. For example, specific targeting of fructose transporter GLUT5 has been achieved using 2,5-anhydro-d-mannitol as a cargo carrier.10,20,21 Specific targeting of any other individual GLUT transporter, however, remains a challenge.
In this work, we explored the feasibility of discriminating between fructose transporters through conformational and configurational isomers of fructose. A significant difference between the two major fructose transporters—GLUT5 and GLUT2—is their substrate specificity (GLUT5) or their lack thereof (GLUT2). We hypothesized that the configurational diversity of fructose might play a leading role in directing fructose through different GLUTs. To assess this hypothesis, we designed conformationally and configurationally locked fructose mimetics and explored their uptake efficiencies and transporter specificities using yeast-based single-GLUT expression models and the multi-GLUT environment of mammalian cells. As a result, we demonstrate that locking the conformational flexibility of fructose through the removal of the anomeric hydroxyl and limiting its position within the GLUT5 binding site through derivatization promote substrate discrimination. When used as a mixture representing the nutrition-like, configurationally rich fructose environment, the respective coumarin derivatives enable probe distribution between specific and non-specific fructose GLUTs and allow us to delineate the activity of GLUT2. The outcomes provide important insights into substrate distribution between GLUTs during fructose uptake in mammalian cells and set the basis for developing GLUT2-specific analytical probes or activity modulators using configurational isomers of fructopyranose. The results also show experimental conditions for simultaneous fluorescence activity screening for specific and non-specific fructose GLUTs in live cells.
RESULTS AND DISCUSSION
Probe Design.
It is noteworthy that, unlike configurationally stable glucose, a solution of fructose represents the α- and β-mixture of pyranose (six-membered ring) and furanose (five-membered ring), with β-fructopyranose tautomer being the most dominant (~70%) in deuterated aqueous media (Figure 1).16,22 The pyranose form is stabilized by the internal hydrogen (H−) bonding of the chair configuration, while the furanose form may be energetically stabilized upon the solvation, forming intermolecular H-bonding.23 In addition to β-anomers, α-anomers were found to appear over time upon the change of the solution to ethanol/DMSO, showing that the fructose configuration and anomeric equilibrium depend on the environment,24 and suggesting the existence of fructofuranose and fructopyranose in both anomeric forms within the cellular environment.
Figure 1.

Fluorescently labeled stable furanose and pyranose mimetics of fructose as probes to assess GLUT transport preference.
Within the mammalian cell, the fructose uptake by GLUT5 was well studied. It has been shown that, while GLUT5 can transport fructose in the furanose and pyranose conformation with similar relative efficiency,25 the uptake of the furanose conformation appears to be GLUT5-specific.20,21,25 Considering the specific uptake of furanose through GLUT5 and the ability of non-specific transporters to pass hexoses predominately in a pyranose configuration (e.g., glucose, galactose), we hypothesized that configurational restrictions might play a leading role in directing fructose through non-specific versus specific GLUTs and may provide an approach for targeting non-specific GLUTs.
To explore the uptake distribution of fructose isomers (Figure 1A), we designed the corresponding configurationally locked mimetics (Figure 1B). The design of probes accounted for the lack of contribution from the anomeric hydroxyl on fructose uptake and the prospect of achieving configurationally locked substrates upon its removal, as exemplified by the GLUT5-targeting furanose mimetic 2,5-anhydro-d-mannitol25 (Figure 1B, 1). Additionally, the presence of the primary hydroxyl provides a convenient site for functionalization by the fluorophore to obtain the target fluorescently labeled sugar mimetics. Hence, we have applied this strategy to pyranose isomers and designed configurationally locked pyranose mimetics (Figure 1B, compounds 2 and 3) by removing the anomeric hydroxyls and installing a fluorescent label at position C1.
Fluorescently labeled furanose mimetic of fructose—β-d-FurCou (Figure 1C, P1) was synthesized from d-glucosamine according to the previously reported procedure.21 Configurationally locked pyranose mimetic of β-d-fructopyranose (Figure 1C, P2) and α-d-fructopyranose (Figure 1C, P3) were synthesized from α-methyl d-mannopyranoside (4) and α-methyl l-gulopyranoside (5), respectively (Scheme 1, see the Supporting Information for synthesis details). Initially, the α-methoxy group of the corresponding α-methyl glucoside (4 or 5) was cleaved off through a sequential silylation/reduction in the presence of BSTFA and Et3SiH/TMSOTf accordingly.26 The subsequent silylation of 6 or 7 allowed for selective protection of secondary hydroxyls (8 or 9) due to the selective recovery of the primary hydroxyl during compound purification on the silica gel. The primary hydroxyl was then oxidized using TPAP/NMO (10 or 11),27 and the resulting pyranose mimetic was conjugated with 7-amino-4-methylcoumarin through reductive amination.21 The mild acidic conditions of reductive amination also ensured the deprotection of all hydroxyls, yielding fluorescently labeled probes (P2 or P3). The presence of the fluorescent tracer on each of the synthesized probes allowed us to monitor and assess their uptake directly in live cells and engineered GLUT-expressing yeast systems.
Scheme 1. Synthetic Routes to P2 and P3a.

aReagents and conditions: (a) BSTFA, Ar, 80 °C, 5.5 h (step 1), Et3SiH, TMSOTf, Ar, rt, 16–21 h (step 2); (b) pyridine, TMSCl, rt, 14 h; (c) NMO, MgSO4, TPAP, CH2Cl2, rt, 1–2 h; and (d) 7-amino-4-methylcoumarin, NaBH3CN, MeOH, AcOH, pH < 6, rt, 20 h. See the Supporting Information for experimental details.
P1–P3 Exhibit Metabolism-Coupled Uptake.
The preliminary assessments focused on establishing the ability of an individual probe to pass into live cells. Probe uptake was evaluated in mammalian breast cancer MCF7 cells, known to express GLUT2, GLUT5, and GLUT12.14,28,29 For uptake studies, cells were treated with each probe using complete cell culture media solutions for 15 min at 37 °C, following the subsequent removal of probe-containing media and cell wash.21 Fluorescence was recorded using a confocal microscope and quantified using ImageJ. Relative fluorescence was derived as CTCF/area, where CTCF = integrated density − (area of selected cell × mean fluorescence of background readings). The acquired blue fluorescence (Figure 2A) was detected at concentrations as low as 25 μM. The overall fluorescence levels were highest for P3, followed by P2 and P1, suggesting differences in their uptake capacities. Altering probe concentrations revealed the concentration-dependence of the uptake that leveled around ~200 μM concentration (Figure 2B). The Km values for the probes’ uptake were ~43, 47, and 51 μM, respectively (Figure S2).
Figure 2.
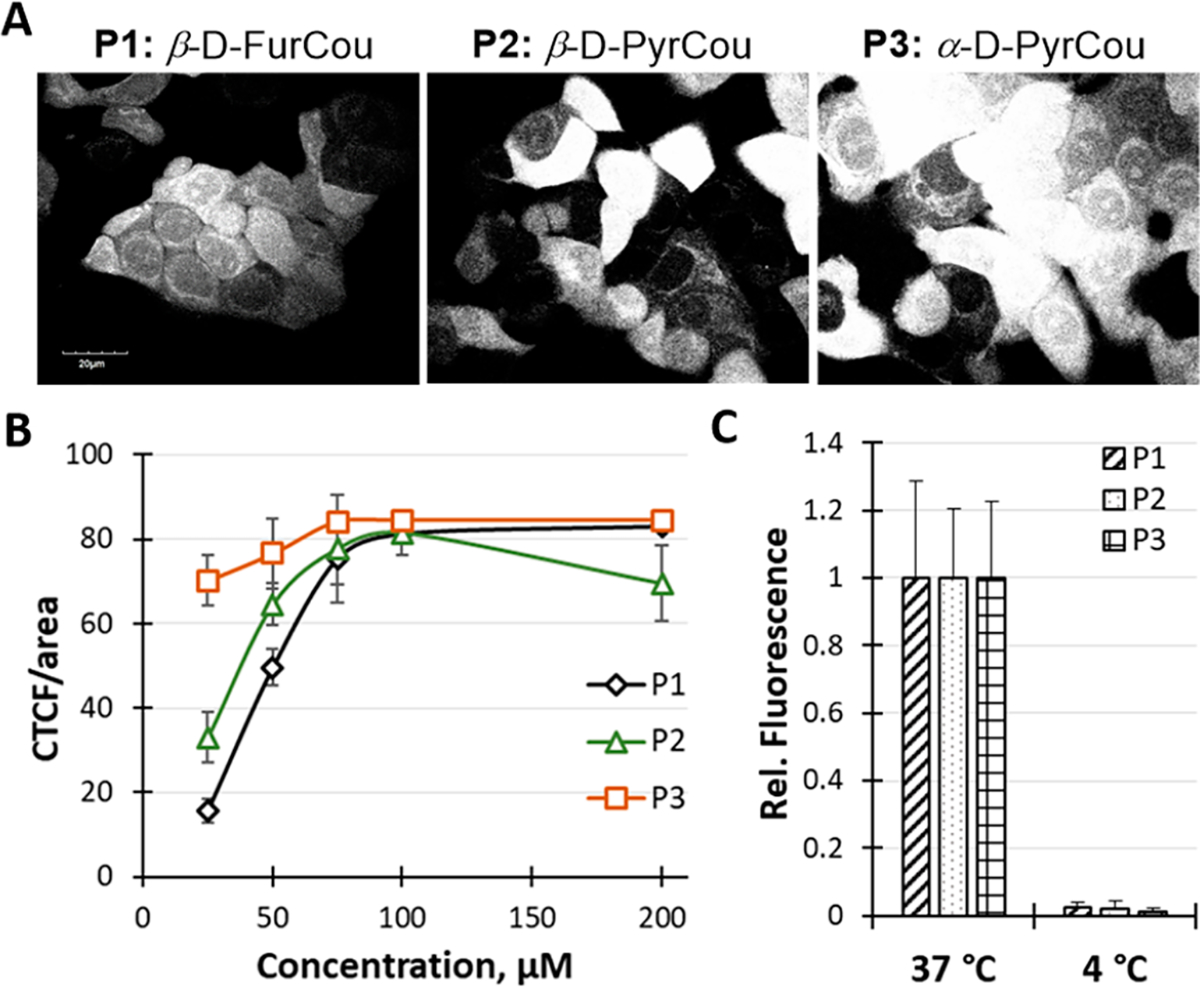
Analysis of probe uptake efficiency and GLUT involvement in MCF7 cells. (A) Confocal fluorescence images of MCF7 cells treated with P1–P3 for 15 min (P1, 50 μM; P2 and P3, 25 μM). Images acquired using 60× objective and DAPI filter (exc. 405 nm/em. 461 nm) at the same laser intensity and exposure time. Images are presented in gray-scale for clarity. (B) Concentration-dependent uptake of P1–P3. CTCF was derived as probe-induced fluorescence corrected by the background and cell area (Figure S1). (C) Impact of the incubation temperature on the uptake of P1–P3. Relative fluorescence calculated as the ratio between the CTCF/area for P1–P3 with respect to the corresponding CTCF at 37 °C. CTCF values were derived from quantifying the fluorescence images of probe-treated cells (Figure S3). Quantitative fluorescence data were derived from fluorescence images of probe-treated cells using ImageJ. Graphical data represent an average fluorescence. Error bars represent deviations in fluorescence of 7–20 cells per data point from two independent experiments. The scale bar for all images is 20 μm.
The effective accumulation of P1–P3 in mammalian MCF7 cells after a short incubation and distinctive contribution from the differences in their binding affinities suggested a facilitative uptake and provided the basis for assessing the participation of GLUTs. The GLUT activity has been shown to loosely depend on phosphorylation, reflecting the dependence on cellular metabolism.30 To delineate the GLUT involvement in the uptake of P1–P3, we adjusted the incubation temperature to 4 °C to lower the cell’s metabolic activity.14,31 Hence, MCF7 cells were pre-incubated for 30 min at 4 °C and treated with probe solutions for 15 min at 4 °C. Fluorescence images obtained for this set of cells showed only basal levels of fluorescence (Figure S3). The abolished accumulation of probe-induced fluorescence at the low temperature (Figure 2C) highlighted the direct involvement of metabolically driven uptake by GLUTs. Moreover, the lack of probe uptake, even at prolonged incubation times (1 h), further excluded the contribution from passive diffusion to the probe uptake.
Single Substrate Uptake Reflects the Probe Preference of GLUT5 vs GLUT2.
We further focused on assessing the uptake paths for individual probes. Earlier reports have suggested that GLUT5 can transport d-fructose in both configurational forms.25 Likewise, the ability of GLUT2 to transport the fructofuranose mimetic 2,5-anhydro-d-mannitol has also been reported.32 In turn, stereochemical alterations of fructose hydroxyls impact the uptake by fructose GLUTs, highlighting the critical role of the special orientation of sugar hydroxyls in substrate recognition.33 The ability of these two transporters to perform as major fructose transporters in different tissues also suggested the possibility that each of these GLUTs may transport multiple forms of fructose. To experimentally demonstrate the uptake preferences of P1–P3, we used hxt0 yeast cells engineered to express a GLUT transporter of interest. The hxt0 is a hexose transporter deficient yeast system, where 21 genes responsible for hexose transporters were knocked out.34 As a result, the expression of any specific GLUT gives a single-GLUT environment, allowing for a direct assessment of transporter capabilities and substrate specificities directly. Thus, for the studies, the hexose transporter-deficient (hxt0) yeast cells expressing functional GLUT535 or GLUT2 were used.18 Sugar uptake in hxt0 yeast cells occurs only through the specifically expressed transporter. The GLUT5-expressing hxt0 yeast cells take up only fructose, while the GLUT2-expressing hxt0 yeast cells take up glucose and fructose. GLUT1-expressing yeast cells were used as a control representing the glucose-uptake active and fructose-uptake inactive system.
For analyses with single-GLUT hxt0 yeast cell-based expression systems, each probe was examined separately. By monitoring probe fluorescence amassed in whole hxt0 yeast cells, P1 (0.1 mM) was found to pass through GLUT5 in a time-dependent manner (Figures 3A and S4A), with accumulation continuing over 90 min. GLUT5 uptake of P1 was competitive with fructose, with high levels of fructose (100 mM) diminishing the overall levels of probe accumulation but not hindering the continuity of the uptake. The lack of probe accumulation in yeast cells expressing glucose transporter GLUT1 (Figure 3B) highlighted the importance of GLUT5 in the uptake of P1 and excluded the GLUT-independent passage of the probe through the cellular membrane.
Figure 3.

Uptake of P1–P3 in GLUT5- or GLUT2-expressing hxt0 yeast cells. (A) Time-dependent uptake of P1 (0.1 mM) by GLUT5 in the presence (squares) or absence (circles) of 100 mM fructose. The uptake represented the fluorescence accumulated into whole cells for the specified time intervals. (B) Probe (0.1 mM) uptake after 20 min of incubation in GLUT5-expressing cells (black and gray bars) in the presence or absence of 100 mM fructose, or in GLUT1-expressing cells (white bars), the presence or absence of 100 mM glucose. (C) Probe (1 mM) uptake after 20 min of incubation in GLUT2-expressing cells in the presence or absence of 100 μM phloretin. (D) Effect of P1–P3 (0.1 or 1 mM) on the uptake of 14C-fructose (10 mM) through GLUT5 (black) and 14C-glucose (15 mM) through GLUT2 (white). Hexose concentrations were used at the levels corresponding to respective Km values (i.e., 10 mM fructose for GLUT5 and 15 mM glucose for GLUT2). Fluorescent probe uptake (A–C) and effect on relative transport activity (D) were determined in EBY.VW4000 yeast cells expressing GLUT5S72Y or EBY.S7 yeast cells expressing GLUT2ΔloopS_Q455R. EBY.S7 cells expressing GLUT1 were used as a control for P1 uptake (B). Unless specified, probe concentration was 0.1 mM for GLUT5-expressing cells (A,B) and 1 mM for GLUT2-expressing cells (C). More details are in Materials and Methods. Fluorescence data are in Figures S4 and S6. Error bars represent standard deviations from three measurements. A two-tailed t-test was used to detect statistically significant differences: *p ~ 0.001, **p < 0.0001.
The continuity of the uptake observed for P1 resembled that of fructose,28 suggesting the metabolic trapping of this probe inside the cell. To assess the feasibility of metabolic trapping for P1, we measured the probe efflux from the probe-treated MCF7 cells. For comparison, we used P2 and P3 as a probe showing saturable uptake. To measure probe efflux, we monitored fluorescence amassed in the fresh dye-free culture medium supplemented to MCF7 cells post-treatment with probes (Figure S5). Over 20 min, we observed no significant difference in fluorescence of the culture media collected from MCF7 cells treated with P1. In contrast, a strong increase in media fluorescence was measured for P2 and P3, reflecting the leaching of the probes. The differences between P1 and P2–P3 efflux suggest the former is trapped inside the cell, reflecting the metabolic involvement in probe uptake. With 2,5-anhydro-d-mannitol being a substrate for metabolic kinases,36,37 it is plausible that due to the symmetry, the sugar provides a primary hydroxyl amenable to phosphorylation even after conjugation to the coumarin. The evident efflux measured for P2–P3 under the same conditions further highlighted the differences in the metabolic fate between the probes.
In contrast to P1, the accumulation of P2 was ~5-fold lower (Figure 3B) and showed a saturable uptake profile (Figure S4C). Moreover, the α-d-fructopyranose mimetic P3 was not taken up through GLUT5, reflecting discrimination against the α-anomer of fructose. The uptake of P1 and P2 was inhibited by fructose, and inhibition remained active over 90 min (Figure S4B,D), reflecting competition between the two substrates. The overall levels of probe uptake after 20 min were ~4-fold and 2-fold higher for P1 and P2, respectively, compared to their uptake in the presence of 100 mM fructose (Figure 3B).
The GLUT2-expressing hxt0 yeast system demonstrated the ability of this non-specific transporter to translocate all three probes (Figures 3C and S6). However, the uptake of probes through GLUT2 was significantly less efficient. In fact, while P1 uptake through GLUT5 was observed using a 0.1 mM probe solution, GLUT2 required an increase in probe concentration to 1 mM. The lesser efficacy of probe uptake measured for GLUT2 agrees with ~8-fold lower affinity of GLUT2 to fructose than GLUT5 (76 mM vs 11 mM, respectively18,35). At the 1 mM probe concentration, the highest uptake through GLUT2 was observed for P1, followed by P2, and P3, giving the respective uptake ratio of 5:1.9:1. Similarly to GLUT5, the uptake of P1 through GLUT2 was time-dependent (Figure S6), reflecting metabolic trapping of the probe, while the uptake of P2 and P3 was saturable. Blocking GLUT2 transport with phloretin (IC50 < 4 μM38) inhibited the uptake of all probes validating the GLUT2-mediated uptake (Figure 3C).
Thus far, the probe uptake through the individual GLUT isoforms showed that GLUT5 and GLUT2 uptake P1 with the highest efficacy. The uptake of P2 can proceed through both transporters, and the uptake of P3 was detected only for GLUT2. To better understand the basis for discrimination between probes, we have assessed the strength of probe–transporter interactions by evaluating P1–P3 as inhibitors of sugar uptake (Figure 3D). Transport activity was monitored with C14-labeled substrates at hexose concentration matching the corresponding Km (i.e., 10 mM fructose for GLUT5 and 15 mM for glucose); fructose (Km ~ 11 mM35) was GLUT5 substrate, and glucose (Km ~ 15 mM38) was used as a substrate for GLUT2.
For GLUT5, a 25–30% drop in fructose uptake was measured with P1 and P2 (0.1 mM). Increasing the probe concentration to 1 mM resulted in a 55–60% inhibition of fructose uptake through GLUT5. Notably, the equivalent inhibition of fructose uptake through GLUT5 was also observed in the presence of P3 despite the lack of its uptake in GLUT5-expressing yeast cells. Relatively similar levels of fructose uptake inhibition reflected a similarity in the binding efficiency of P1–P3 to GLUT5. The inhibitory effect from P1–P3 was also observed for the uptake of 14C-labeled D-glucose through GLUT2. As with GLUT5, P1–P3 showed similar inhibitory potency, suggesting no significant differences in the binding affinities for probes to GLUT2. The inhibitory effects averaged to ~50% with 1 mM probe but were not detected with 0.1 mM probe concentrations, probably due to the lower affinities of P1–P3 for GLUT2.
Overall, the probes appear to have similar binding affinities for the individual transporter, as reflected by the same levels of inhibition exerted on sugar uptake (Figure 3D). Yet, the uptake efficiency of probes differs significantly (Figure 3B,C), indicating differences in the interactions of P1–P3 with uptake-relevant residues.
Differences in P1–P3 Interaction with GLUTs 2 and 5 Relate to the Probe Uptake Behavior.
The differences in uptake efficiencies of P1–P3 through GLUTs 5 and 2 versus similarities in their binding efficiencies suggest the probes’ uptake relies on interactions beyond transporter binding. Furthermore, the observed discrimination of P3 uptake despite the effective binding to GLUT5 suggested the presence of transport-inhibiting interactions. In contrast, the passage of all probes through GLUT2 reflected a less discriminatory environment of this transporter. To explore the structural basis driving the discrimination in probe uptake, we performed molecular docking analysis using the human outward GLUT5 model (GLUT5out) and human outward GLUT2 model (GLUT2out). Human GLUT5out was modeled based on the available crystal structure (PDB:4YBQ).39 Human GLUT2out was modeled using an outward GLUT3 crystal structure (PDB:4ZWC).40 Energy minimization of the analyzed proteins were performed using YASAR online server.41 The structures of P1–P3 ligands and fructose tautomers were drawn in ChemDraw 20.1.1. The energies of all ligands were minimized in Avogadro.42,43 Gasteiger charges were added to ligand/protein structures. AutoDockTools (ADT) version 1.5.644,45 was used to add Gasteiger charges and polar hydrogens and prepare the ligand and protein for further docking in AutoDockVina.46 Docking in AutoDockVina was performed with default parameters using pdbqt files of protein and ligand as input. The visualization of docked complexes was carried out in DS Visualizer.
The molecular docking with GLUT5out positioned the coumarin residues toward the GLUT5out exit vestibule and the sugar moieties within the sugar-binding site (Figure 4A). All three probes showed similar binding affinities to GLUT5 (8.0–8.5 kcal/mol, Figure S7), suggesting a lack of discrimination between P1 and P3 based on their binding. The results correlate with the equal inhibitory effects that these probes exert on fructose uptake through GLUT5 (Figure 3D).
Figure 4.

Different orientations of docked P1, P2, and P3 in the fructose binding site of human outward GLUT5 (A) and GLUT2 (B) models. GLUT5 model is based on rat outward GLUT5, PDB: 4YBQ; GLUT2 model is based on human outward GLUT3, PDB: 4ZWC. Probes are visualized via ball and stick model, protein residues are visualized via stick model. Carbons of P1, P2, and P3 are colored orange, green, and cyan, respectively. Carbons of protein residues are gray. Other atoms’ color: O—red; H—white; and N—deep blue. Visualization was carried out in Discovery Studio Visualizer.
While binding correlates with the inhibitory efficiencies of P1–P3, it does not address the discrimination between probes by GLUT5 for the uptake (Figure 3B). For this part, we analyzed the differences in the probe orientation within GLUT5 (Figure 4) and interactions that could promote or diminish the uptake (Figure S7). For P1, the interaction with GLUT5 was found to involve H-bonding residues important for substrate recognition and uptake: Tyr32, His419, Gln167, Ser392, and Ser143 (Figure S7A).39,47 For P2, the pyranose conformation induced disfavored interaction with Ser392 and Ala396 (GLUT5-specific uptake-relevant residue39) that could limit the probe uptake capacity. In addition, the modeling reflected that the change in the orientation of coumarin of P2 results in the interaction with Asn294 (Figure S7B). The interaction with Asn294 has been previously identified to induce transport inhibition11,48 and may contribute to the lesser uptake efficacy measured for P2 through GLUT5. The docking analysis of P3 reflected the change in sugar position within the substrate-binding site. While interactions with both uptake-promoting and uptake-limiting residues were identified (Figure S7C), the altered position in the binding site could be the major factor precluding the uptake of P3 through GLUT5.
The docking analysis of P1–P3 within the human GLUT2out showed the probes to be more uniformly positioned (Figure 4B). P1 and P2 were found to sustain H-bonding interactions with Gln314 and Asn443 through the sugar moiety and Asn447 through the coumarin (Figure S8A,B). A larger network of secondary interactions with aromatic and hydrophobic residues identified for P2 appears to contribute to this probe’s relatively stronger calculated affinity than P1. While the information on transport-relevant residues for GLUT2 is limited, similarly to GLUT5, stabilization of binding with the protein could lessen the uptake efficiency measured for P2 through GLUT2 (Figure 3C). Destabilization of transport-relevant binding interactions could also be contributing to the lesser uptake efficiency of P3 (Figure S8C). Furthermore, the disfavored interaction with the transport-relevant Asn443 (and Trp420) may contribute to the lesser efficacy of P3 uptake compared to P2.
Fructopyranose Uptake Is Distributed between Non-Specific GLUTs.
Thus far, the analysis of probes in the yeast cell-based GLUT5 and GLUT2 systems (Figure 3) showed the ability of all three probes to bind to either transporter. The uptake of the probes, however, was more discriminating. Namely, both transporters preferred P1, and GLUT5 discriminated against P3. Moreover, GLUT5 showed higher efficacy in P1 and P2 uptake over GLUT2. To identify the transporter preferences in a multi-GLUT environment of a mammalian cell, we measured the uptake of probes in MCF7 cells in the presence of native GLUT substrates and inhibitors. Prior to the studies, MCF7 cells were verified to express major fructose transporters GLUTs 2, 5, and 12 through immunofluorescence analysis (Figure S9) in agreement with prior reports.29
MCF7 cells were incubated with probe solutions containing fructose or glucose to delineate the role of fructose versus glucose GLUTs in the uptake of P1–P3. The resulting data suggested the probes pass into MCF7 cells through different paths (Figure S10). Specifically, fructose inhibited the uptake of all three probes, reflecting the participation of fructose-transporting GLUTs in the uptake of all P1–P3. The inhibitory effects differed between probes, with the most prominent impact measured for P1 (~70% inhibition). In contrast, inhibition by glucose impacted predominately P2 (~70%). P1 uptake was not affected by glucose, and inhibition of P3 uptake was ~20%. Considering that except GLUT5, all other GLUTs transport glucose, the difference in responses to fructose versus glucose indicated that P1 is taken up through fructose-specific transport, implicating the preferential involvement of GLUT5 in the uptake of fructofuranose. In contrast, P2 and P3 appear to be taken up by non-specific fructose GLUTs. Moreover, the measured differences in inhibitory response to glucose suggest different uptake pathways for P2 and P3 in MCF7 cells.
Furthermore, the uptake of probes was evaluated in the presence of GLUT inhibitors. For GLUT5 inhibition, we used a high-affinity GLUT5-specific ligand MSNBA (IC50(fructose) ~ 5.8 μM in MCF7 cells).11 To assess the involvement of non-specific GLUTs, we used cytochalasin B (CytB) known to inhibit non-specific glucose GLUTs 1–4, 6, 10, and 12.49,50 To distinguish the involvement of GLUT2, we used a GLUT2-specific ligand G2iA (IC50(glucose) ~ 0.6 μM in GLUT2 yeast system18) and a high-affinity GLUT2 substrate glucosamine (GluAm, Km ~ 0.8 mM51). To delineate glucose transport, we used fasentin as a GLUT1 and GLUT4 inhibitor in mammalian cells (IC50(glucose) ~ 68 μM).52 For the competitive uptake experiment, MCF7 cells were treated with the combination of a probe with each inhibitor using corresponding complete culture media solutions. All probes were used at 25 μM concentration. All inhibitors and competitive substrates were used at concentrations surpassing their Km or IC50 values: P1–P3, MSNBA, G2iA, and CytB were used at 25 μM concentration, GluAm at 100 mM concentration, and fasentin at 300 μM concentration. The probe uptake without the inhibitor was used as a control. The probe uptake was recorded using a confocal microscope (Figure S11), and the corresponding fluorescence images were quantified using ImageJ.
As a result of inhibition studies (Figure 5), we observed significant differences in P1–P3 uptake depending on the inhibitor present. For P1, we observed a ~90% inhibition of uptake by MSNBA, indicating GLUT5-mediated uptake. The insignificant inhibitory effects from CytB or GluAm specified the limited (if any) involvement of GLUT2 and other non-specific GLUTs in the uptake of P1. Data correlate with the lack of inhibitory impact on P1 uptake from glucose (Figure S10D,F). Thus, despite the ability of GLUT2 to pass P1 (Figure 3B) in the multi-GLUT environment of mammalian cells, the furanose conjugate appears to be taken up preferentially through the higher affinity GLUT5, in agreement with prior reports.20,21
Figure 5.

Changes for P1–P3 uptake in MCF7 cells in the presence of inhibitors: MSNBA, CytB, GluAm, G2iA, and fasentin. Cell fluorescence was recorded using confocal microscopy. Fluorescence images (Figure S11) for every condition (DAPI, 60× objective, same laser intensity and exposure time) were quantified using ImageJ. Graphical data represents an average fluorescence of 7–20 cells from two repeats. Relative fluorescence for every probe in every condition was derived by normalizing the derived CTCF/area value for probe + inhibitor combination by the CTCF/area of the corresponding control (P1, P2, or P3). Error bars represent relative standard deviation between two independent experiments. A two-tailed t-test was used to detect statistically significant differences: *p ~ 0.01–0.001, **p ~ 0.001–0.0001.
For P3, the uptake inhibition in MCF7 cells was only observed in the presence of CytB (Figure 5). No inhibition was detected for P3 in the presence of MSNBA or fasentin, allowing to exclude GLUT5 and non-specific glucose GLUTs from consideration. The lack of uptake inhibition for P3 by MSNBA agreed with the lack of GLUT5-mediated uptake for this probe measured using the yeast cell-based GLUT5 expression system. Overall, the inhibitory outcomes delineated non-specific fructose GLUTs as transporters for P3. Further analysis focused on assessing GLUT2 involvement. Here, despite the ability of P3 to pass through GLUT2 in the yeast cell-based GLUT2 expression system (Figure 3D), G2iA or GluAm had no impact on P3 uptake in MCF7 cells. The data allowed to exclude GLUT2 from consideration and suggested an alternative metabolically coupled uptake path for this α-d-fructopyranose mimetic. As from non-specific fructose GLUTs, MCF7 cells express only GLUTs 2 and 12,29 and both transporters were reported to be inhibited by CytB,49,51,53 it is probable that the uptake of P3 proceeds preferentially through GLUT12. The suggested high capacity of GLUT12 for fructose54 could also contribute to high efficacy in the accumulation of P3 measured in MCF7 cells. Further studies are in progress to validate GLUT12’s preference for P3.
The inhibitor impact on P2 accumulation in MCF7 cells reflected an intriguing interplay between GLUT2 and GLUT5 in the uptake of this probe. Comparably to P3, we observed the uptake of P2 to be strongly inhibited by CytB and not inhibited by fasentin—a combination reflecting the involvement of non-specific fructose GLUTs. However, when GLUT2-specific inhibitor G2iA was used, we observed an unexpected enhancement of the probe uptake (Figure 5). Uptake enhancement was also measured upon GLUT5 inhibition by MSNBA. The change in P2 uptake in response to a high-affinity GLUT2 substrate GluAm was subtle, plausibly due to the ability of GluAm to pass through other GLUTs.49 The comparative analysis of responses to GLUT inhibitors shows the increased uptake only for P2. Considering the ability of P2 to pass through both GLUT5 and GLUT2 in yeast cell-based GLUT expression models, it is feasible that P2 alters its uptake paths between the two transporters depending on their accessibility. Namely, P2 passes through GLUT2 when GLUT5 is occupied (conditions with MSNBA) or through GLUT5 when GLUT2 is occupied (conditions with G2iA). On these bases, the uptake behavior of P2 appears to reflect the uptake of β-d-fructopyranose in mammalian cells, especially considering the reported lack of uptake inhibition by MSNBA observed for the C6-fluorinated analogue of fructose.55
Comparative Analysis of P1–P3 Uptake Allows for Dissecting Fructose GLUT Activities.
Based on the ability of P2 to pass through both GLUT5 and GLUT2, we hypothesized that when the more favored d-fructofuranose occupies GLUT5, the delivery of β-d-fructopyranose (here P2) through GLUT2 and the subsequent characterization of GLUT2 activity could be feasible. To test this hypothesis, we evaluated the uptake of P1 and P2 as a mixture with the expectation that GLUT5 will be occupied by the preferred P1, and the uptake of P2 will be directed through GLUT2.
To enable the independent analysis of P2 fluorescence within the representative furanose/pyranose mixture, we substituted the blue-fluorescent P1 with NBDM—a green fluorescent conjugate of 2,5-anhydro-d-mannitol that shows specificity for GLUT5 and exhibits uptake efficiency similar to P2 (Km ~ 22 μM) in MCF7 cells.20 The differences in fluorescence excitation and emission between P2 and NBDM (488exc nm/525em, eGFP) allowed for direct evaluation of uptake efficiencies for each probe in the mixture (Figure S12). Consequently, MCF7 cells were treated with P2 + NBDM and P3 + NBDM (Figure 6, P + NBDM). To compare the uptake efficiency of probes carrying different fluorophores, the CTCF values derived from fluorescent images were corrected by quantum yields of Cou-CH3 (P2 and P3)21 and NBD56 fluorophores0.3 and 0.16, respectively. All probes were used at 25 μM concentration. The uptake of an individual P2, P3, or NBDM was used as a control. Considering that GLUT5 is a high-affinity fructose transporter, we expect the control NBDM and P1 uptake to represent the GLUT5 activity and P3 to reflect the uptake independent of GLUT5 or GLUT2.
Figure 6.

Uptake of P + NBDM mixture in MCF7 cells correlates with GLUT5 and GLUT2 activity. (A) Uptake distribution for NBDM and P2. (B) Uptake distribution for NBDM and P3. Fluorescence is expressed as CTCF per cell area. Data derived from confocal microscopy images of MCF7 cells treated with probes and probe mixtures (Figure S12). Fluorescence quantification was done for 7–15 cells per experiment using ImageJ. Fluorescence values corrected by quantum yields of the respective probe (P2, P3, or NBDM). Experiments carried in duplicates. Error bars represent standard deviation. Normality test in Figure S11B. (C) Levels of GLUT5 and GLUT2 expression in MCF7 cells; (D) alterations in NBDM and P2 uptake as a measure for GLUT2 activity. A two-tailed t-test was used to detect statistically significant differences: *p ~ 0.03–0.01, **p < 0.0001.
When the P + NBDM mixture was introduced to MCF7 cells, the uptake changed significantly for NBDM (as a stand-in for P1) and P2 but not P3 (Figure 6). For P2 + NBDM (Figure 6A), a significant change in uptake levels of both probes was observed. Notably, the NBDM uptake was reduced by ~30%, suggesting the competition from P2 for GLUT5. Remarkably, the uptake of P2 in the presence of NBDM increased by ~28%. The NBDM-induced uptake enhancement for P2, analogous to that observed in the presence of MSNBA (Figure 5), further suggested the involvement of a high-capacity transport for β-d-fructopyranose. In turn, the lack of competition between NBDM and P3 (Figure 6B) supported independent pathways for these two probes, as suggested by the yeast-based GLUT models and inhibition studies.
To confirm the involvement of GLUT2 in the uptake of P2 from the P2 + NBDM mixture, we used GluAm as a competitive substrate (P + NBDM + GluAm, Figure 6). In contrast to the subtle impact on P2 in a single probe setting (Figure 5), GluAm induced >50% inhibition in P2 uptake when NBDM was present (Figure 6A). It is notable that along with the P2 uptake inhibition, we also measured ~30% inhibition for NBDM uptake. Considering the competition between the two probes for GLUT5, inhibition in NBDM uptake would be expected as the amount of P2 amasses upon GluAm-induced inhibition of GLUT2. Noting that, to date, among fructose transporters, only GLUT2 was found to pass GluAm,49,51 the evident inhibition of P2 uptake by GluAm indicated a direct involvement of GLUT2 in the uptake of this β-d-pyranose mimetics from the P2 + NBDM mixture. The evident loss in P2 uptake upon hindering both GLUT5 and GLUT2 with competitive substrates, as well as an evident competition of the amassed P2 for GLUT5, provides further support for GLUTs 2 and 5 as predominant passage paths for β-d-fructopyranose.
As expected, the uptake of the P3 + NBDM mixture was not impacted by GluAm (Figure 6B). The results validated the lack of GLUT2 involvement and the existence of the alternative uptake path (plausibly GLUT12) for the α-d-fructopyranose.
Considering the apparent involvement of GLUT2 in the uptake of P2 and distribution of P2 uptake between GLUT5 and GLUT2 in the presence of a GLUT5-specific substrate, the comparative analysis of the individual probe uptake (Ctrl.) versus the NBDM + P2 mixture can be applied to characterize GLUT2 activity in cells. Immunofluorescence analysis of GLUT5 and GLUT2 expression in MCF7 cells using respective specific antibodies (Figure S9) reflected the 4:1 ratio between GLUT5 and GLUT2 (Figure 6C), agreeing with prior reports.57 The measured change in the P2 uptake for NBDM + P2 mixture (Figure 6D) appears to closely reflect the difference between GLUT5 and GLUT2 levels. Validation of GLUT5/GLUT2 expression ratios using furanose and pyranose mimetics in different cell types is underway.
CONCLUSIONS
In conclusion, with the novel fluorescently labeled mimetics of fructose isomers, we experimentally demonstrated that bulking the C6-position of fructofuranose and fructopyranose conformers locks the orientation of sugar within the binding site of a GLUT transporter leading to discrimination in the uptake between conformers and constitutional isomers. We showed that in mammalian cells, while fructofuranose retains GLUT5-specific uptake regardless of other fructose GLUTs, the β-d-pyranose can alter the uptake path between GLUT5 and GLUT2 depending on the availability of the transporter. We also established that, despite the ability of GLUT2 to recognize β-d-pyranose and α-d-pyranose isomers of fructose, the uptake of the α-d-fructopyranose in the multi-GLUT environment of a mammalian cell is independent of GLUT2 and proceeds through the alternative GLUT pathway. By exclusion, this alternative pathway in MCF7 cells appears to be GLUT12. By inducing the distribution of fructose mimetics between different GLUTs, we demonstrated the feasibility of assessing relative activities of non-specific fructose GLUTs through multi-color fluorescence analysis. Using the comparative analysis of the uptake of the green-fluorescent β-d-fructofuranose and blue-fluorescent β-d-fructofuranose versus their mixture, we demonstrate the first-time analysis of GLUT2 activity in live cells. While we presented the simultaneous analysis of GLUT activity with two probes, the reported diversity of coumarin fluorescence colors allows the probe combination to include the P3 for the subsequent three-component analysis. Overall, considering the important role that GLUTs play in health and disease, the molecular probes described herein provide essential tools for monitoring alterations in GLUT activity in live cells in biochemical and biomedical applications. The structure uptake relationships derived in this work provide the basis for further development of GLUT2- and, plausibly, GLUT12-specific substrates as activity reporters.
METHODS
Materials and Methods.
All reagents were used as received unless otherwise stated from Sigma-Aldrich, TCI America, Alfa Aesar, Ark Pharm, or Chem-Impex International. L-Gulose was obtained from TCI America, and 7-amino-4-methylcoumarin from Sigma-Aldrich. Analytical TLC was carried out on commercial SiliCycle SiliaPlate 0.2 mm F254 plates. Preparative silica chromatography was performed using SiliCycle SiliaFlash F60 40–63 μm (230–400 mesh). Final purification of compounds was achieved with an Agilent-1200 HPLC (high-pressure liquid chromatography) system using a reversed-phase semi-preparative column (Phenomenex Luna 10 μm C18(2) 100 Å, LC column 100 × 10 mm, Ea). 1H and 13C NMR spectra were recorded at room temperature with a Varian Unity Inova 400 MHz spectrometer. CD3OD, acetone-d6, and D2O were used as solvents and referenced to the corresponding residual solvent peaks (3.31 and 49.0 ppm for CD3OD, respectively; 2.05 and 29.84 ppm for acetone-d6, respectively; and 4.79 ppm for D2O). The following abbreviations are used to indicate the multiplicity: s—singlet; d—doublet; t—triplet; q—quartet; m—multiplet; b—broad signal; and app—approximate. The coupling constants are expressed in Hertz (Hz). The multiplicity of carbon atoms was determined by DEPT-135 experiment. The high-resolution (HR) MS data (ESI) were obtained using a Thermo Fisher Orbitrap Elite Hybrid Ion Trap-Orbitrap Mass Spectrometer at Chemical Advanced Resolution Methods (ChARM) Laboratory at Michigan Technological University. Cytochalasin B (CytB), MSNBA, glucosamine (GluAm), and fasentin were purchased from Sigma-Aldrich, MolPort, Chem-Impex International, and MedChemExpress, respectively. G2iA was kindly provided by Dr. Choe. Confocal images were taken with an Olympus FluoView FV1000 using the FluoView software. RPMI-1640, penicillin/streptomycin, FBS (fetal bovine serum), and 0.25% trypsin–EDTA (1×) were purchased from Life Technologies, USA. Sterile DMSO (25–950-CQC, 250 mL) was purchased from Sigma-Aldrich. 10 cm cell culture dishes treated for increased cell attachment and poly-d-lysine-coated 35 mm confocal plates were purchased from VWR and MatTek, respectively. MCF7 cells were obtained from ATCC, USA, and cultured according to the suggested growth methods. Hexose transporter-deficient yeast strains, EBY.VW400058 and EBY.S7 (https://doi.org/10.1159/000071863), and the plasmids for functional expression of GLUT1, GLUT2, and GLUT5 were from the laboratories of Drs. Eckhard Boles and Oreb Mislav at Goethe University Frankfurt, Germany.
Ligand Uptake Studies in GLUT-Expressing hxt0 Yeast Cells.
Culturing of GLUT-expressing hxt0 yeast cells: Yeast cell growth was done at 30 °C with shaking (180–220 rpm). The plasmids with the functional constructs of GLUT1 (p426H7_GLUT1),18 GLUT2 (pRS62K _ GLUT2ΔloopS_Q455R), 18 and GLUT5 (pRS72K_GLUT5S72Y)35 were transformed in the corresponding hxt0 yeast strains (EBY.S7 for GLUT1 and GLUT2ΔloopS_Q455R, and EBY.VW4000 for GLUT5S72Y) and grown on 2% (w/v) agar plates of the respective media supplemented with 1% (w/v) maltose. The main media was YEP [1% (w/v) yeast extract and 2% (w/v) peptone] supplemented with 100 μg/mL geneticin (G418) for GLUT2 and GLUT5 or complete synthetic media without uracil (SC-uracil) for GLUT1. An initial culture of ~10 mL was started with a few colonies and grown for 1 day (GLUT2 and GLUT5) or 2 days (for GLUT1). Cells were washed once in the corresponding media in which maltose was substituted with the corresponding hexose substrate for the expressing GLUT [2% (w/v) glucose for GLUT1, 0.2% (w/v) glucose for GLUT2, and 2% (w/v) fructose for GLUT5]. Then, cells were transferred in the same media to OD600nm ~ 0.5 and grown further for 1–2 days.
Fluorescent Probe Uptake Measurement.
Each transport assay reaction had 100 μL of cell solution at a cell density corresponding to OD600nm of 50 in PBS buffer (10 mM Na2HPO4, 1.8 mM KH2PO4, 2.7 mM KCl, 137 mM NaCl, pH 7.4). The cells were incubated with P1, P2, or P3 probes dissolved in PBS, at concentrations of 0.1 mM for GLUT5-expressing cells or 1 mM for GLUT2-expressing cells, for different time intervals. The uptake was stopped with 2 mL of ice-cold Quench buffer (0.1 M KPi, 0.1 M LiCl, pH 5.5) followed by immediate filtering of the cell solution onto glassfiber filters (GE healthcare GP120) and three more washes (2 mL each time) of the filter with the Quench buffer. The filter was then transferred to a glass vial containing 3 mL of PBS buffer and mixed vigorously with a vortex to detach the cells from the filter. Then, 2 mL of the solubilized cells was transferred into a cuvette to determine their fluorescence level on Shimadzu (GLUT5) or Horiba (GLUT2) fluorometers. For competition experiments, the incubation was done in the presence of 100 μM fructose (for GLUT5) or 100 μM phloretin (for GLUT2).
Radioisotope Transport Assay.
14C-fructose or -glucose were from Moravek Inc (Brea, CA, USA). For transport activity assay, cells in the hexose media were centrifuged (1000 g, 5 min, room temperature), washed once with PBS buffer, and resuspended in the same buffer at an OD600nm ~ 10; each assay contained 100 μL of this cell solution. The transport activity assay was started by adding 10 mM fructose (for GLUT5) or 15 mM glucose (for GLUT2); the substrate stock solution was a combination of the 14C-labeled and unlabeled substrate totaling to 250 mM concentration for fructose and 375 mM concentration for glucose (i.e., 25×). Transport activity assay was stopped after 10 min by adding 3 mL of ice-chilled Quench buffer, followed by filtration through a glass fiber channel (GC50; Advantec, Tokyo, Japan) under vacuum and another wash with 3 mL of Quench buffer and filtration. The filtration membranes were transferred into scintillation vials, combined with 10 mL of Scintillation Solution (BioSafeII; Research Products International, Mount Prospect, IL, USA), and vortexed briefly. The radioactivity was determined with a scintillation counter (Tri-carb 2900TR, PerkinElmer, USA). When checking the effect of P1–P3 on the transport assay, the assay reactions contained the probes at 0.1 or 1 mM concentration. The inhibitors and high concentrations of fluorescent probes (as needed in experiments with 1 mM probes) were solubilized in DMSO so that the final DMSO concentration in the transport assay was under 1% (v/v). Thus, controls for determining the relative transport activity included 1% (v/v) DMSO, representing the normal GLUT activity (100%), and known inhibitors (200 μM phloretin for GLUT2, and 100 μM MSNBA for GLUT5), representing fully inhibited activity.
Ligand Uptake Studies in the Mammalian MCF7 Cell.
MCF7 cell culture and plate preparation: for all fluorescence analyses, the adenocarcinoma MCF7 cell line was cultured using RPMI-1640. Complete RPMI-1640 medium contained 10% fetal bovine serum (FBS) and 1% penicillin/streptomycin. Cells were cultivated in 10 cm cell culture dishes (VWR) at 37 °C in 5% CO2 and under 65% relative humidity. Cells were cultured from the initial passage, and passages 15–25 were used for all studies. MCF7 cells were collected at ~80% confluence of the 10 cm tissue culture plate using 0.25% trypsin–EDTA (2 mL). The trypsin fraction was diluted with culture media to 5 mL. Then, cells were palleted by centrifugation (1600 rpm, 5 min), reconstituted in the complete culture media (5 mL), and plated with a seeding density of 150,000 cells per 35 mm glass-bottom confocal dishes (MatTek). The total volume in the plate was brought to 2 mL with corresponding media when needed. After 12 h, the culture media was exchanged, and cells were allowed to grow for 48 h from the moment of cultivation.
Cell Imaging and Fluorescence Image Processing.
MCF7 cell images were taken with Olympus FluoView FV1000 using the FluoView software. 60× oil suspended lens were used to observe fluorescent activity with the following conditions: DAPI (ManCous) and eGFP (NBDM) filters; lasers 405 nm (35% intensity), 450/490 nm (35% intensity); 20 μs/pixel. Z-stacking was done with FluoView software and depth command. The obtained fluorescence images were quantified using ImageJ. Fluorescence was calculated as Corrected Total Cell Fluorescence (CTCF) (CTCF = integrated density − (area of selected cell × mean fluorescence of background readings).59 CTCF was normalized by the area of the selected cell (CTCF/area of the selected cell). This procedure was done for cells by selecting regions of interest in the single image. The finalized values represent an average fluorescence of 7–30 cells per image. At least two images per sample were processed.
Uptake Analysis.
Probe solutions (25, 50, 75, 100, 200, and 500 μM) were prepared in the complete cell culture media (2 mL) using 5 mM probe stock solutions in DMSO. DMSO concentration was kept below 10%. For treatment, cells seeded in glass-bottom confocal dishes were used. Cell media was removed, and a probe solution (2 mL) was added. Cells were incubated with P1–P3 at 37 °C for 15 min. After incubation, probe solution was removed, cells were washed with complete culture media (2× mL) to remove residual probe and replenished with 2 mL of complete culture media for imaging.
Temperature Studies.
To explore GLUT transporters involvement in the P1–P3 uptake and exclude passive diffusion through the membrane, the uptake of probes was evaluated at 4 °C. For this, MCF7 cells were seeded in confocal plates as described above. Prior to treatment with probes, confocal plates with the seeded cells were kept in a fridge at ~4 °C for 30 min. After that, the culture media was discarded and a cooled solution of a corresponding probe (25 μM) in the complete culture media was added. Cells were kept in the fridge at ~4 °C for 15 min to assess the involvement of GLUTs and for 1 h to assess the involvement of passive diffusion. After treatment, probe-containing media was removed, and cells were washed with the complete cell culture media (2 × 1 mL) and replenished with 2 mL of media for fluorescence imaging.
Efflux Analysis.
MCF7 cells were incubated in 2 mL of complete RPMI-1640 media supplemented with 25 μM probe (P1–P3) at 37 °C, 5% CO2 for 15 min. After incubation, media containing the probe was removed, and cells were washed with 2 × 1 mL of phenol red free RPMI-1640 media. Then, cell plates were replenished with phenol red free media and left for 5 and 20 min under the incubation conditions. After efflux time, media was transferred to the 15 mL tube, followed by centrifugation for 3 min at 3000 rpm to get rid of cell floaters and debris. The supernatant was transferred to a fresh tube and shielded from the light by foil. Samples were transferred into cuvettes, and fluorescence emission spectra were recorded in a FluoroMax-4 spectrophotometer using FluorEssence software with excitation at 385 nm and slit size of 5 nm. The background fluorescence of media was subtracted in each time test using FluorEssence.
Competitive Uptake Inhibition Analysis.
For uptake inhibition analysis, 5 mM CytB, MSNBA, and G2iA, and 10 mM fasentin stock solutions in DMSO as well as 200 mM GluAm in complete media were prepared. For treatment, each inhibitor solution was used to prepare inhibitor/probe mixture in the complete cell culture media (2 mL) that was introduced to cells seeded in glass-bottom confocal dishes after removal of the initial culture media. Cells were incubated at 37 °C for 15 min. After incubation, the probe + inhibitor solution was removed, and cells were washed with the complete culture media (2 × 1 mL) and replenished with 2 mL of media for fluorescence imaging. CytB and MSNBA were co-incubated with P1–P3 probes, GluAm, G2iA, and fasentin with P2–P3 probes. 25 μM P1–P3 treatment was used as a control.
Co-incubation with NBDM.
Stocks of 5 mM NBDM stock solution in DMSO as well as 200 mM glucosamine in RPMI-1640 were prepared. Equimolar Probe/NBDM (25 μM) or Probe/NBDM (25 μM)/glucosamine (100 mM) mixtures in media (2 mL) were introduced to cells seeded in glass-bottom confocal dishes after removal of the initial culture media and followed by incubation at 37 °C for 15 min. After incubation, probe solution was removed, and cells were washed with the complete cell culture media (2 × 1 mL) and replenished with 2 mL of media for fluorescence imaging. 25 μM P2 and P3, 25 μM NBDM treatments were used as a control.
GLUT2 and GLUT5 Immunofluorescence Analysis.
MCF7 cells were cultured in confocal plates using complete RPMI-1640. Then, cells were fixed using 4% PFA for 20 min and washed with PBS (3 × 2 mL) for a total of 15 min. Bovine serum albumin was used for overnight protein blocking of the fixed cells at 4 °C. After that, blocking solution was discarded and cells were incubated with appropriate primary antibody (GLUT2, Santa Cruz Biotechnology, sc-518022; GLUT5, Santa Cruz Biotechnology, sc-2710) at a dilution of 1:200. Cells were washed with PBS (2 × 2 mL) and incubated for 2 h with the secondary antibody conjugated to Alexa 488 (Invitrogen, Thermo Fisher Scientific, A32723) at a dilution of 1:1000. Antibodies were washed off. Immunostained cells were imaged using an Olympus FluoView FV1000 confocal microscope with 60× objective and Alexa488 filter.
Quantification, Statistical, and Kinetic Analyses.
The sample size of all image-derived data point was set as 7–30 cells. Quantified fluorescence reported as CTCF/cell area. Data are presented as ± standard deviation of the average fluorescence, calculated by Excel. Statistical significance calculated using 2-tail t-test and is indicated in figures using the following denotation: *p < 0.01–0.001, **p < 0.001–0.0001. Km values were derived using Quest Graph EC50 calculator and a four-parameter logistic regression model. Normality test was performed using GraphPad Prism 9.4.1.
Supplementary Material
ACKNOWLEDGMENTS
This research was supported by the NIH-R15-AREA (GRANT12736422) award to M. Tanasova and the NIH grant R01-GM123103 to J. Choe. Hexose transporter-deficient yeast strains and plasmids for GLUT2 and GLUT5 expression were kindly provided by E. Boles and M. Oreb (Johann Wolfgang Goethe-Universität Frankfurt am Main, Germany).
Footnotes
The authors declare no competing financial interest.
Complete contact information is available at: https://pubs.acs.org/10.1021/acschembio.2c00682
ASSOCIATED CONTENT
Supporting Information
The Supporting Information is available free of charge at https://pubs.acs.org/doi/10.1021/acschembio.2c00682.
Data figures and graphs, cell images, synthetic methods, and 1H and 13C NMR spectra for all new compounds (PDF)
Contributor Information
Nazar Gora, Department of Chemistry, Michigan Technological University, Houghton, Michigan 49931, United States; Health Research Institute, Michigan Technological University, Houghton, Michigan 49931, United States.
Lukasz J. Weselinski, Department of Chemistry, Michigan Technological University, Houghton, Michigan 49931, United States
Vagarshak V. Begoyan, Department of Chemistry, Michigan Technological University, Houghton, Michigan 49931, United States
Andrew Cooper, Department of Chemistry, Michigan Technological University, Houghton, Michigan 49931, United States.
Jun-yong Choe, Department of Chemistry, East Carolina Diabetes and Obesity Institute, East Carolina University, Greenville, North Carolina 27834, United States; Department of Biochemistry and Molecular Biology, The Chicago Medical School, Rosalind Franklin University of Medicine and Science, North Chicago, Illinois 60064, United States.
Marina Tanasova, Department of Chemistry, Michigan Technological University, Houghton, Michigan 49931, United States; Health Research Institute, Michigan Technological University, Houghton, Michigan 49931, United States.
REFERENCES
- (1).Long W; Cheeseman CI Structure of, and functional insight into the GLUT family of membrane transporters. Cell Health Cytoskeleton 2015, 7, 167–183. [Google Scholar]
- (2).Ancey PB; Contat C; Meylan E Glucose transporters in cancer - from tumor cells to the tumor microenvironment. FEBS J. 2018, 285, 2926–2943. [DOI] [PubMed] [Google Scholar]
- (3).Thorens B GLUT2, glucose sensing and glucose homeostasis. Diabetologia 2015, 58, 221–232. [DOI] [PubMed] [Google Scholar]
- (4).Kim YH; Jeong DC; Pak K; Han ME; Kim JY; Liangwen L; Kim HJ; Kim TW; Kim TH; Hyun DW; Oh SO SLC2A2 (GLUT2) as a novel prognostic factor for hepatocellular carcinoma. Oncotarget 2017, 8, 68381–68392. [DOI] [PMC free article] [PubMed] [Google Scholar]
- (5).Medina RA; Owen GI Glucose transporters: expression, regulation and cancer. Biol. Res. 2002, 35, 9–26. [DOI] [PubMed] [Google Scholar]
- (6).McQuade DT; Plutschack MB; Seeberger PH Passive fructose transporters in disease: a molecular overview of their structural specificity. Org. Biomol. Chem. 2013, 11, 4909–4920. [DOI] [PubMed] [Google Scholar]
- (7).Pujol-Gimenez J; de Heredia FP; Idoate MA; Airley R; Lostao MP; Evans AR Could GLUT12 be a Potential Therapeutic Target in Cancer Treatment? A Preliminary Report. J. Cancer 2015, 6, 139–143. [DOI] [PMC free article] [PubMed] [Google Scholar]
- (8).Nakagawa T; Lanaspa MA; Millan IS; Fini M; Rivard CJ; Sanchez-Lozada LG; Andres-Hernando A; Tolan DR; Johnson RJ Fructose contributes to the Warburg effect for cancer growth. Cancer Metabol. 2020, 8, 16. [DOI] [PMC free article] [PubMed] [Google Scholar]
- (9).Koepsell H Glucose transporters in brain in health and disease. Eur. J. Phys. 2020, 472, 1299–1343. [DOI] [PMC free article] [PubMed] [Google Scholar]
- (10).Yang J; Dowden J; Tatibouët A; Hatanaka Y; Holman GD Development of high-affinity ligands and photoaffinity labels for the D-fructose transporter GLUT5. Biochem. J. 2002, 367, 533–539. [DOI] [PMC free article] [PubMed] [Google Scholar]
- (11).George Thompson MA; Ursu O; Babkin P; Iancu CV; Whang A; Oprea TI; Choe J-Y Discovery of a specific inhibitor of human GLUT5 by virtual screening and in vitro transport evaluation. Sci. Rep. 2016, 6, 24240. [DOI] [PMC free article] [PubMed] [Google Scholar]
- (12).Sweet IR; Matschinsky FM Are there kinetic advantages of GLUT2 in pancreatic glucose sensing? Diabetologia 1997, 40, 112–119. [DOI] [PubMed] [Google Scholar]
- (13).Mueckler M; Thorens B The SLC2 (GLUT) family of membrane transporters. Mol. Aspects Med. 2013, 34, 121–138. [DOI] [PMC free article] [PubMed] [Google Scholar]
- (14).Levi J; Cheng Z; Gheysens O; Patel M; Chan CT; Wang YB; Namavari M; Gambhir SS Fluorescent fructose derivatives for imaging breast cancer cells. Bioconjugate Chem. 2007, 18, 628–634. [DOI] [PMC free article] [PubMed] [Google Scholar]
- (15).Weng Y; Fan X; Bai Y; Wang S; Huang H; Yang H; Zhu J; Zhang F SLC2A5 promotes lung adenocarcinoma cell growth and metastasis by enhancing fructose utilization. Cell Death Discovery 2018, 4, 38–49. [DOI] [PMC free article] [PubMed] [Google Scholar]
- (16).Semchyshyn HM Fructation in vivo: detrimental and protective effects of fructose. BioMed Res. Int. 2013, 2013, 343914. [DOI] [PMC free article] [PubMed] [Google Scholar]
- (17).Frenzel J; Richter J; Eschrich K Fructose inhibits apoptosis induced by reoxygenation in rat hepatocytes by decreasing reactive oxygen species via stabilization of the glutathione pool. Biochim. Biophys. Acta 2002, 1542, 82–94. [DOI] [PubMed] [Google Scholar]
- (18).Schmidl S; Ursu O; Iancu CV; Oreb M; Oprea TI; Choe JY Identification of new GLUT2-selective inhibitors through in silico ligand screening and validation in eukaryotic expression systems. Sci. Rep. 2021, 11, 13751. [DOI] [PMC free article] [PubMed] [Google Scholar]
- (19).Iancu CV; Bocci G; Ishtikhar M; Khamrai M; Oreb M; Oprea TI; Choe JY GLUT3 inhibitor discovery through in silico ligand screening and in vivo validation in eukaryotic expression systems. Sci. Rep. 2022, 12, 1429. [DOI] [PMC free article] [PubMed] [Google Scholar]
- (20).Tanasova M; Plutschack M; Muroski ME; Sturla SJ; Strouse GF; McQuade DT Fluorescent THF-Based Fructose Analogue Exhibits Fructose-Dependent Uptake. ChemBioChem 2013, 14, 1263–1270. [DOI] [PubMed] [Google Scholar]
- (21).Begoyan VV; Weseliński LJ; Xia S; Fedie J; Kannan S; Ferrier A; Rao S; Tanasova M Multicolor GLUT5-permeable fluorescent probes for fructose transport analysis. Chem. Commun. 2018, 54, 3855–3858. [DOI] [PubMed] [Google Scholar]
- (22).Barclay T; Ginic-Markovic M; Johnston MR; Cooper P; Petrovsky N Observation of the keto tautomer of D-fructose in D2O using H-1 NMR spectroscopy. Carbohydr. Res. 2012, 347, 136–141. [DOI] [PMC free article] [PubMed] [Google Scholar]
- (23).Cocinero EJ; Lesarri A; Écija P; Cimas A; Davis BG; Basterretxea FJ; Fernández JA; Castaño F Free Fructose Is Conformationally Locked. J. Am. Chem. Soc. 2013, 135, 2845–2852. [DOI] [PubMed] [Google Scholar]
- (24).Shi KM; Pedersen CM; Guo ZH; Li YQ; Zheng HY; Qiao Y; Hu TP; Wang YX NMR studies of the tautomer distributions of D-fructose in lower alcohols/DMSO-d(6). J. Mol. Liq. 2018, 271, 926–932. [Google Scholar]
- (25).Tatibouët A; Yang J; Morin C; Holman GD Synthesis and evaluation of fructose analogues as inhibitors of the D-fructose transporter GLUT5. Bioorg. Med. Chem. 2000, 8, 1825–1833. [DOI] [PubMed] [Google Scholar]
- (26).Bennek JA; Gray GR An Efficient Synthesis of Anhydroalditols and Allyl C-Glycosides. J. Org. Chem. 1987, 52, 892–897. [Google Scholar]
- (27).Ley SV; Norman J; Griffith WP; Marsden SP Tetrapropylammonium Perruthenate, Pr4n+Ruo4-, Tpap - a Catalytic Oxidant for Organic-Synthesis. Synthesis 1994, 1994, 639–666. [Google Scholar]
- (28).Zamora-León SP; Golde DW; Concha II; Rivas CI; Delgado-López F; Baselga J; Nualart F; Vera JC Expression of the fructose transporter GLUT5 in human breast cancer. Proc. Natl. Acad. Sci. U.S.A. 1996, 93, 1847–1852. [DOI] [PMC free article] [PubMed] [Google Scholar]
- (29).Rogers S; Docherty SE; Slavin JL; Henderson MA; Best JD Differential expression of GLUT12 in breast cancer and normal breast tissue. Cancer Lett. 2003, 193, 225–233. [DOI] [PubMed] [Google Scholar]
- (30).Naftalin RJ; Rist RJ Evidence That Activation of 2-Deoxy-D-Glucose Transport in Rat Thymocyte Suspensions Results from Enhanced Coupling between Transport and Hexokinase-Activity. Biochem. J. 1989, 260, 143–152. [DOI] [PMC free article] [PubMed] [Google Scholar]
- (31).Smith FA Links between Glucose Uptake and Metabolism in Nitella Translucens. J. Exp. Bot. 1967, 18, 348–358. [Google Scholar]
- (32).Colville CA; Seatter MJ; Gould GW Analysis of the structural requirements of sugar binding to the liver, brain and insulin-responsive glucose transporters expressed in oocytes. Biochem. J. 1993, 294, 753–760. [DOI] [PMC free article] [PubMed] [Google Scholar]
- (33).Soueidan OM; Scully TW; Kaur J; Panigrahi R; Belovodskiy A; Do V; Matier CD; Lemieux MJ; Wuest F; Cheeseman C; West FG Fluorescent Hexose Conjugates Establish Stringent Stereochemical Requirement by GLUT5 for Recognition and Transport of Monosaccharides. ACS Chem. Biol. 2017, 12, 1087–1094. [DOI] [PubMed] [Google Scholar]
- (34).Wieczorke R; Krampe S; Weierstall T; Freidel K; Hollenberg CP; Boles E Concurrent knock-out of at least 20 transporter genes is required to block uptake of hexoses in Saccharomyces cerevisiae. Febs Lett. 1999, 464, 123–128. [DOI] [PubMed] [Google Scholar]
- (35).Tripp J; Essl C; Iancu CV; Boles E; Choe JY; Oreb M Establishing a yeast-based screening system for discovery of human GLUT5 inhibitors and activators. Sci. Rep. 2017, 7, 6197. [DOI] [PMC free article] [PubMed] [Google Scholar]
- (36).Riquelme PT; Wernette-Hammond ME; Kneer NM; Lardy HA Mechanism of action of 2,5-anhydro-D-mannitol in hepatocytes. Effects of phosphorylated metabolites on enzymes of carbohydrate metabolism. J. Biol. Chem. 1984, 259, 5115–5123. [PubMed] [Google Scholar]
- (37).Hanson RL; Ho RS; Wiseberg JJ; Simpson R; Younathan ES; Blair JB Inhibition of Gluconeogenesis and Glycogenolysis by 2,5-Anhydro-D-Mannitol. J. Biol. Chem. 1984, 259, 218–223. [PubMed] [Google Scholar]
- (38).Schmidl S; Tamayo Rojas SA; Iancu CV; Choe JY; Oreb M Functional Expression of the Human Glucose Transporters GLUT2 and GLUT3 in Yeast Offers Novel Screening Systems for GLUT-Targeting Drugs. Front. Mol. Biosci. 2020, 7, 598419–598431. [DOI] [PMC free article] [PubMed] [Google Scholar]
- (39).Nomura N; Verdon G; Kang HJ; Shimamura T; Nomura Y; Sonoda Y; Hussien SA; Qureshi AA; Coincon M; Sato Y; Abe H; Nakada-Nakura Y; Hino T; Arakawa T; Kusano-Arai O; Iwanari H; Murata T; Kobayashi T; Hamakubo T; Kasahara M; Iwata S; Drew D Structure and mechanism of the mammalian fructose transporter GLUT5. Nature 2015, 526, 397–401. [DOI] [PMC free article] [PubMed] [Google Scholar]
- (40).Deng D; Sun P; Yan C; Ke M; Jiang X; Xiong L; Ren W; Hirata K; Yamamoto M; Fan S; Yan N Molecular basis of ligand recognition and transport by glucose transporters. Nature 2015, 526, 391–396. [DOI] [PubMed] [Google Scholar]
- (41).Krieger E; Joo K; Lee J; Lee J; Raman S; Thompson J; Tyka M; Baker D; Karplus K Improving physical realism, stereochemistry, and side-chain accuracy in homology modeling: Four approaches that performed well in CASP8. Proteins 2009, 77, 114–122. [DOI] [PMC free article] [PubMed] [Google Scholar]
- (42).Avogadro: An Open-Source Molecular Builder and Visualization Tool, Version 1.2.0. http://avogadro.cc/.
- (43).Hanwell MD; Curtis DE; Lonie DC; Vandermeersch T; Zurek E; Hutchison GR Avogadro: an advanced semantic chemical editor, visualization, and analysis platform. J. Cheminf. 2012, 4, 17. [DOI] [PMC free article] [PubMed] [Google Scholar]
- (44).Sanner MF Python: a programming language for software integration and development. J. Mol. Graphics Modell. 1999, 17, 57–61. [PubMed] [Google Scholar]
- (45).Morris GM; Huey R; Lindstrom W; Sanner MF; Belew RK; Goodsell DS; Olson AJ AutoDock4 and AutoDockTools4: Automated docking with selective receptor flexibility. J. Comput. Chem. 2009, 30, 2785–2791. [DOI] [PMC free article] [PubMed] [Google Scholar]
- (46).Trott O; Olson AJ AutoDock Vina: Improving the speed and accuracy of docking with a new scoring function, efficient optimization, and multithreading. J. Comput. Chem. 2010, 31, 455–461. [DOI] [PMC free article] [PubMed] [Google Scholar]
- (47).Ebert K; Ewers M; Bisha I; Sander S; Rasputniac T; Daniel H; Antes I; Witt H Identification of essential amino acids for glucose transporter 5 (GLUT5)-mediated fructose transport. J. Biol. Chem. 2018, 293, 2115–2124. [DOI] [PMC free article] [PubMed] [Google Scholar]
- (48).Ainsley J; Chaturvedi SS; Karabencheva-Christova TG; Tanasova M; Christov CZ Integrating molecular probes and molecular dynamics to reveal binding modes of GLUT5 activatory and inhibitory ligands. Chem. Commun. 2018, 54, 9917–9920. [DOI] [PubMed] [Google Scholar]
- (49).Augustin R The protein family of glucose transport facilitators: It’s not only about glucose after all. IUBMB Life 2010, 62, 315–333. [DOI] [PubMed] [Google Scholar]
- (50).Kapoor K; Finer-Moore JS; Pedersen BP; Caboni L; Waight A; Hillig RC; Bringmann P; Heisler I; Müller T; Siebeneicher H; Stroud RM Mechanism of inhibition of human glucose transporter GLUT1 is conserved between cytochalasin B and phenylalanine amides. Proc. Natl. Acad. Sci. U.S.A. 2016, 113, 4711–4716. [DOI] [PMC free article] [PubMed] [Google Scholar]
- (51).Uldry M; Ibberson M; Hosokawa M; Thorens B GLUT2 is a high affinity glucosamine transporter. FEBS Lett. 2002, 524, 199–203. [DOI] [PubMed] [Google Scholar]
- (52).Wood TE; Dalili S; Simpson CD; Hurren R; Mao XL; Saiz FS; Gronda M; Eberhard Y; Minden MD; Bilan PJ; Klip A; Batey RA; Schimmer AD A novel inhibitor of glucose uptake sensitizes cells to FAS-induced cell death. Mol. Cancer Ther. 2008, 7, 3546–3555. [DOI] [PubMed] [Google Scholar]
- (53).Rogers S; Chandler JD; Clarke AL; Petrou S; Best JD Glucose transporter GLUT12-functional characterization in Xenopus laevis oocytes. Biochem. Biophys. Res. Commun. 2003, 308, 422–426. [DOI] [PubMed] [Google Scholar]
- (54).DeBosch BJ; Chi M; Moley KH Glucose transporter 8 (GLUT8) regulates enterocyte fructose transport and global mammalian fructose utilization. Endocrinology 2012, 153, 4181–4191. [DOI] [PMC free article] [PubMed] [Google Scholar]
- (55).Wuest M; Hamann I; Bouvet V; Glubrecht D; Marshall A; Trayner B; Soueidan OM; Krys D; Wagner M; Cheeseman C; West F; Wuest F Molecular Imaging of GLUT1 and GLUT5 in Breast Cancer: A Multitracer Positron Emission Tomography Imaging Study in Mice. Mol. Pharmacol. 2018, 93, 79–89. [DOI] [PubMed] [Google Scholar]
- (56).Ramirez DM; Ogilvie WW; Johnston LJ NBD-cholesterol probes to track cholesterol distribution in model membranes. Biochim. Biophys. Acta 2010, 1798, 558–568. [DOI] [PubMed] [Google Scholar]
- (57).Hamann I; Krys D; Glubrecht D; Bouvet V; Marshall A; Vos L; Mackey JR; Wuest M; Wuest F Expression and function of hexose transporters GLUT1, GLUT2, and GLUT5 in breast cancer-effects of hypoxia. FASEB J. 2018, 32, 5104–5118. [DOI] [PubMed] [Google Scholar]
- (58).Solis-Escalante D; van den Broek M; Kuijpers NGA; Pronk JT; Boles E; Daran J-M; Daran-Lapujade P The genome sequence of the popular hexose-transport-deficient Saccharomyces cerevisiae strain EBY.VW4000 reveals LoxP/Cre-induced translocations and gene loss. FEMS Yeast Research 2015, 15 (2), fou004. [DOI] [PubMed] [Google Scholar]
- (59).McCloy RA; Rogers S; Caldon CE; Lorca T; Castro A; Burgess A Partial inhibition of Cdk1 in G(2) phase overrides the SAC and decouples mitotic events. Cell Cycle 2014, 13, 1400–1412. [DOI] [PMC free article] [PubMed] [Google Scholar]
Associated Data
This section collects any data citations, data availability statements, or supplementary materials included in this article.