

Abstract
Epigenomic maps identify gene regulatory elements by their chromatin state. However, prevailing short-read sequencing methods cannot effectively distinguish alleles, evaluate the inter-dependence of elements in a locus, or capture single-molecule dynamics. Here we apply targeted nanopore sequencing to profile chromatin accessibility and DNA methylation on contiguous ~100-kb DNA molecules that span loci relevant to development, immunity and imprinting. We detect promoters, enhancers, insulators and transcription factor footprints on single molecules based on exogenous GpC methylation. We infer relationships among dynamic elements within immune loci, and order successive remodeling events during T-cell stimulation. Finally, we phase primary sequence and regulatory elements across the H19/IGF2 locus, uncovering primate-specific features. These include a segmental duplication that stabilizes the imprinting control region and a non-canonical enhancer that drives bi-allelic IGF2 expression in specific contexts. Our study advances emerging strategies for phasing gene regulatory landscapes and reveals a mechanism that overrides IGF2 imprinting in human cells.
Introduction
Systematic identification and characterization of gene regulatory elements is a major challenge with broad implications for health and disease1–4. Epigenomic maps can identify promoters, enhancers, silencers and insulators based on chromatin modifications or accessibility. Their systematic application has revealed millions of putative regulatory elements in the human genome5–8.
Yet the impact of these data on our understanding of gene regulation is constrained by technological limitations. Prevailing methods for mapping modifications (ChIP-seq), accessibility (ATAC-seq, DNase-seq) and DNA methylation (WGBS) are anchored in short-read sequencing and, hence, cannot effectively parse complex, repetitive loci nor distinguish alternate chromosomal alleles. Moreover, since these methods evaluate each modification or element separately, they cannot directly compare different epigenetic features or relate adjacent elements on the same DNA molecule.
Strategies that combine epigenomic assays with long-read sequencing hold considerable promise to address these limitations. For example, accessible DNA can be marked by recombinant DNA methyltransferases in situ (‘Nucleosome Occupancy and Methylome Sequencing’ or NOMe-seq)9,10. Contiguous accessibility profiles can then be acquired by sequencing the modified genomic DNA with Oxford Nanopore Technologies (ONT) or Pacific Biosciences (PacBio) instruments. These approaches have been applied to map accessibility, transcription factor (TF) binding, and nucleosome positioning11–15. In addition to discerning such features based on exogenous methylation, the long-read data capture endogenous CpG methylation on the same molecules.
Despite progress, read lengths and throughput remain a bottleneck to applying these tools at scale. Epigenomic maps require high coverage and must be generated across many cell states, which is currently cost-prohibitive. Furthermore, whereas recent studies have achieved average read lengths on the order of 10 kb, many elements regulate genes that are tens or hundreds of kb away.
A promising approach to address the throughput gap leverages CRISPR/Cas9 to enrich specific loci. Target regions are freed by cleaving flanking sites with in vitro assembled ribonucleoproteins (RNPs). Sequencing adaptors are then ligated to the cleaved sites16. This strategy was used to sequence native DNA molecules for 10 loci to high coverage on an ONT flow cell17. However, the enriched loci had an average size of 12 to 24 kb, and coverage for a larger locus was low. Hence, effective characterization of distal regulatory interactions and even moderately sized loci requires further technological refinement.
Here, we establish a targeted nanopore sequencing approach that overcomes coverage and read length constraints by enriching and sequencing DNA molecules up to 116 kb in length. We combine this approach with NOMe-seq to phase genetic variants, DNA methylation, and chromatin accessibility across expansive developmental, immune and imprinted loci. The phased, single-molecule data provide new insights into the progressive changes in regulatory element and chromatin states that accompany T-cell activation. They also reveal regulatory features of the imprinted H19/IGF2 locus, including a primate-specific non-canonical enhancer that drives bi-allelic IGF2 in proliferative tissues.
Results
Targeted long-read sequencing of accessibility and DNA methylation
We sought to establish efficient procedures for profiling regulatory elements on long DNA molecules corresponding to genomic loci of interest. We leveraged the GpC-specific 5-methylcytosine methyltransferase (M.CviPI) to mark accessible DNA in native nuclei, as in NOMe-seq10. Briefly, nuclei from the human cell lines GM12878 and K562, H9 embryonic stem cells (ESCs), and primary CD4+ T cells were isolated, permeabilized and treated with M.CviPI (Fig. 1a; see Methods). High molecular weight (HMW) genomic DNA (gDNA) was harvested, and loci of interest were enriched using a modified CRISPR/Cas9-based approach as follows.
Fig. 1 |. Phasing chromatin accessibility and DNA methylation across long single molecules.
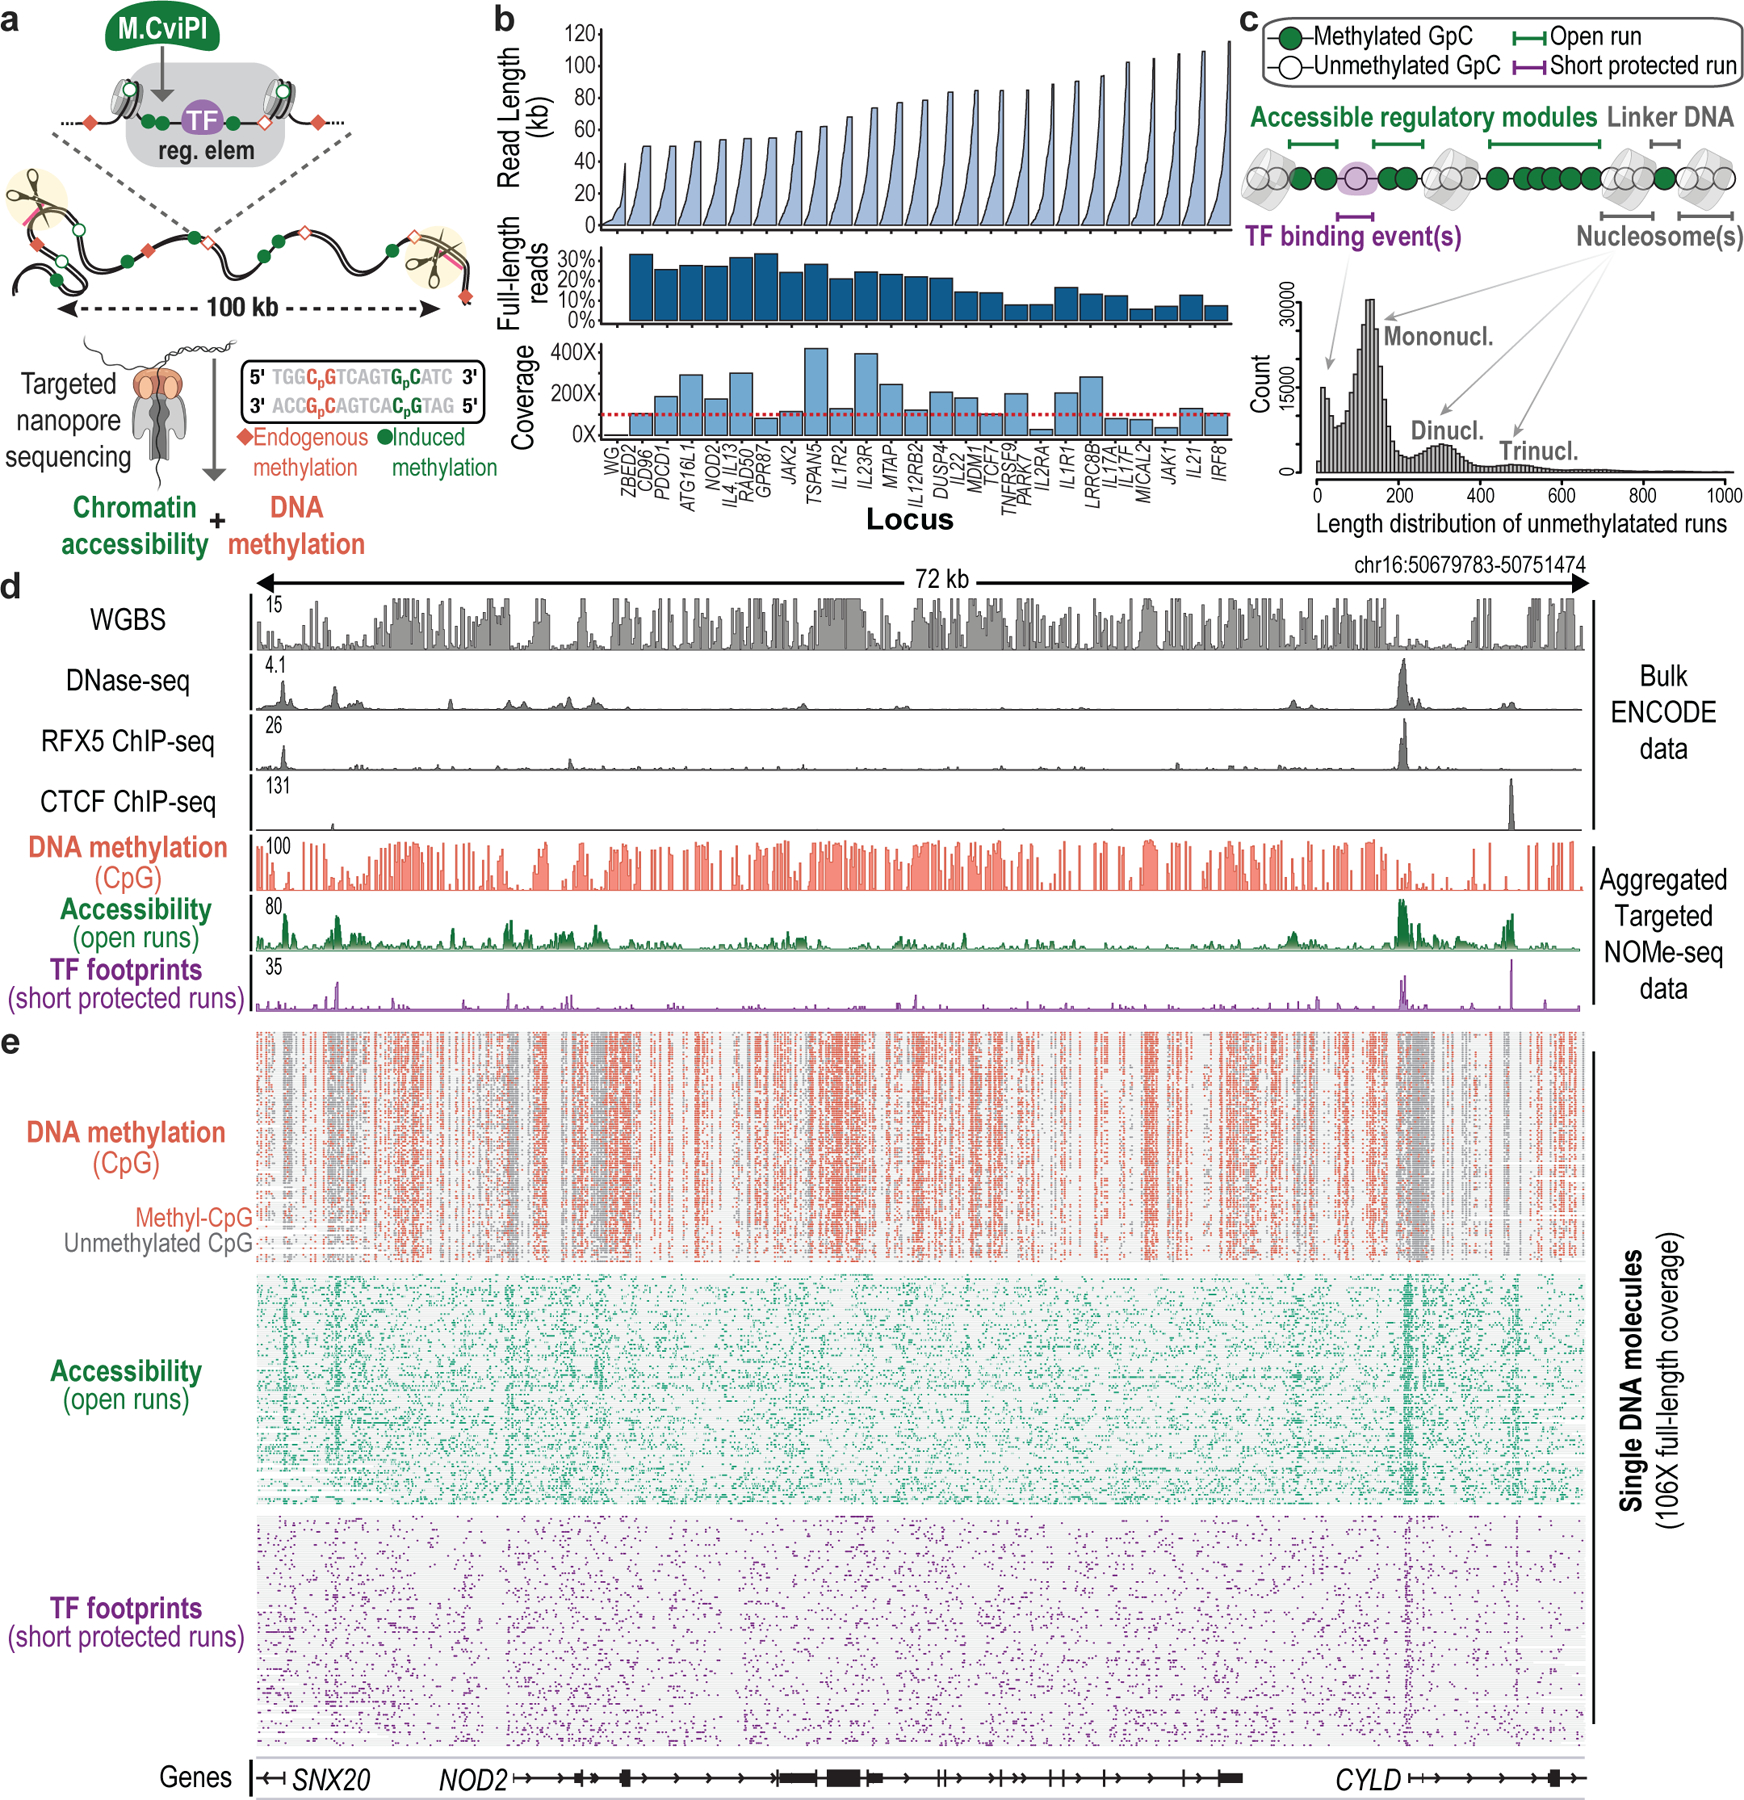
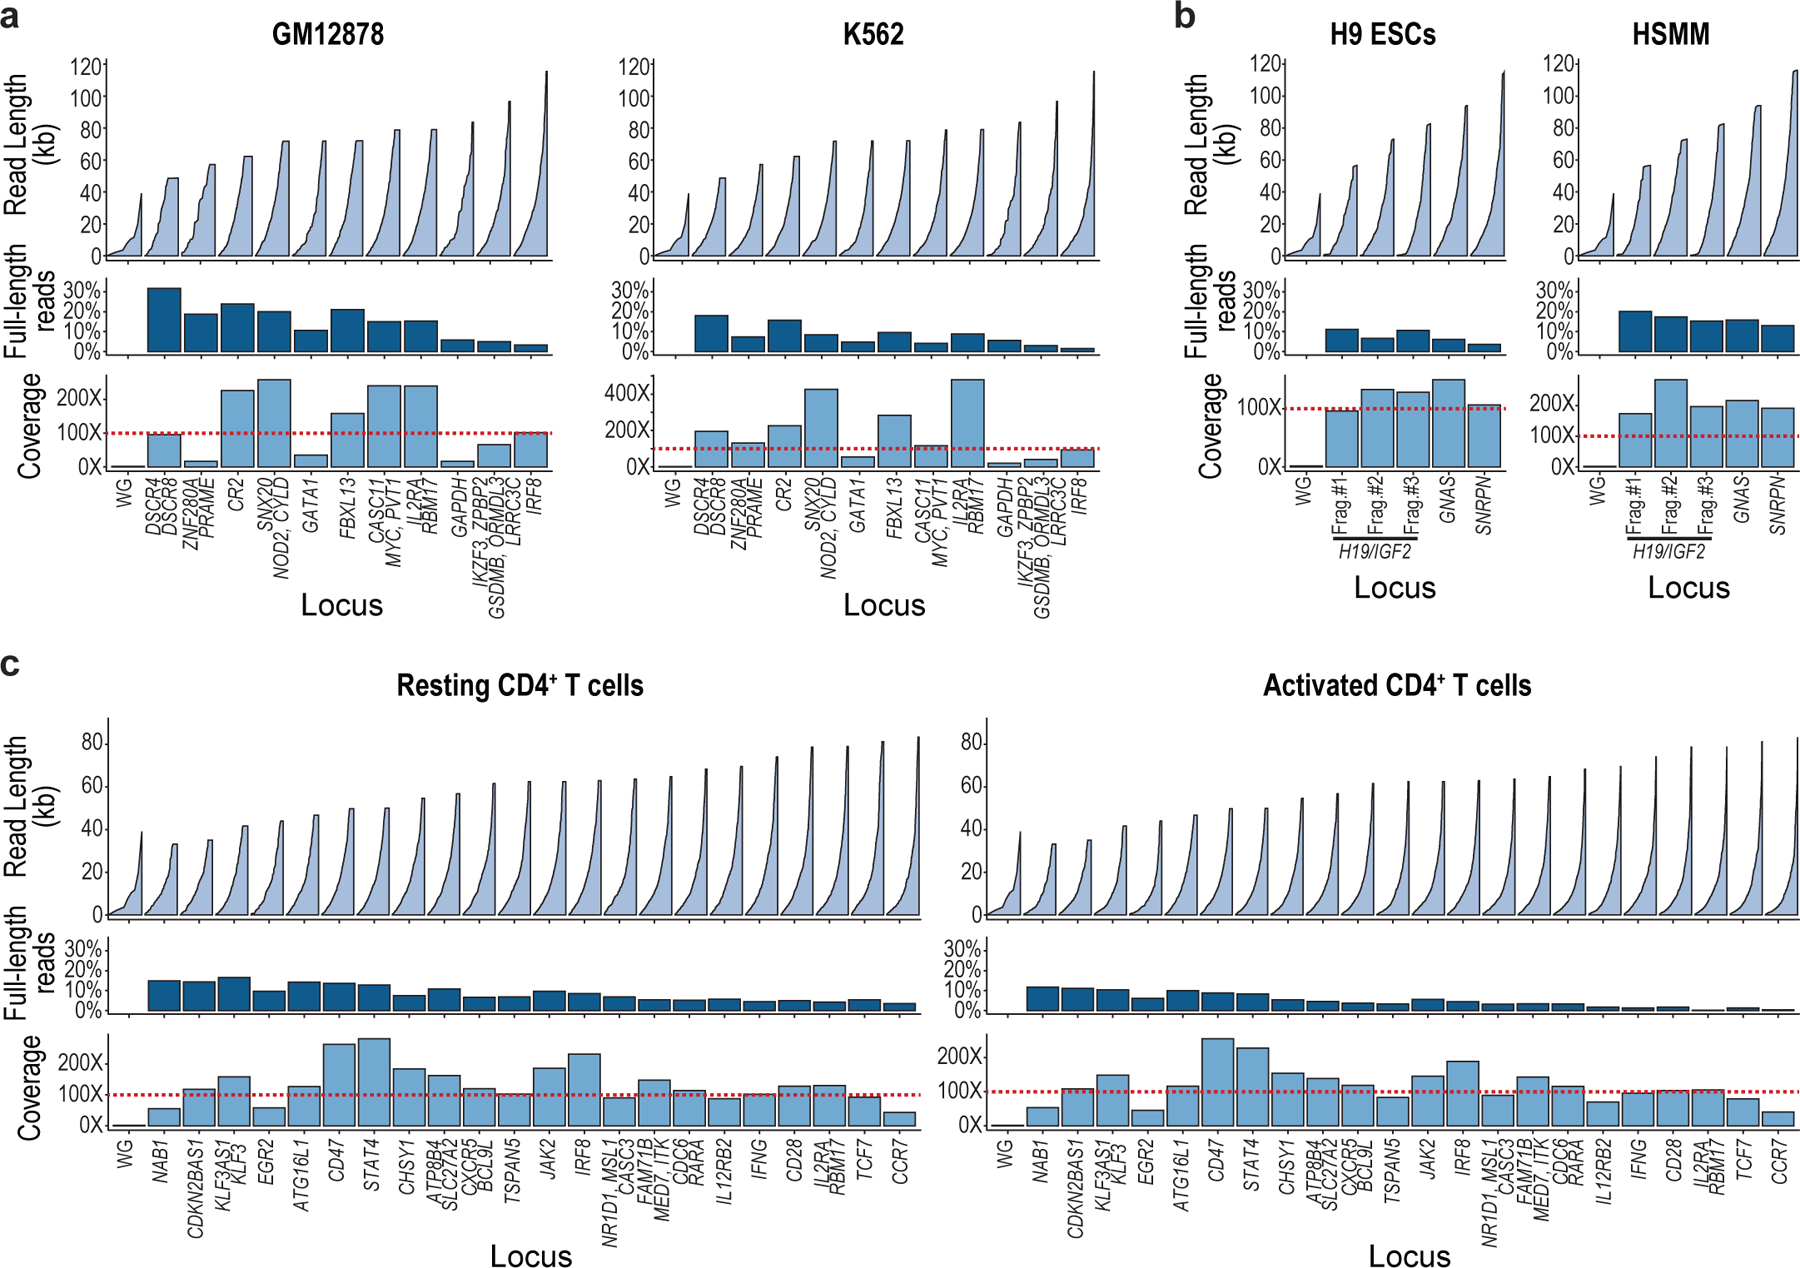
a, Experimental overview. Accessible chromatin is marked in situ using a GpC methyltransferase (M.CviPI), as in NOMe-seq10,13. HMW gDNA is extracted, dephosphorylated, and incubated with a pool of Cas9/RNA complexes targeting sites that flank target loci of interest. Released fragments are adapted and directly sequenced to high coverage, thereby capturing primary sequence, endogenous CpG methylation (red diamonds) and exogenous GpC methylation (green circles) indicative of accessibility. b, 24 loci ranging from 50 to 115 kb were released and sequenced with up to 485-fold coverage enrichment and 34% full-length reads. Plots show reads sorted in ascending order by size (top), percent of full-length reads (middle), and coverage (bottom) for each locus in data acquired for resting CD4+ T cells. c, Analytical approach. Runs of GpC methylation distinguish accessible regions with potential regulatory functions (open runs), TF binding events (short-protected runs) and nucleosomal DNA (longer protected intervals) across individual DNA molecules. d, Genomic tracks for a target locus (NOD2) show CpG methylation, accessibility and TF footprints aggregated over NOMe-seq reads compared to gold-standard WGBS, DNase-seq and ChIP-seq data for GM12878. e, CpG methylation (methyl-CpG in red; unmethylated CpG in dark gray), open runs (green) and TF footprints (purple) are shown for the corresponding reads (rows, 106 reads, 72 kb in length). The correspondence between individual reads and aggregate profiles supports the accuracy of the phased single-molecule data.
We targeted three sets of loci ranging from 50 to 116 kb (Supplementary Table 1). The first set included 11 loci with differential regulation in GM12878 and K562. The second included 24 immune loci regulated in T cells. The third included 3 imprinted loci implicated in developmental disorders and cancer. For each locus, we designed four sgRNAs, two at each end, to maximize cleavage. We cleaved HMW gDNA with pools of Cas9/sgRNA RNPs (Fig. 1a). The cleaved products, which carry a 5’ phosphate group, were then selectively ligated to nanopore sequencing adapters. We optimized procedures for M.CviPI methylation, RNP cleavage and library preparation to maximize on-target cleavage, while preserving ultra-long DNA molecules and avoiding spurious fragmentation.
We piloted the procedure on gDNA prepared from M.CviPI-treated GM12878 or K562 nuclei, which we enriched using the first RNP pool (891 kb total sequence; 0.03% of the genome). Libraries were run on a MinION flow cell, yielding 592,730 reads for a total of 7.83 Gb. We used nanopolish to call endogenous CpG methylation in the HCG context and exogenous GpC methylation in the GCH context13 (Extended Data Fig. 1). We confirmed that the CpG methylation calls were consistent with WGBS data (r = 0.89). Target loci were enriched >300-fold over the genome background (Fig. 1b and Extended Data Fig. 2). We generated long-read sequencing data for multiple cell types with target loci covered at up to 485× (median 125×), with an N50 read length of ~50 kb. These read lengths and fold-enrichments represent a significant advance16–18.
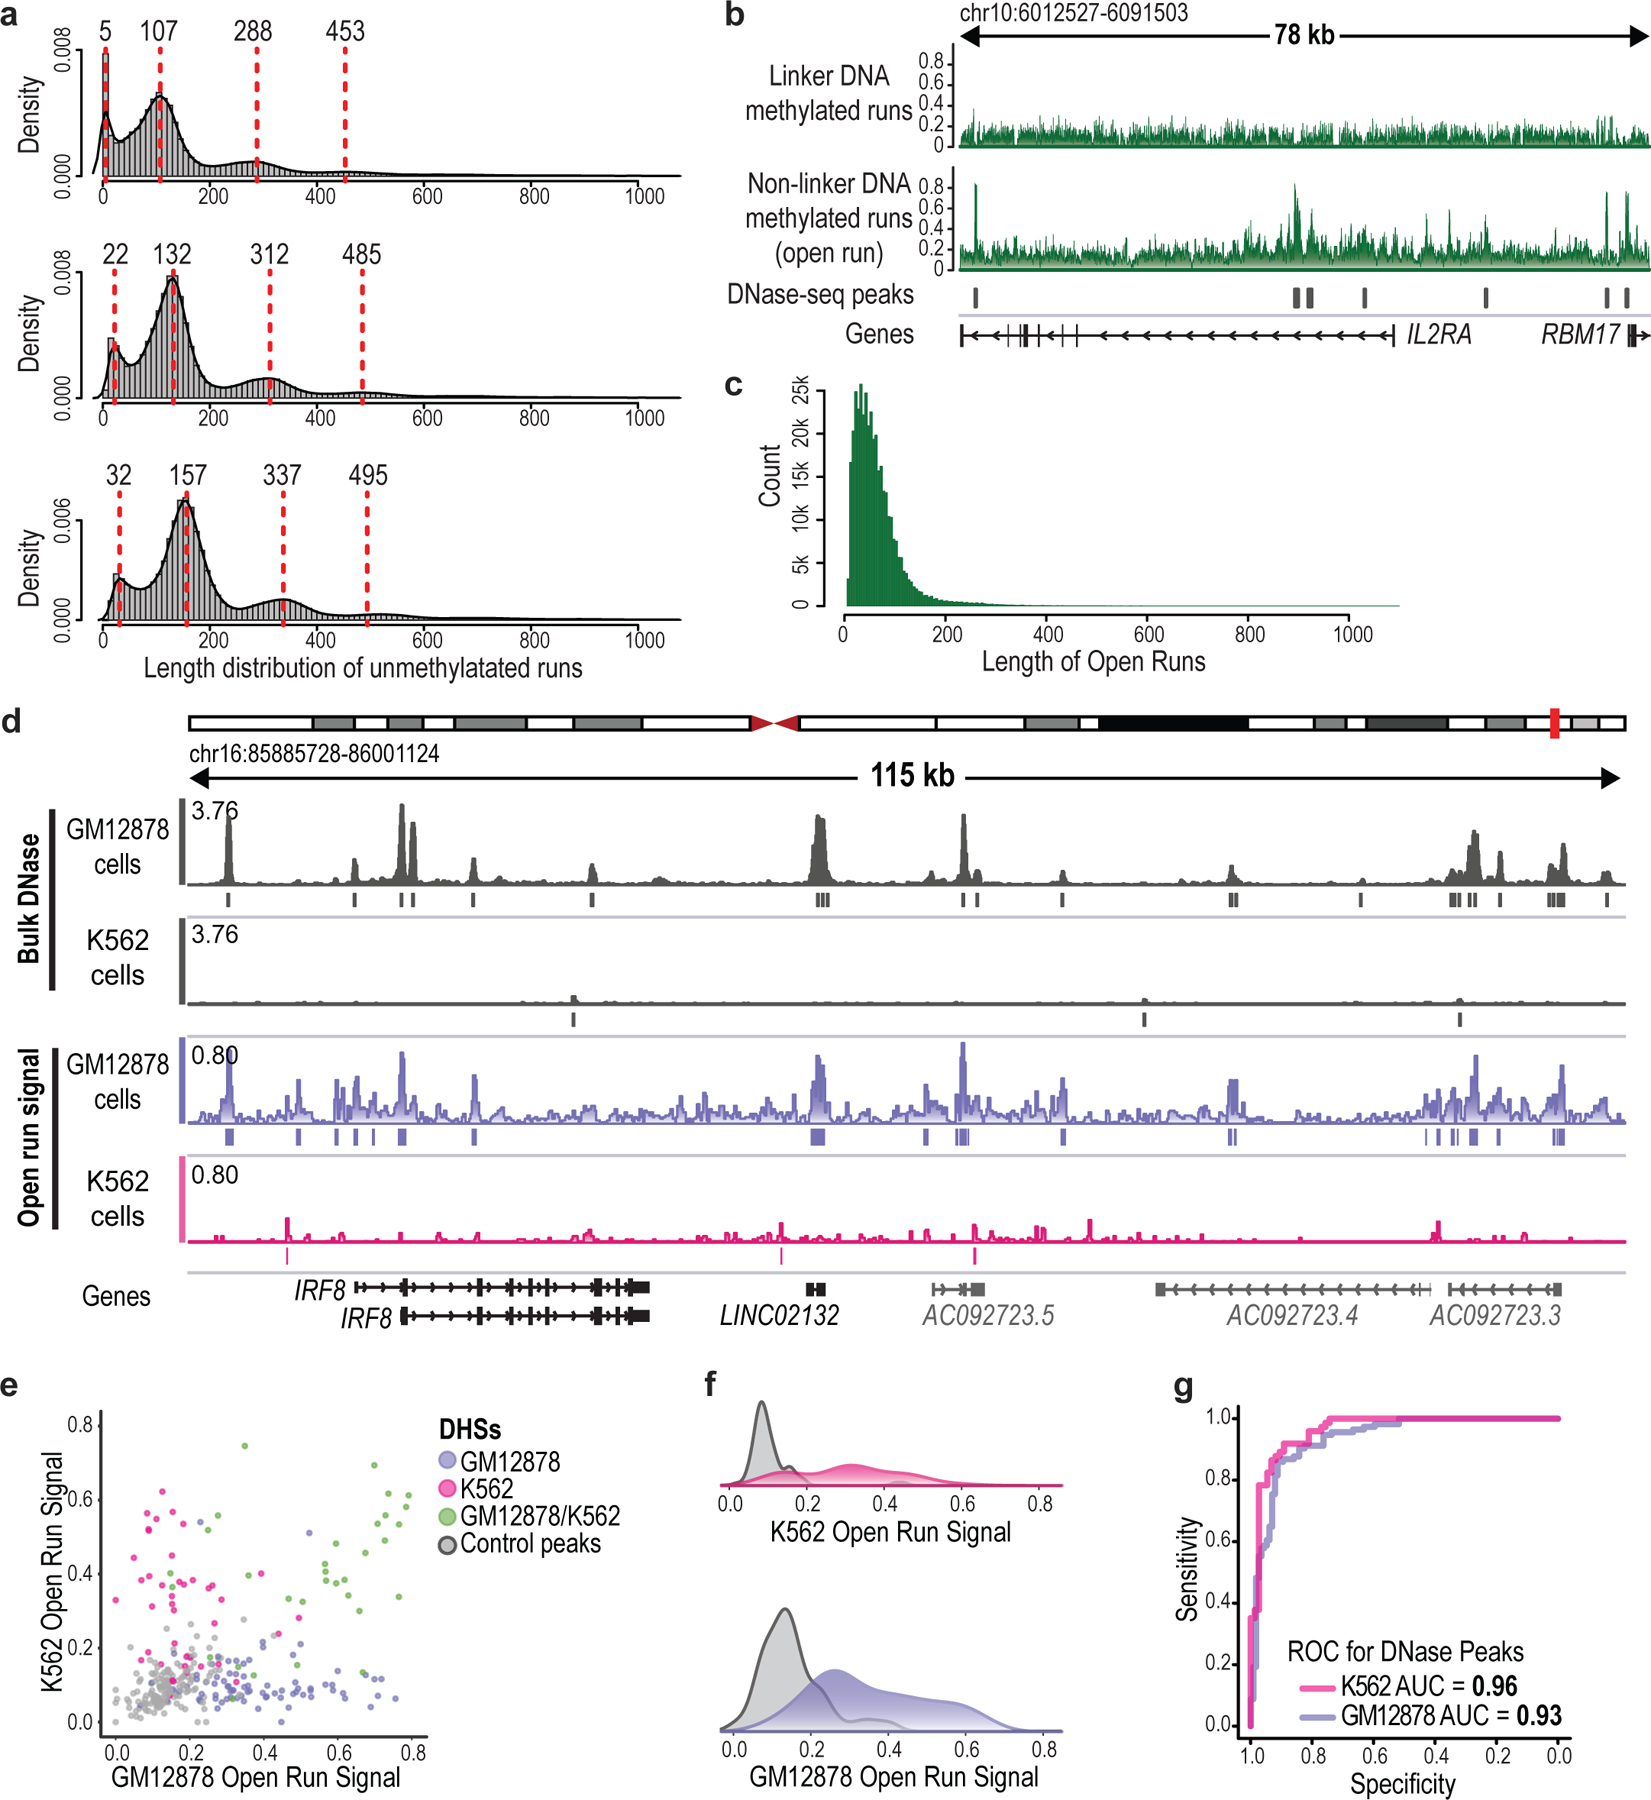
We next examined the patterns of M.CviPI-catalyzed GpC methylation across individual DNA molecules. We observed that unmethylated ‘protected’ stretches exhibited characteristic length distributions. The most prominent peak at 132 bp corresponds to a single protected nucleosome, while peaks at 312 and 485 bp are consistent with closely packed di- and tri-nucleosomes. Also evident were ‘short-protected runs’ (<80 bp) consistent with stable TF binding (see below; Fig. 1c and Extended Data Fig. 3a). Conversely, we observed accessible segments, within which most or all GpCs were methylated. We used these characteristics to annotate short-protected runs (<80 bp of unmethylated GpCs) and accessible DNA elements (‘open runs’) for each individual read (Fig. 1c and Extended Data Fig. 3b,c).
To validate our annotations, we benchmarked the open runs against DNase-seq data6. We generated ‘pseudo-bulk’ accessibility tracks for GM12878 and K562 cells by aggregating open run signals across sequenced reads for the 11 regions. These tracks closely correlated with DNase-seq (GM12878 AUC = 0.94; K562 AUC = 0.96; Fig. 1d,e and Extended Data Fig. 3d–g). In contrast, excluded linker segments had a much lower correspondence (see Methods; Extended Data Fig. 3b).
Thus, our approach coordinately detects accessible chromatin, nucleosomal DNA and endogenous methylation across ultra-long DNA molecules corresponding to target loci.
Charting regulatory elements and TF binding across single molecules
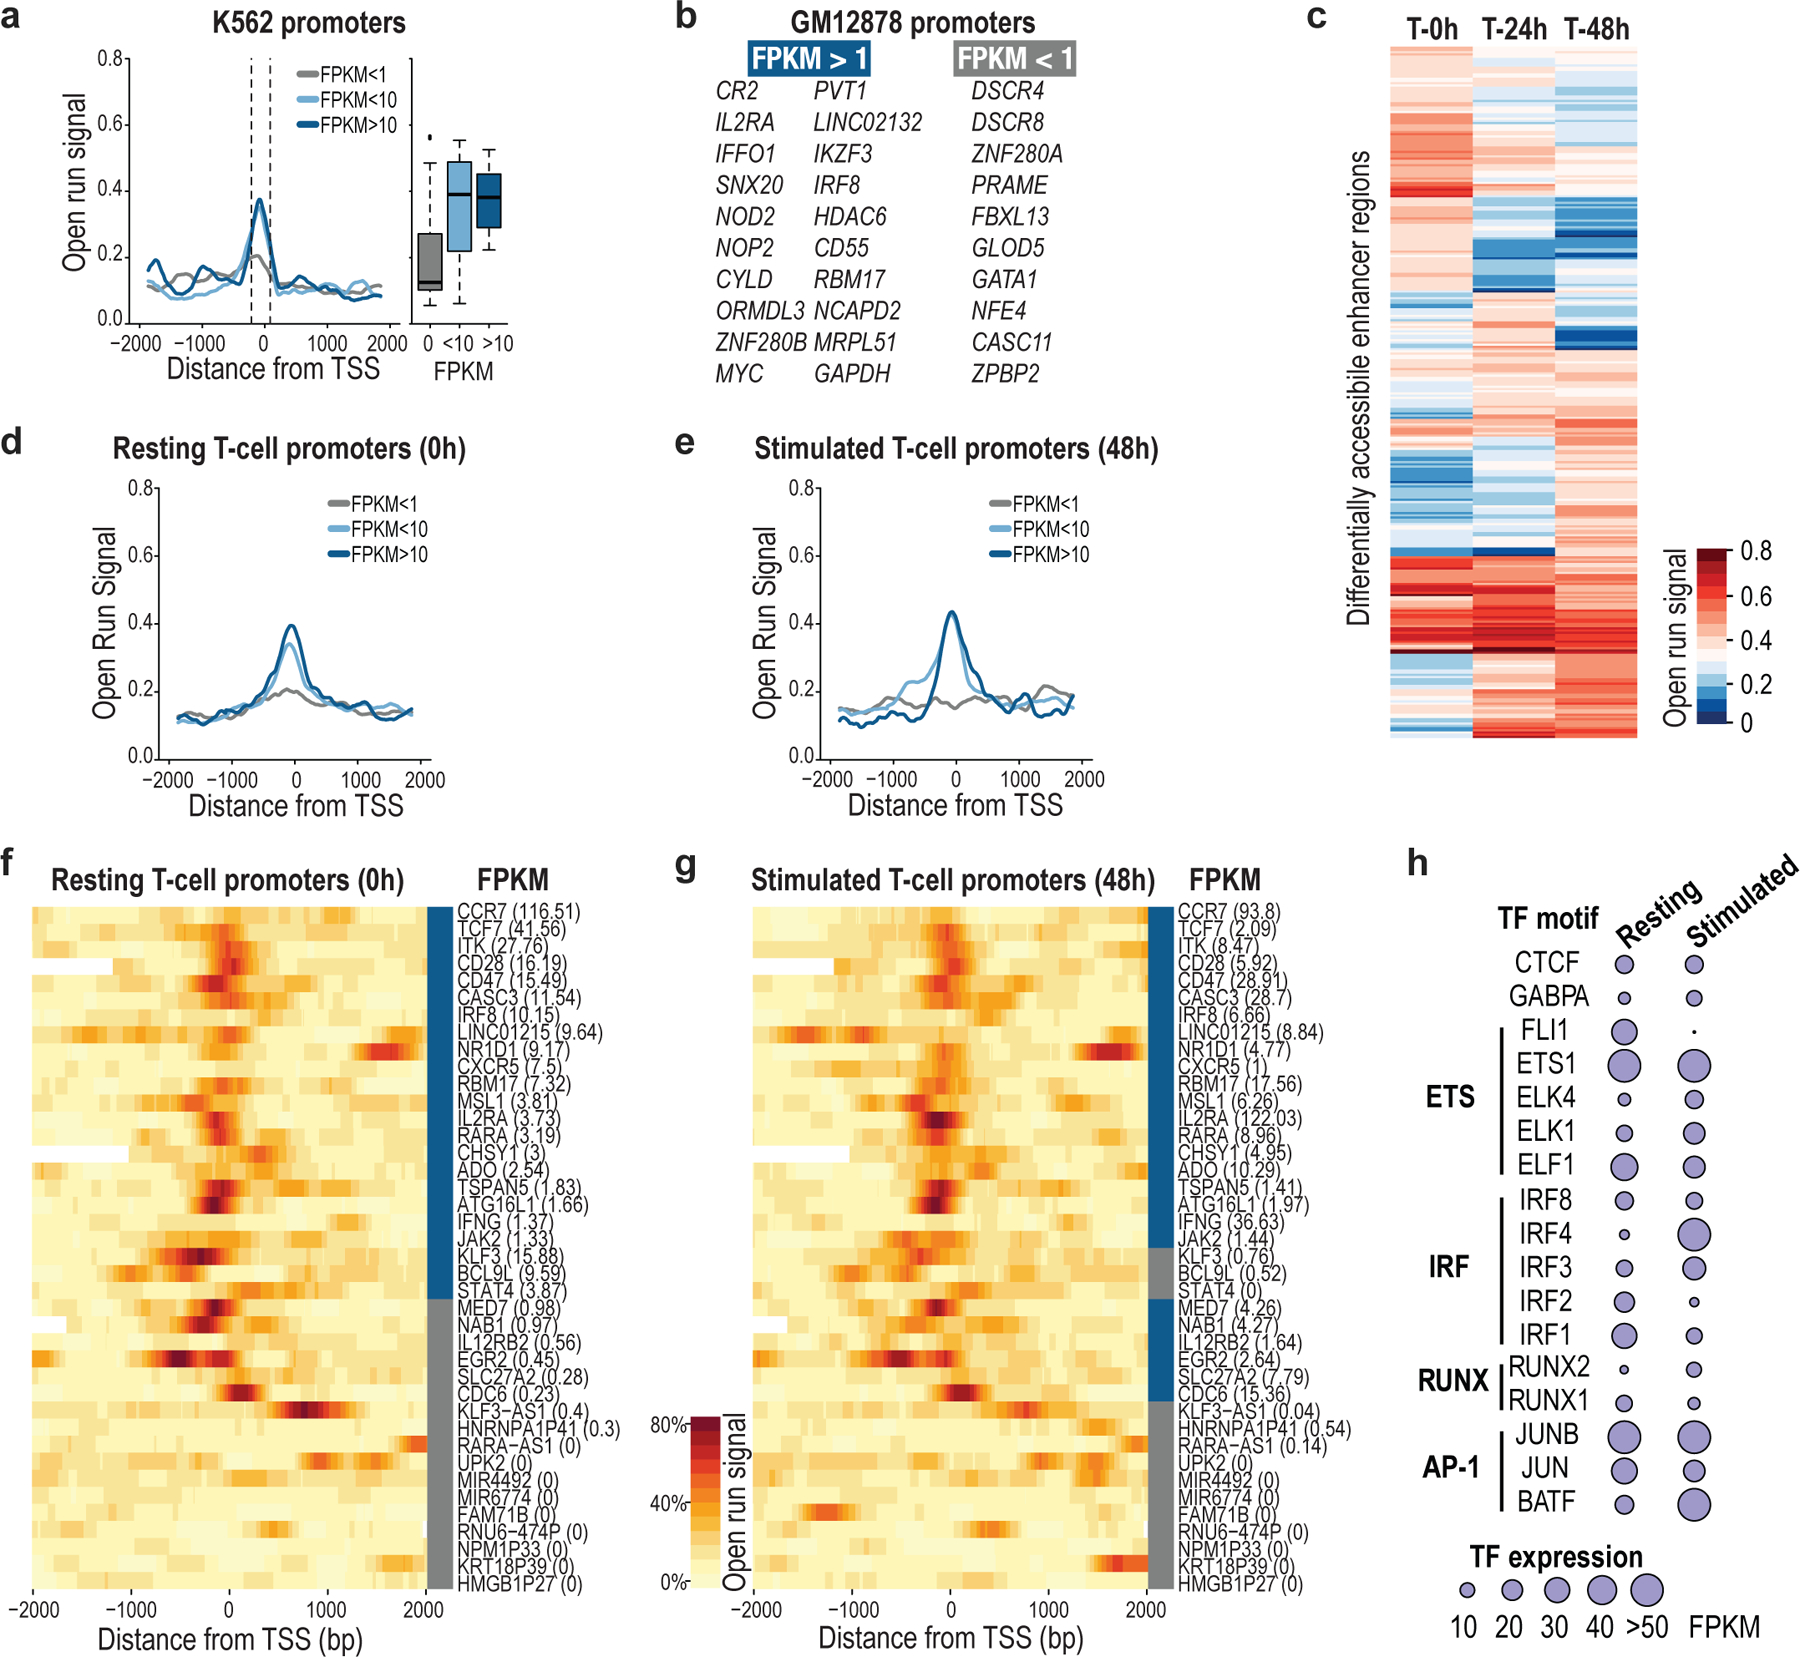
Recent studies have highlighted marked cell-to-cell variability in gene and regulatory element activity5,19,20. We therefore investigated whether NOMe-seq could capture variability in promoter and enhancer states at the level of single molecules or alleles. Focusing initially on 46 genes in our target loci, we compared promoter accessibility (aggregated open runs) to RNA-seq. We confirmed a strong correspondence between promoter accessibility and gene expression in GM12878 and K562 cells (Fig. 2a, Extended Data Fig. 4a,b). These differential patterns were evident at the individual read level, with active promoters distinguished by open runs and low CpG methylation (Fig. 2b–d).
Fig. 2 |. Single-molecule promoter, enhancer and TF binding states.
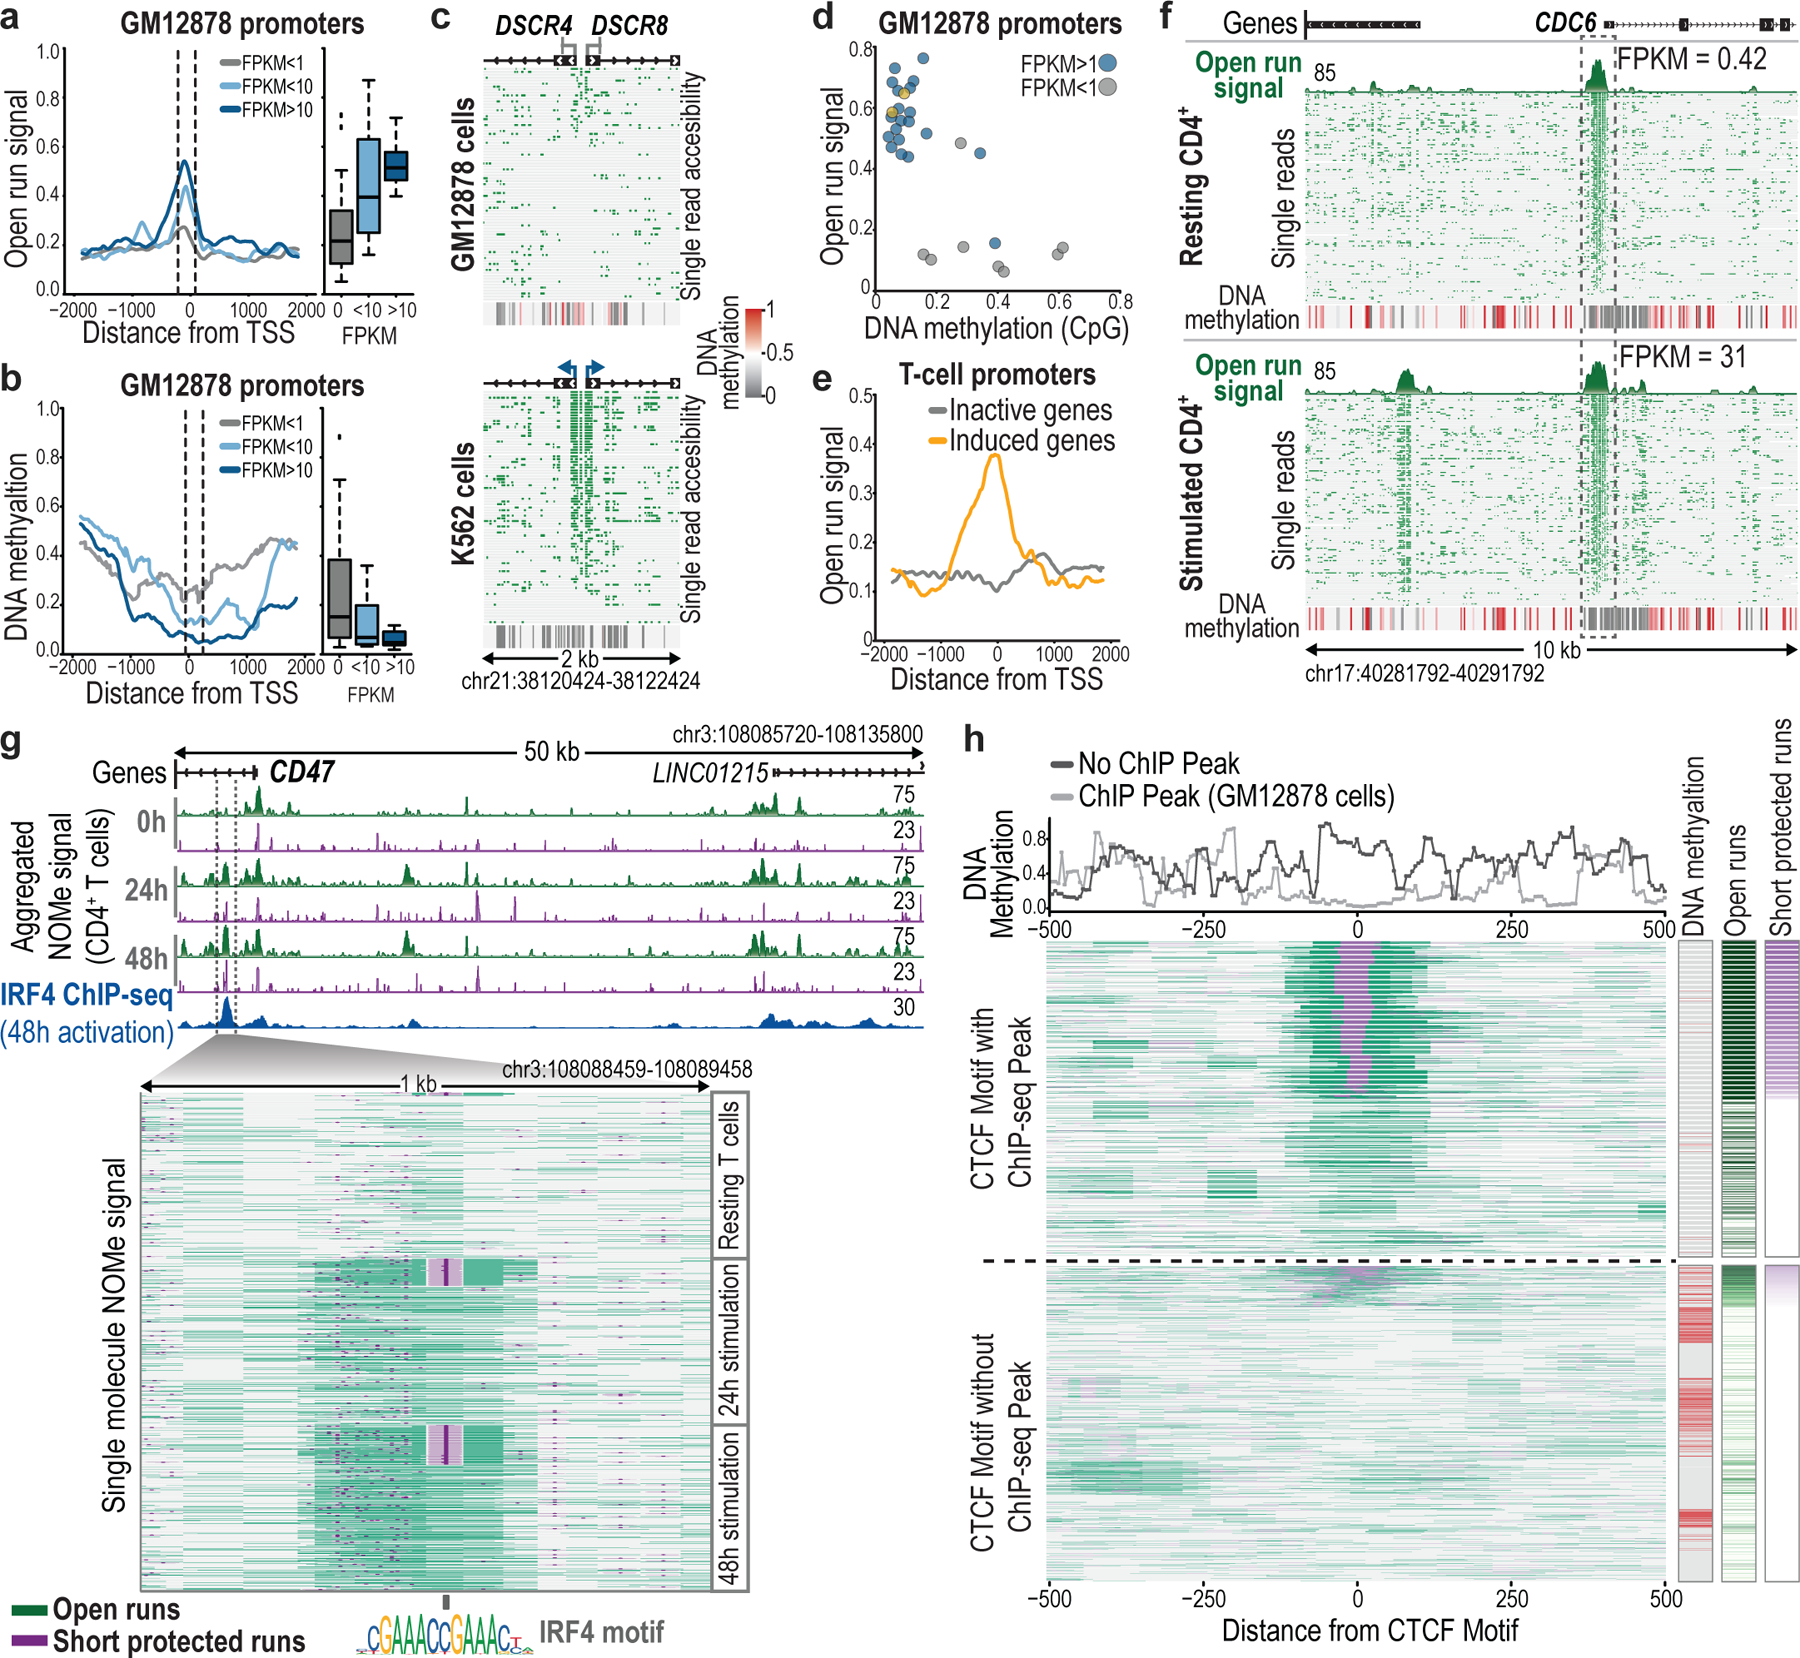
a, Metaplot of open run signal in GM12878 centered at 46 transcription start sites (TSSs). Boxplots show open run distribution for 150-bp windows centered 60 bp upstream of TSSs. Boxes indicate median and first and third quartiles, whiskers and datapoints reflect outliers. FPKM <1: n = 21; FPKM <10: n = 9; FPKM <10: n = 10. b, Metaplot and boxplots show CpG methylation distribution over the same TSSs as in (a), for 150-bp windows centered 100 bp downstream of TSSs. c, Plot shows 79 (top) and 82 (bottom) reads (rows) marked with open runs (green) for the DSCR4/DSCR8 bidirectional promoter, which is silent in GM12878, but expressed in K562. Aggregate DNA methylation signal is shown below. d, Open run signal and methylation in GM12878 promoters, colored by expression state. Yellow dots notate inactive genes (CASC11, ZPBP2) that share a promoter with active genes (MYC, IKZF3). e, Metaplot of open run signal in resting CD4+ T cells for 17 TSSs that are inactive (FPKM <1) in resting cells, stratified by their expression after stimulation. f, Plot shows individual reads marked with open runs for the CDC6 locus with aggregate open run signal and DNA methylation in resting (top; 137 reads) and stimulated cells (bottom; 137 reads). Although the promoter state is unchanged, an upstream enhancer gains accessibility upon stimulation. g, Tracks show coordinate change in accessibility (green) and TF footprints (purple) for the CD47 locus in T cells at rest (0 h) and with stimulation (24 h, 48 h). ChIP-seq for IRF4 in activated cells is shown. Inset shows 330 reads for each time point (rows) marked with open runs (green) and ordered by short-protected runs (purple) that overlap IRF4 motifs. h, Metaplot shows individual reads from GM12878 centered over 30 CTCF motifs. Reads are stratified by whether the motif is bound (top; 13 sites; 1577 reads) or unbound (bottom, 17 sites; 1895 reads) per ChIP-seq. Reads are marked with open runs and sorted by short protected runs. The metaplot above shows aggregate CpG methylation. For each read, color bars (right) show CpG methylation (red), open run signal (green), and short-protected run signal (purple) averaged over a 50-bp window over the motif.
To investigate a more dynamic system, we stimulated CD4+ T cells using tetrameric antibodies, and performed NOMe-seq on three populations: unstimulated (0 h), stimulated for 24 hours (24 h) and stimulated for 48 hours (48 h). We enriched and sequenced 24 immune loci from each population on MinION flow cells. We again observed an overall correspondence between promoter accessibility and expression across 40 genes within the target loci (Extended Data Fig. 4d,e). However, closer analysis revealed that 6 of the 28 genes with accessible promoters in the resting population were not expressed in these cells. Interestingly, all 6 of these genes were induced upon stimulation, despite little change in promoter accessibility, consistent with a poised state in the unstimulated cells (Fig. 2e, Extended Data Fig. 4f,g). In contrast to the promoters, several putative enhancers near these activated genes became newly accessible upon stimulation (Extended Data Fig. 4c). A notable example is the CDC6 locus, which encodes a cell cycle regulator induced upon T-cell stimulation. The CDC6 promoter is consistently accessible across single molecules at 0 h, 24 h and 48 h, suggestive of a poised or initiating state in the non-expressing unstimulated cells. However, a nearby putative CDC6 enhancer is dynamic (Fig. 2f). Although the element is rarely accessible on molecules from unstimulated cells, it is marked by open runs on a large majority of molecules from stimulated cells. Notably, promoter and putative enhancer both have very low CpG methylation across the molecules, regardless of cell state (Fig. 2f). These analyses suggest that the transcriptional state of genes on single molecules may be inferred based on GpC and CpG methylation levels over their promoters and nearby enhancers.
Closer investigation of GpC methylation patterns revealed short-protected runs indicative of TF binding or ‘footprints’, consistent with previous observations10,13,21,22. Examination of the CYLD locus in GM12878 cells highlights short-protected runs overlapping an RFX5 binding footprint in the promoter and a downstream CTCF binding site. These footprints were detected on 82% and 35% of single molecules, respectively (Fig. 1e). We also detected TF footprints that were dynamic during T-cell stimulation, as exemplified by short-protected runs downstream of the CD47 promoter (Fig. 2g). ChIP-seq and motif analysis indicate that this site is bound by IRF4, a TF with broad regulatory functions in stimulated T cells23–25 (Extended Data Fig. 4h; see Methods). The IRF4 footprint was evident on just 1.8% (6/330) of NOMe-seq reads from resting cells, but 16.4% (54/330) and 23.7% (78/330) reads from 24 h and 48 h stimulated T cells, respectively. This differential TF occupancy is consistent with a stark change in IRF4 association over the course of stimulation and CD47 induction (Extended Data Fig. 4f,g,h).
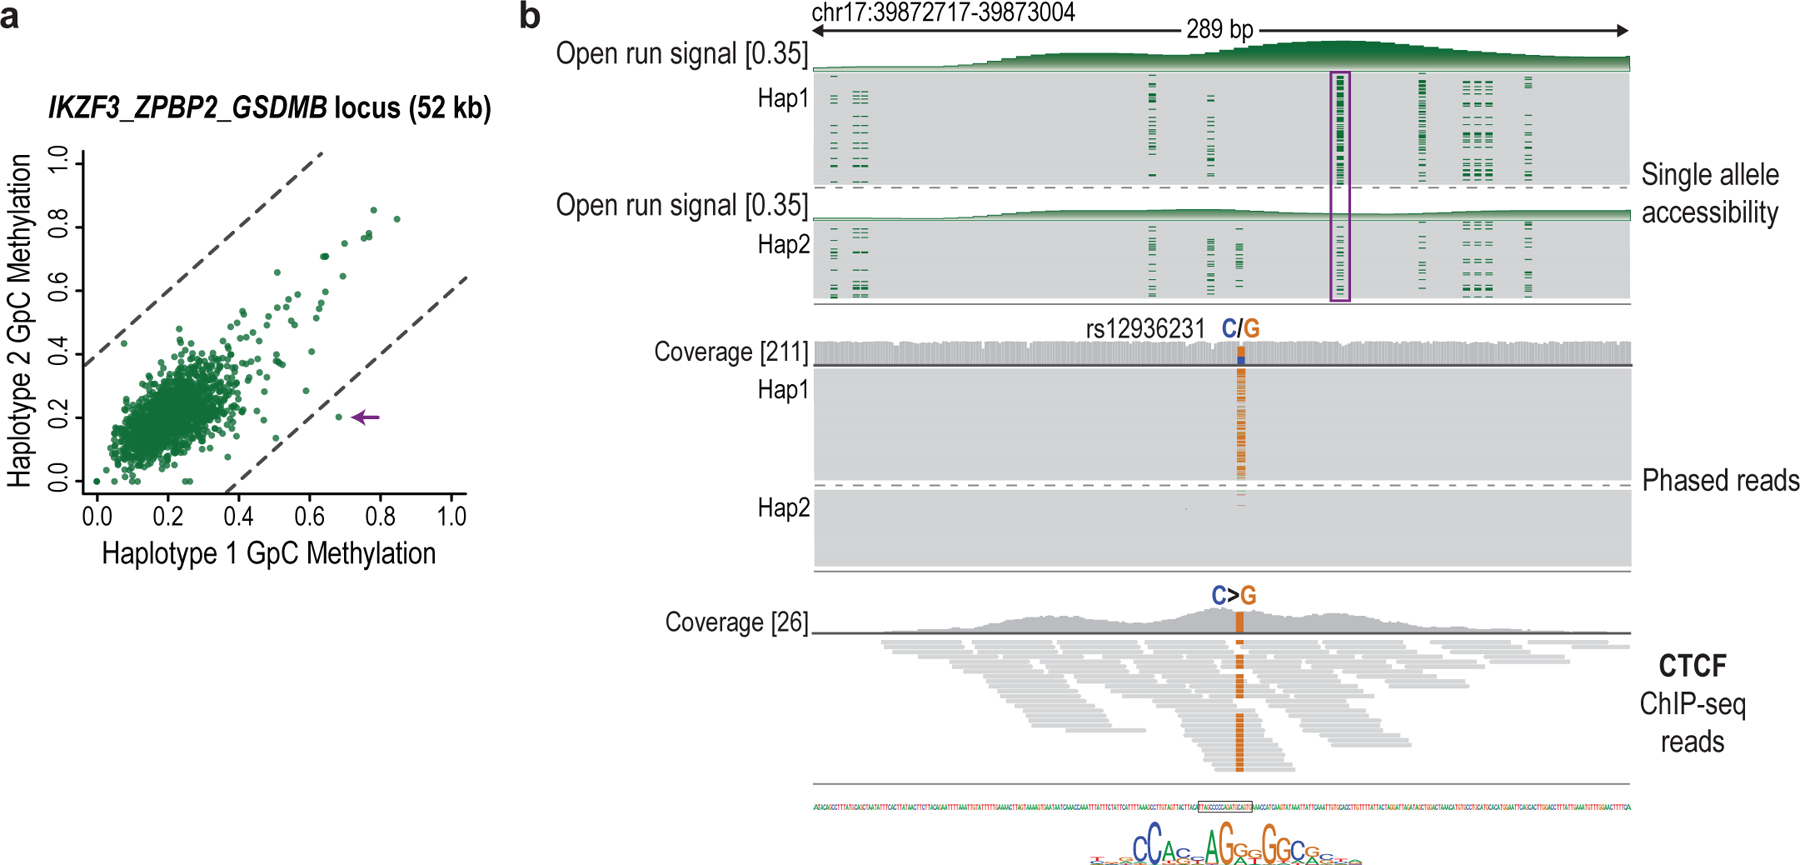
Finally, we investigated the relationship between TF binding and endogenous CpG methylation. The CTCF insulator recognizes a 14 bp motif, but is hindered by DNA methylation26. CTCF footprints were readily evident in the NOMe-seq reads, providing an opportunity to relate binding and methylation at the level of single molecules. We first considered ‘bound’ CTCF motifs that coincide with a CTCF ChIP-seq peak. CTCF binding footprints were evident at these sites for roughly half of the NOMe-seq reads (Fig. 2h). There was a wide frequency distribution, with some CTCF sites exhibiting footprints on >70% and others on <5% of reads (median: 52%). Notably, these competent CTCF sites were largely devoid of CpG methylation (3.5%), regardless of the footprint status of an individual read. In contrast, when we considered CTCF motifs that do not coincide with ChIP-seq peaks, a high proportion (70%) harbored CpG methylation. In addition to interplay with endogenous methylation, the sequencing data revealed genetic associations, including an allele-specific CTCF footprint flanked by an ~200-base region of haplotype-specific accessibility (Extended Data Fig. 5).
These results highlight interplay between CTCF and methylation, and the potential of single-molecule footprints to inform on binding kinetics, dynamic processes, and haplotype-specific chromatin states.
Pseudotime analysis of single-molecule dynamics
We next examined the dynamics of the immune loci during T-cell stimulation. In addition to annotating regulatory elements relevant to activation, we reasoned that correlations between pairs of elements could reflect functional interactions. We scanned the loci to identify open runs that correlated across the single molecule reads. An informative example is the locus encoding the costimulatory molecule CD2827,28, which we captured in contiguous 78-kb reads (Fig. 3a and Extended Data Fig. 6c). We detected 15 open run peaks in the aggregate tracks for the locus, 13 of which changed their accessibility during activation (see Methods). We identified 7 pairs of sites whose open run status correlated across single molecules. These included multiple candidate regulatory elements as well as the 3’ UTR of the CD28 gene (Fig. 3a). The accessibility changes may contribute to the downregulation of CD28 and/or the induction of proximal genes in the locus (ICOS, CTLA-4) (Extended Data Fig. 6b).
Fig. 3 |. Dynamic chromatin remodeling events ordered by pseudotime reconstruction.
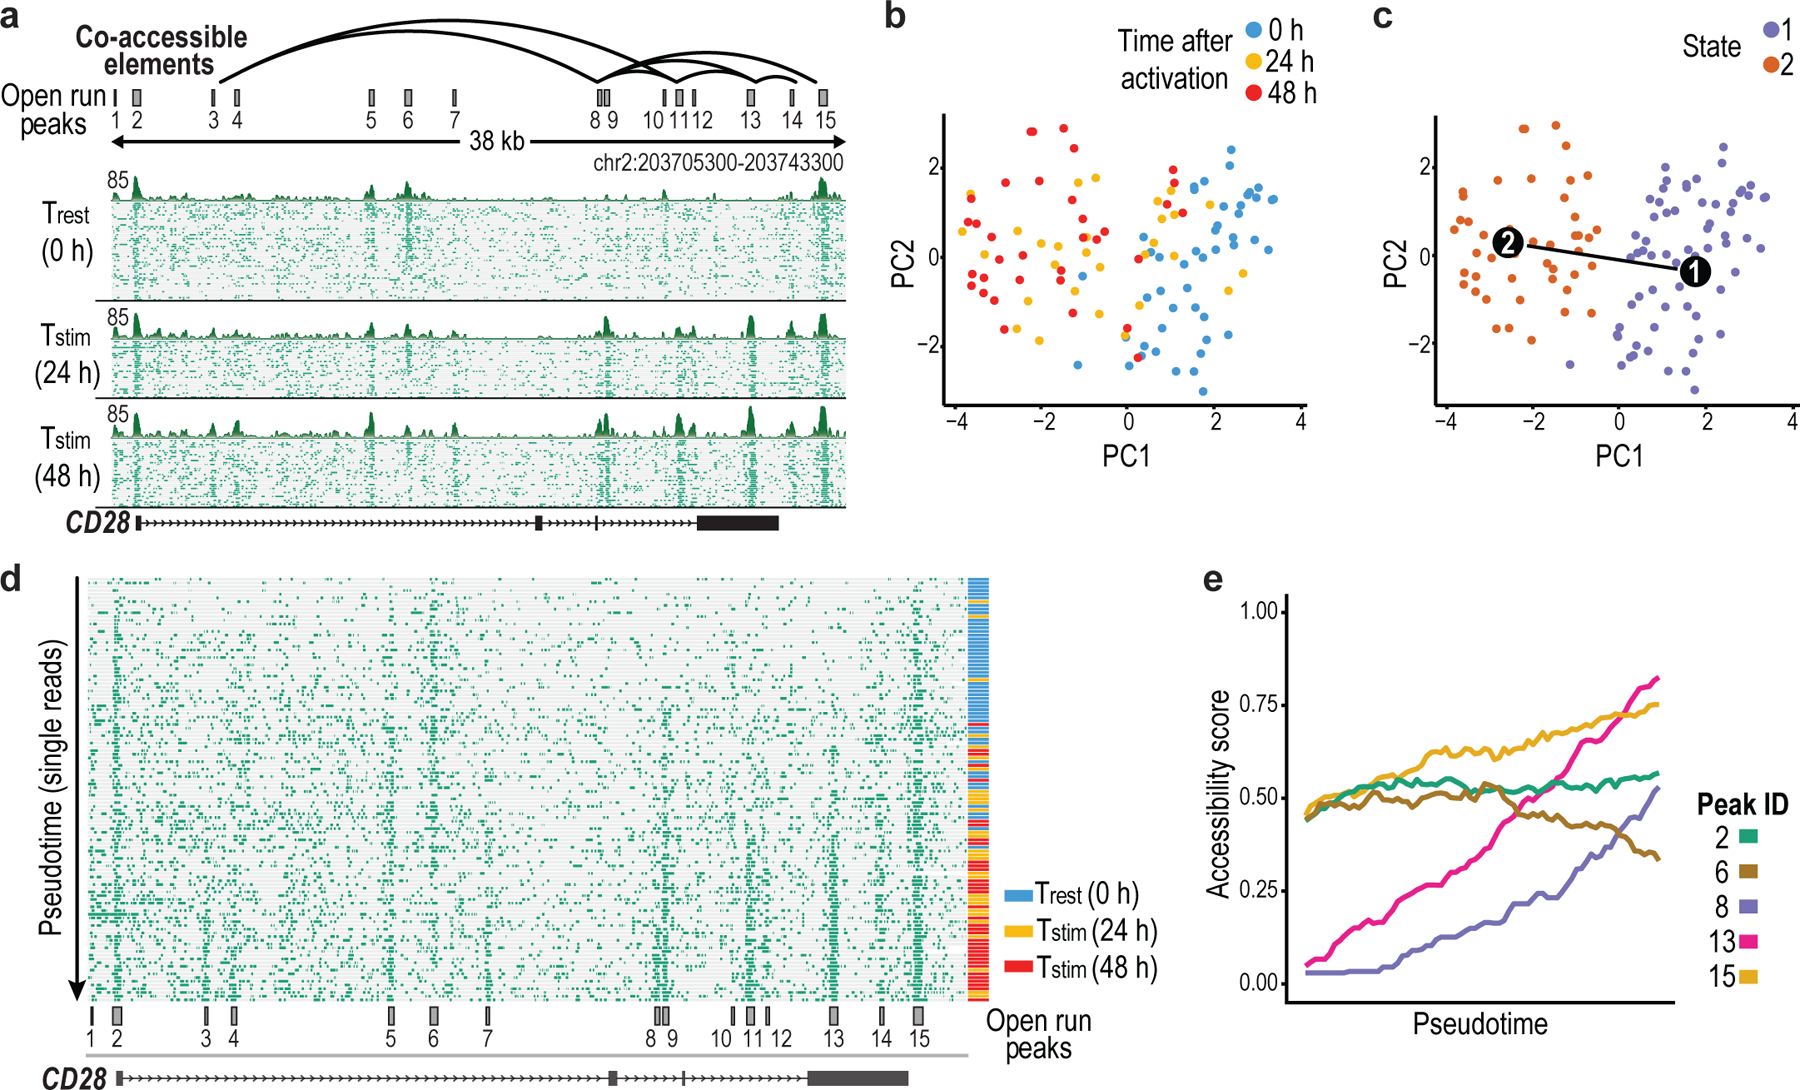
a, The CD28 locus, which flanks CTLA4 and ICOS, was captured with contiguous 78-kb NOMe-seq reads and profiled across a time course of CD4+ T-cell activation. Plot depicts a 38-kb portion of the captured locus that harbors 15 accessible elements (full target locus shown in Extended Data Fig. 6c). Open runs (green) are shown for 50 (0 h), 30 (24 h) and 34 (48 h) individual reads (rows) and for the aggregate of each timepoint (above). Correlation of the open run signal (green) in 1-kb sliding windows identified pairs of peaks with coordinated accessibility changes across the molecules (arcs). b, PCA based on open run signals of single molecules (dots) revealed a cluster of resting T cells and another containing 48 h stimulated cells. Reads from 24 h were relatively more distributed. c, PCA plot as in (b) with reads colored by cluster assignment and with a pseudotime axis determined by TSCAN. d, Plot shows 114 single molecules as in (a), but ordered by their pseudotime projection. Reads are annotated by time point (left). e, Plot depicts the accessibility of representative peaks over the pseudotime projection, illustrating their different temporal dynamics.
We also sought to leverage inter-relationships among the dynamic elements to order the successive remodeling events that accompany T-cell activation. Our time course sampled only three intervals (0 h, 24 h, 48 h) (Extended Data Fig. 6a). However, we reasoned that pseudotime reconstruction methods29–32 might enable us to order single molecules based on coordinated changes in element accessibility, under the assumption that each element undergoes a unidirectional change over the course of stimulation.
We constructed a matrix of open run signals for the accessible sites in the CD28 locus across 114 reads at 0, 24 or 48 h. We used principal component analysis (PCA) to cluster the reads by their open run patterns (Fig. 3b). We confirmed that reads from resting T cells (0 h) clustered together, while those from the 48-h time point formed a distinct cluster. Molecules from the intermediate collection (24 h) were distributed between these clusters, consistent with a unidirectional gradient change during activation (Fig. 3c, Extended Data Fig. 6a). We next adapted TSCAN29, which was originally developed to reconstruct single cell transcriptomic trajectories, to build a pseudotime trajectory of CD28 accessibility change (Fig. 3c; see Methods). The resulting ordering closely corresponded to the real time trajectory of activation (Fig. 3d). This analysis identified three elements that gain accessibility early in the pseudotime course (peaks 9, 13, 14), and five that gain accessibility late (peaks 3, 4, 8, 11, 12). Interestingly, two peaks that lose accessibility during activation do so late in the pseudotime trajectory (peaks 6, 10). The CD28 promoter (peak 2) remained stable throughout the time course, suggesting the importance of distal elements dynamics (Fig. 3e). This strategy for inferring the temporal order of regulatory element dynamics from single-molecule reads can complement other approaches such as single-cell ATAC-seq for investigating heterogeneous and asynchronous regulatory processes.
Phased epigenomic maps resolve imprinted alleles
In parent-of-origin imprinting, paternal and maternal alleles adopt distinct epigenetic configurations that cause certain genes to be expressed from one parental allele33–35. Defective imprinting underlies multiple developmental and neurodevelopmental disorders. The size and complexity of imprinted loci has hindered the study of their epigenetic regulation.
We applied our optimized procedures to enrich and sequence long reads corresponding to three prototypic imprinted loci: SNRPN, GNAS and H19/IGF2. We treated ESCs and human skeletal muscle myoblasts (HSMM) with M.CviPI to mark accessible DNA. We then used RNPs to capture the SNRPN (116 kb; ~100× coverage in ESCs, ~200× in HSMM) and the GNAS locus (95 kb; 150× in ESCs; ~215× in HSMM) for sequencing. We also captured the more expansive H19/IGF2 locus with RNPs that released three overlapping regions (73 kb, 84 kb and 74 kb; >100× in ESCs; >200× in HSMM). Alternate alleles were readily distinguished from heterozygous SNPs across the reads. We confirmed known differentially DNA methylated regions (DMRs)36 and identified other elements with allele-specific accessibility and methylation (Extended Data Fig. 7a). Paternal and maternal alleles could also be separated by clustering reads based on their methylation patterns alone, emphasizing that the epigenetic differences between alleles are consistent across single molecules (Extended Data Fig. 7b,c).
We focused on the H19/IGF2 locus, which represents a paradigm for understanding imprinting mechanisms (Fig. 4a). Classical studies have characterized an imprinting control region (ICR) upstream of H19 that is methylated on the paternal allele, but unmethylated and bound by the CTCF insulator on the maternal allele. On the paternal allele, absence of the insulator allows a downstream ‘canonical’ enhancer region to contact and activate paternal IGF226,37. On the maternal allele, the insulator shields IGF2 from this enhancer (Fig. 4a). H19 has the opposite expression pattern as its promoter is silenced on the paternal allele by methylation extending from the ICR. The H19/IGF2 locus has been most extensively studied in mouse, leaving the human locus less well understood.
Fig. 4 |. Phased epigenomic profiles deconvolve alternate H19/IGF2 alleles.

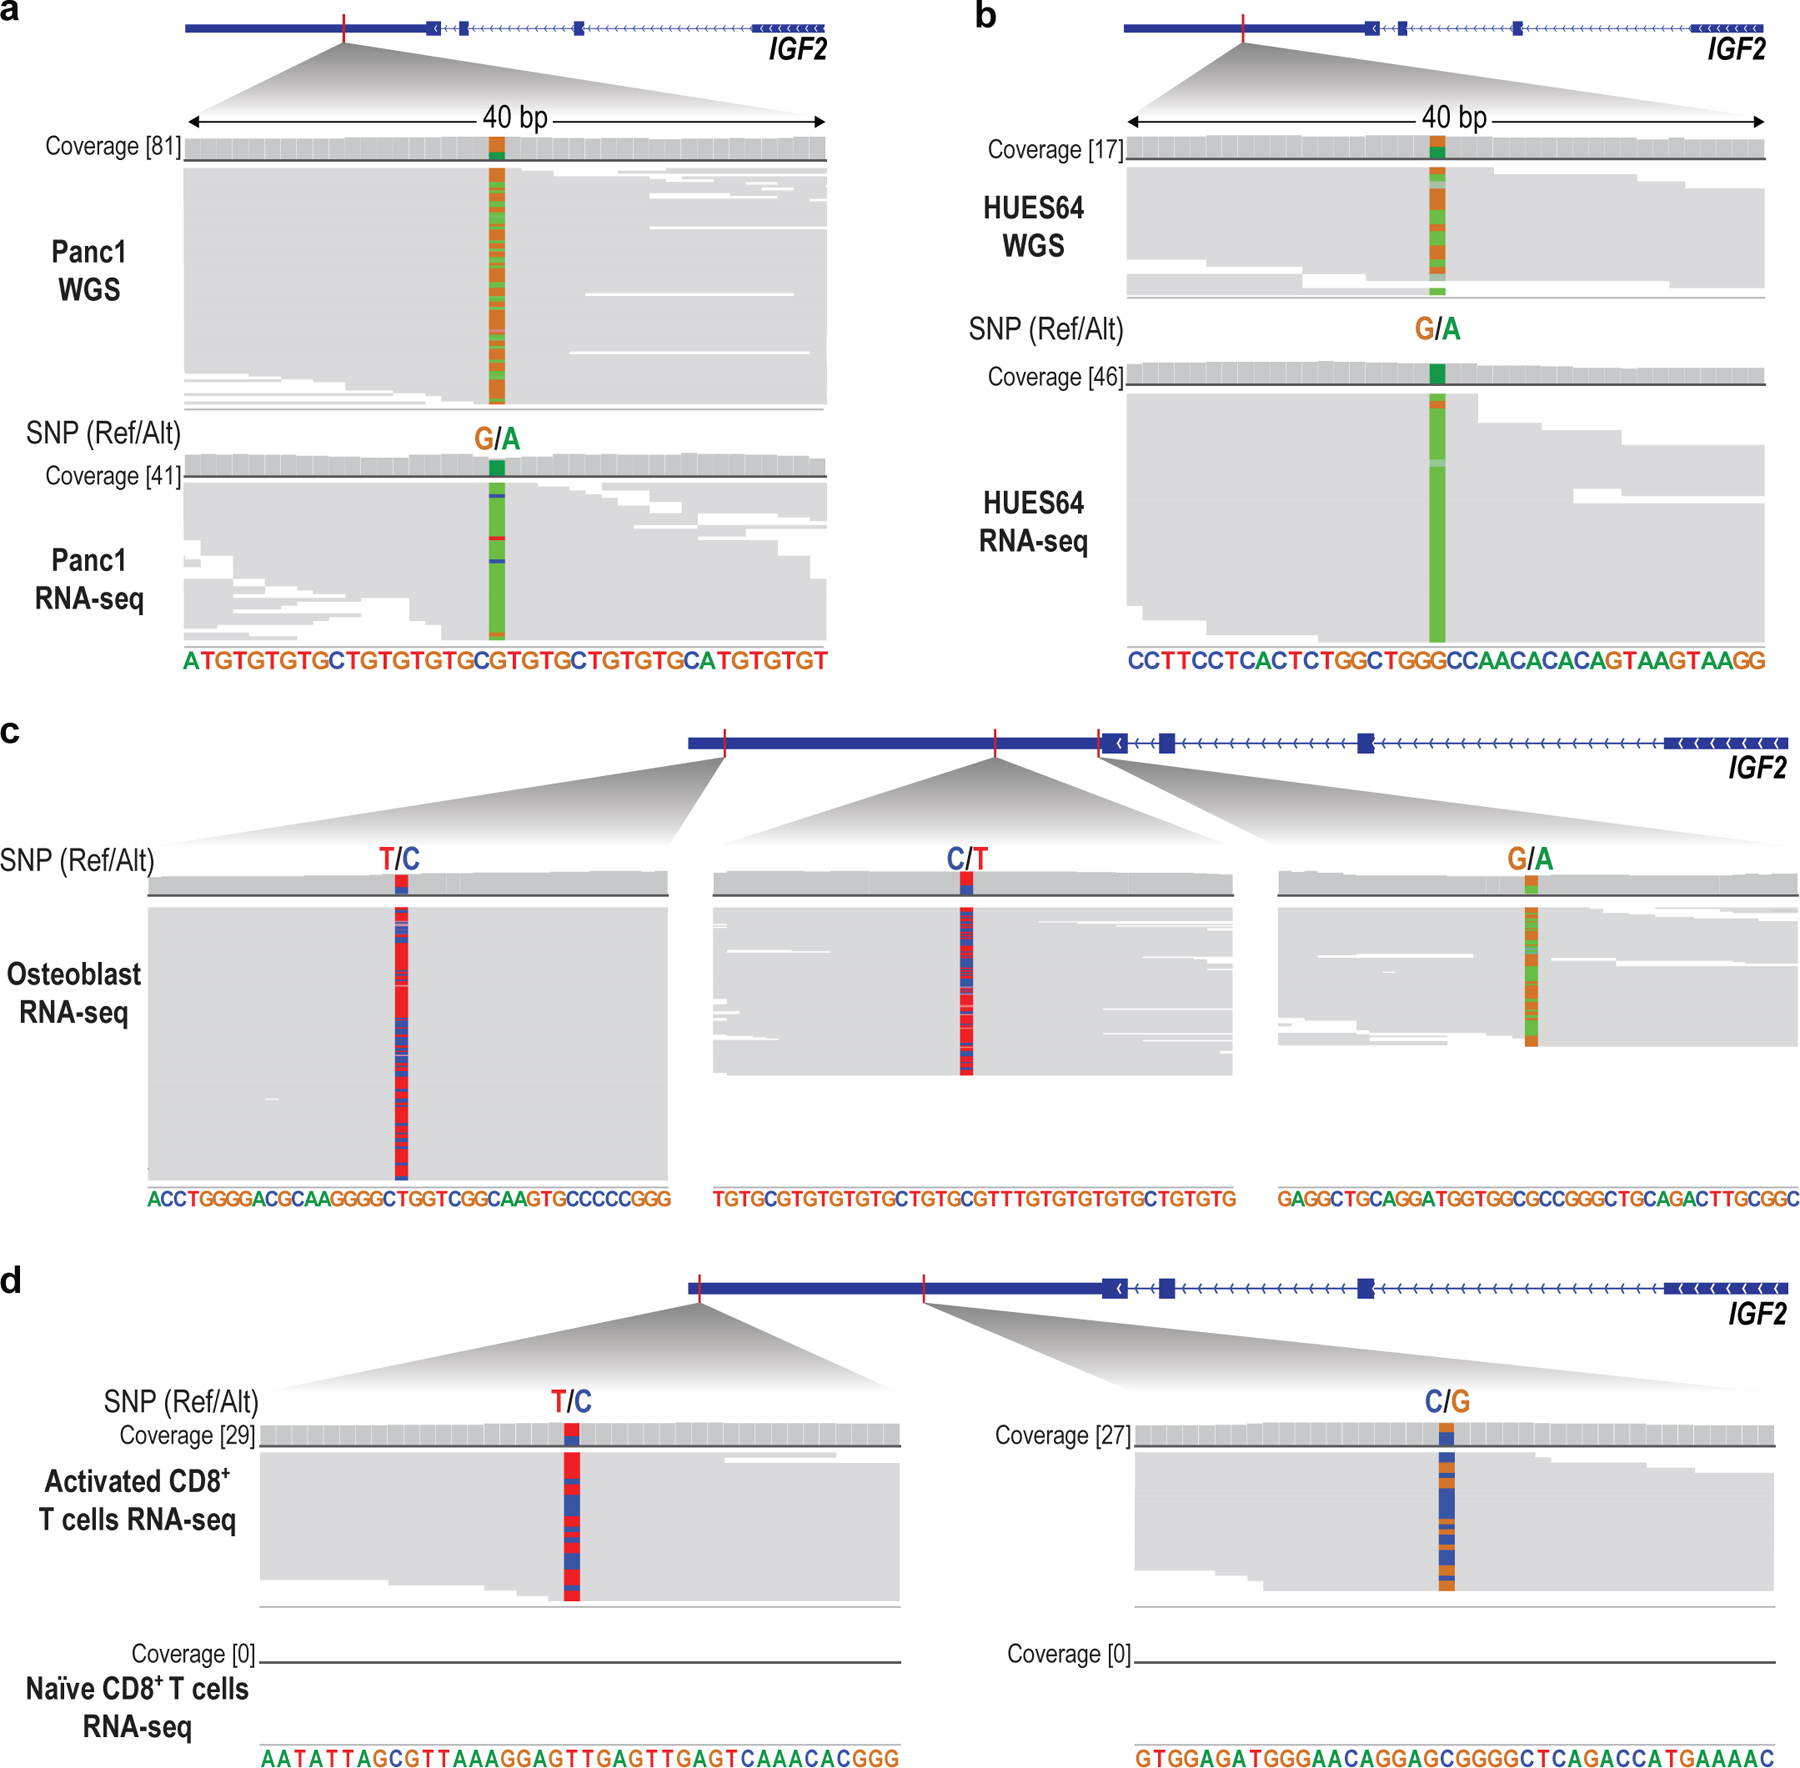
a, Schematic depicts paternal and maternal alleles of the classical imprinted locus. A canonical enhancer (purple ovals) activates the H19 non-coding RNA on the maternal chromosome (MAT) and the IGF2 growth factor gene on the paternal chromosome (PAT). The differential expression is directed by the ICR, which is bound by the CTCF insulator on the maternal allele, but methylated on the paternal allele. Active and inactive gene alleles are represented by green and grey rectangles, respectively. b, Connecting arrows highlight the positions of RNPs used to excise three overlapping regions for sequencing. NOMe-seq tracks show allele specific CpG methylation (red) and accessibility (green; open runs) in H9 ESCs and myoblasts (HSMM). ChIP-seq tracks for CTCF (ESCs) and H3K27ac (ESCs and HSMM) are also shown. In HSMM, a non-canonical enhancer (dashed box) is strongly marked by accessible chromatin on both parental alleles, and enriched for H3K27ac. c, Expanded view of the ICR shows differential methylation and accessibility on paternal and maternal alleles distinguished from long reads. Also shown are ChIP-seq tracks for CTCF and H3K27ac, LTRs (black bars) and duplicated sequences (grey bars paired by arcs). d, Expanded view shows nanopore DNA sequencing data (top) and RNA-seq data (bottom) for HSMM over a region in the last exon of IGF2 that harbors 3 heterozygous SNPs (chr11:2130822 / rs3802971; chr11:2130876 / rs57156844; chr11:2131037 / rs59196953). The nanopore data identify two SNPs specific to the maternal allele. Their presence in the RNA-seq at ~50% frequency indicates that IGF2 is expressed from both parental alleles in these primary human muscle cells. (Ref = reference; Alt = alternate).
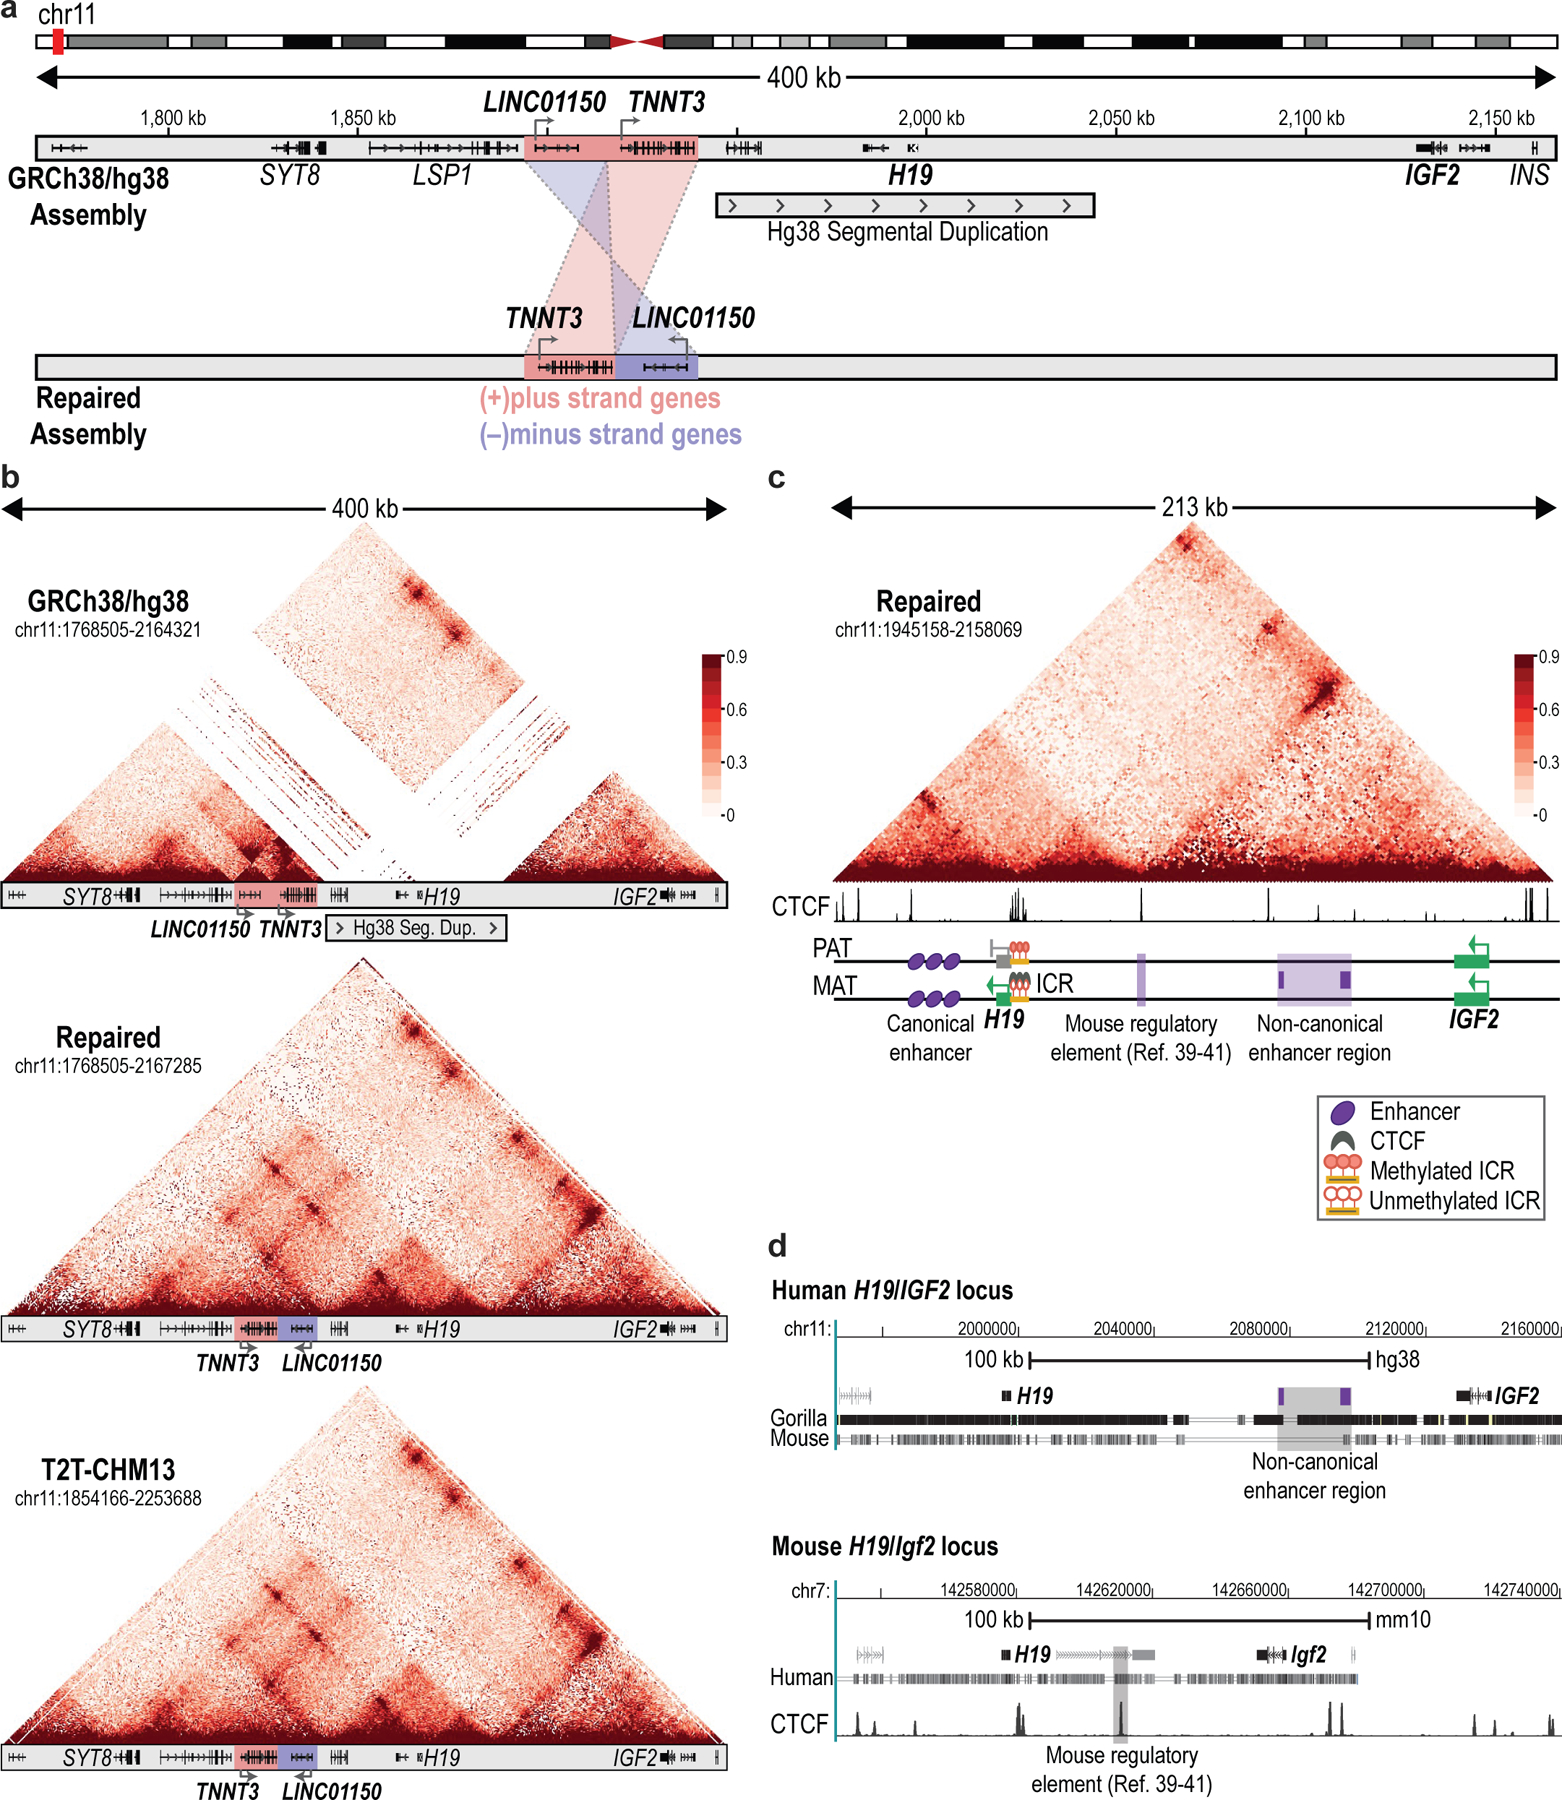
Surprisingly, our primary sequencing data for the human H19/IGF2 locus did not conform to the hg38 genome assembly. First, our reads did not include an annotated 100-kb segmental duplication. Indeed, this duplication was absent from long-read data that we generated for ESCs, K562s, GM12878, HSMM and T cells. Second, we found that a 45-kb region neighboring the canonical enhancer and containing two genes (TNNT3, LINC01150) was inverted in hg38 (Extended Data Fig. 8a). Here again, concordant data for multiple cell lines enabled us to correct the linear sequence of the locus. Our revised assembly perfectly matched an assembly recently derived from long-read sequencing data for a haploid line38 (Extended Data Fig. 8b).
We used the repaired assembly to re-evaluate micro-C chromosome conformation data for H1 ESCs. Mapping the micro-C reads onto the new assembly clarified the topological structure of the H19/IGF2 locus and revealed a CTCF anchor site located between H19 and IGF2 (~40 kb from H19) that forms a long-range contact with a region just beyond IGF2 (Extended Data Fig. 8c). Remarkably, this CTCF anchor corresponds to a sequence element previously found to be capable of activating or repressing IGF2 in mouse models, depending on developmental context39–41. The corrected assembly and phased profiles provide an opportunity to evaluate the regulatory mechanisms underlying this enigmatic element.
Primate-specific features of the H19/IGF2 ICR
We next realigned the NOMe-seq reads to our corrected assembly and assigned them to alternate alleles based on SNPs. This enabled us to phase CpG methylation and accessibility across the H19/IGF2 locus separately for the two alleles (Fig. 4b). As expected, the presumed paternal allele was highly methylated and inaccessible over the ICR, while the maternal allele was hypomethylated and accessible (Fig. 4c). This pattern was evident in ESCs and in HSMM cells isolated from an adult individual. Closer examination of individual reads revealed multiple TF footprints over the maternal (unmethylated) ICR. Motif analysis and ChIP-seq data confirmed that they correspond to 7 distinct CTCF binding sites across the human ICR (Fig. 4c). This contrasts with 4 CTCF sites in the mouse ICR42. The additional sites appear to have arisen through a short (1.7 kb) duplication in primates38.
We also noted a human-specific insertion of an LTR transposable element between the ICR and an ESC-specific enhancer (Fig. 4c). The sequencing data reveal high levels of CpG methylation over the LTR on both parental alleles. The methylated LTR may thus shield the ICR from the nearby embryonic enhancer. We speculate that these primate-specific features contribute to the stability of the alternate ICR states in long-lived species. In support, small deletions within the human ICR have been linked to clinical phenotypes42.
A non-canonical enhancer drives bi-allelic IGF2 expression
Our phased maps also revealed an uncharacterized feature of the H19/IGF2 enhancer landscape. The classical enhancer region located 5–10 kb downstream of H19 (LOC105274310, NCBI) was evident in the HSMM NOMe-seq data as an expansive interval marked by accessible runs and a paucity of endogenous DNA methylation (Fig. 4b). This ‘canonical’ enhancer is insulated by the maternal ICR such that it should only activate paternal IGF2, as described26,37.
We also noted a region between H19 and IGF2 with enhancer-like features in the HSMM NOMe-seq data, and abundant histone acetylation (H3K27ac) in HSMM. Examination of NOMe-seq reads indicated that this ‘non-canonical enhancer’ region is similarly accessible and hypomethylated on maternal and paternal alleles (Fig. 4b). In contrast to the canonical enhancer, it is much closer to IGF2 and not insulated by the maternal ICR (Extended Data Fig. 8c). We hypothesized that this non-canonical element should enforce bi-allelic expression. In support, a SNP-based analysis revealed that IGF2 is bi-allelically expressed in HSMM (Fig. 4d). In contrast, IGF2 is expressed only from the presumed paternal allele in ESCs and Panc1, both of which lacked evidence of non-canonical enhancer activity (Fig. 4b, Fig. 5a, Extended Data Fig. 9a,b).
Fig. 5 |. A non-canonical enhancer associated with bi-allelic IGF2 expression.

A, H3K27ac ChIP-seq signal for ten human cell types is shown for the H19/IGF2 locus, highlighting canonical and non-canonical enhancer regions. Expanded view of the non-canonical enhancer (below) shows H3K27ac signal over the non-canonical enhancer region in two cell types. Genetic variants in the region associated with human traits are indicated. b, Cell and tissue types over-represented among ENCODE samples with the strongest H3K27ac signal over the non-canonical enhancer. *The activated T cells group includes biosamples from different donors, activated with cytokines or by T-cell receptor stimulation. c, H3K27ac ChIP-seq signal for resting and activated CD8+ T cells is shown for the H19/IGF2 locus. d, Bar plots show IGF2 RNA expression in cells with CRISPRi targeting the IGF2 promoter, the canonical enhancer, or the non-canonical enhancer; target site indicated by yellow bar in panel a. RT-qPCR data shown as mean ± SEM from four (AG04450) and three (HSMM) independent experiments, relative to safe harbor control. e, Heatmap shows expression of T-cell marker genes and IGF2 (rows) in GTEx whole-blood samples (columns; n = 383). Samples are ordered based on a T-cell activation score defined as the mean expressions of CD8A, CD69 and GNLY. Black lines indicate 72 samples with bi-allelic IGF2 from a total of 383 donors with heterozygous SNPs over IGF2 (Supplementary Table 3; see Methods). f, Schematic proposes a revised model for the H19/IGF2 locus. It posits that IGF2 is regulated by both a canonical and a non-canonical enhancer, with the former driving paternal IGF2 expression as classically described, and the latter driving bi-allelic IGF2 expression in certain proliferative tissues and cells. Although the non-canonical enhancer does not disrupt H19 imprinting, it could potentially influence expression levels of maternal H19.
We considered whether this non-canonical enhancer correlates with bi-allelic IGF2 in other contexts. We collated H3K27ac ChIP-seq data for ~200 cell and tissue types from ENCODE (see Methods). We identified multiple samples with H3K27ac signal in the ~20-kb non-canonical enhancer region (Fig. 5a and Supplementary Table 2). Closer inspection of the 40 samples with the strongest H3K27ac signal in the region revealed several prostate and epithelial cell lines, connective tissues and T cells (Fig. 5b). We therefore asked whether non-canonical enhancer activity was associated with bi-allelic IGF2 in these samples. We indeed confirmed bi-allelic expression in many of these samples. In contrast, when we examined 40 cell and tissue types that lacked H3K27ac signal in this region, we detected bi-allelic IGF2 expression in just one sample (Supplementary Table 2).
In addition to its bias for certain lineages, the non-canonical enhancer can switch between related cell states. It is largely unmarked in resting CD8+ T cells, but gains strong H3K27ac upon activation by cytokines or T-cell receptor stimulation (antiCD3/CD28). Consistent with our model, enhancer activation is accompanied by induction of bi-allelic IGF2 in these in vitro stimulated cells (Fig. 5c, Extended Data Fig. 9d).
To directly test the impact of the non-canonical enhancer on IGF2 expression, we used CRISPRi to suppress it in HSMM and AG04450 fibroblasts. We designed sgRNAs to target dCas9-KRAB to the peak of H3K27ac (right side of enhancer region; Fig. 5a). Lentiviral infection with dCas9-KRAB and sgRNA reduced IGF2 expression by ~75% in HSMM and ~90% in AG04450 (Fig. 5d). This strongly supports our hypothesis that the non-canonical enhancer activates bi-allelic IGF2 expression. Interestingly, when we targeted the canonical enhancer by CRISPRi, IGF2 expression was reduced by ~50% in HSMM and 30% in AG04450, consistent with suppression of the single (paternal) allele on which the canonical element contacts IGF2.
Further support for the physiologic importance of the non-canonical enhancer comes from its conservation and disease associations. The element resides in a genomic interval that is specific to humans and certain primates (Extended Data Fig. 8d), which explains why it eluded classical mouse studies. Its functional significance is nonetheless supported by the association of genetic variants in the enhancer with multiple traits, including birth weight, blood pressure, renal function and IGF1 levels (Fig. 5a). These data strongly suggest that the element represents a primate-specific adaptation that impacts diverse physiologic processes in humans.
Bi-allelic IGF2 expression in human GTEx tissues
Finally, we rigorously evaluated bi-allelic IGF2 expression across human tissues and individuals using gold-standard GTEx data43. We used genotyping and RNA-seq data to collate 9,596 samples spanning 51 different tissue types for which IGF2 contained informative (heterozygous) SNPs and was expressed. We found that 699 of these samples definitively expressed both IGF2 alleles (P value 0.01; see Methods). The remainder had either mono-allelic IGF2 (7,819 samples) or were undetermined (1,078) due to inconsistent SNP status within the same donor. Remarkably, a full 53% of samples with bi-allelic IGF2 were blood, esophageal tissue, liver, pituitary, cerebellum or fibroblasts (Extended Data Fig. 10 and Supplementary Table 3). The non-canonical enhancer is strongly marked by H3K27ac in esophageal tissue and fibroblasts, consistent with the bi-allelic IGF2 expression. Although we are unaware of H3K27ac profiles for pituitary, Human Cell Atlas data confirm chromatin accessibility over the non-canonical enhancer44. The liver result reflects a distinct isoform from a distant transcriptional start site.
Further analysis suggests that the bi-allelic IGF2 signal in blood comes from activated T cells. Blood samples with bi-allelic IGF2 show higher expression of T-cell lineage and activation markers, indicating high proportions of such cells (Fig. 5e and Extended Data Fig. 10b). This extends our finding that in vitro activated T cells gain the non-canonical enhancer and bi-allelic IGF2 by demonstrating bi-allelic expression for in vivo activated T cells from multiple donors.
Discussion
Rapid advances in sequencing technologies are providing exciting opportunities to refine genome assemblies, parse repetitive loci and phase epigenomes. Here we presented an approach for reading chromatin accessibility, DNA methylation and TF footprints across ultra-long single molecules. Our method combines GpC methyltransferase treatment in situ, optimized preparation of HMW gDNA, enrichment of target loci by RNP cleavage, and nanopore sequencing. We markedly extend the state-of-the-art11–15 by sequencing modified DNA molecules in excess of 100 kb that correspond to developmental, immune and imprinted loci. Our analyses provide insights into coordinate enhancer regulation during T-cell activation and uncover novel features of a classical imprinted locus.
The long-read data are ideally suited for imprinted loci. These loci tend to be large, contain diverse regulatory elements, and adopt radically different chromatin configurations on alternate alleles. Our investigation of the H19/IGF2 locus yielded several unexpected insights. First, sequencing reads spanning the locus enabled us to correct the current genome assembly. Second, the epigenomic profiles provided exquisite detail regarding human-specific features of the locus. We precisely chart seven CTCF footprints on the maternal ICR and identify a human-specific LTR that may shield the ICR from adjacent active chromatin. We speculate that these human/primate-specific features confer robustness to the alternate ICR states in early development and stability in longer-lived species. We note that prior studies have linked microdeletions within this expanded human ICR to Beckwith-Wiedemann syndrome (BWS) and Silver-Russell syndrome (SRS)42.
We also identify a ‘non-canonical’ enhancer that drives bi-allelic IGF2 in specific contexts. The long-read NOMe-seq data clearly showed that this element is accessible and CpG hypomethylated on maternal and paternal alleles, indicating that it is bi-allelic. Given its location on the same side of the ICR as IGF2, it should activate both IGF2 alleles in these contexts. Indeed, enhancer acetylation was accompanied by bi-allelic IGF2 expression in multiple experimental models, including HSMM, prostate and epithelial cell lines, fibroblasts and activated T cells. Inactivation of the element by CRISPRi profoundly reduced IGF2 expression in HSMM and fibroblasts. Finally, we rigorously validated bi-allelic IGF2 expression in specific human tissues and immune cells using gold-standard GTEx data.
The identification of a bi-allelic IGF2 enhancer in the H19/IGF2 locus was particularly surprising given the extent to which this textbook locus has been studied26,35,37. Its location within a primate-specific genomic interval explains why this element eluded classical mouse studies. Flawed genome builds, an inability to phase alternate alleles and the absence of the element from mainstay ESC models presumably hindered prior human studies. Nonetheless, its physiologic significance is supported by multiple genetic variants associated with human traits. We speculate that the non-canonical enhancer represents an evolutionary adaptation that leverages IGF2 for context-specific proliferation (Fig. 5).
In conclusion, we demonstrate the exciting potential of ultra-long read epigenomic data to annotate and inter-relate immune regulatory elements, to parse complex imprinted loci, and to reveal insights into IGF2 regulation. Our methods should facilitate future studies of many other loci whose size, repetitive nature and/or allele-specific regulation hinder contemporary tools.
Methods
Ethics.
All studies on human cell lines were given ethical approval by the Institutional Review Board of DFCI protocol #21-394. All donors of primary cells used in this study had signed written informed consent to provide their cells.
Human cell culture.
GM12878 cells were obtained from Coriell (GM12878) and grown in RPMI 1640 medium supplemented with 2 mM L-glutamine, 15% fetal bovine serum (FBS) and 1% penicillin-streptomycin. K562 cells were obtained from ATCC (CRL-3343) and grown in RPMI 1640 medium supplemented with 2 mM L-glutamine, 10% FBS and 1% penicillin-streptomycin. 293FT cells were obtained from Invitrogen (R70007) and cultured in complete medium consisting of DMEM (Gibco, 10569044) supplemented with 10% fetal bovine serum (Gemcell, 100–500) and 10 U/ml penicillin-streptomycin (Gibco). Cryopreserved H9 ESCs were thawed in RPMI 1640 medium supplemented with 2 mM L-glutamine and 50% FBS, counted and resuspended in PBS. 1 million cells were used for NOMe-seq and 100,000 cells for RNA-seq. Cryopreserved human skeletal muscle myoblast (HSMM) cells isolated from a normal donor were obtained from Lonza (CC-2580; 22Y, male). Cells were thawed quickly and added to pre-warmed SkGMTM-2 BulletKit Medium (Lonza). Growth medium was changed the next day and cells were grown for 3 population doublings before harvest. 2 million cells were used for NOMe-seq and 100,000 cells for RNA-seq.
Activation of primary human CD4+ T cells.
Cryopreserved CD4+ T cells isolated from healthy donors were obtained from AllCells (LP, CR, CD4+, NS, 25M; donor #1: 54Y, male; donor #2: 22Y, male). On the day of activation, cells were thawed in RPMI 1640 medium supplemented with 2 mM L-glutamine and 50% FBS, counted and resuspended in TexMACS medium (Miltenyi Biotec) supplemented with 20 IU/ml human Interleukin-2 (IL-2) and 1% penicillin-streptomycin. Cells were plated at 1 million cells per well in a 48-well plate. Cells were either left untreated or stimulated with 10 μl T Cell TransAct™, human (Miltenyi Biotec, 130-111-160) via CD3 and CD28 for 24 or 48 h. Treated and non-treated CD4+ T cells were analyzed by flow cytometry. Cells were collected and washed in PBS with 2% FBS before antibody staining. Cells were stained for 15 minutes in the dark with FITC anti-human CD25 (Biolegend, 356105) and APC anti-human CD69 (Biolegend, 310909) at 1:100 dilution and 5 μl/million cells, washed with PBS 2% FBS, resuspended in PBS 2% FBS, and analyzed on a Sony SH800 sorter. Results were then analyzed using FlowJo software (FlowJo v10.6.0) (Extended Data Fig. 6a). After confirming T cell state, cells from each time point were collected for ATAC-seq (50,000 cells), RNA-seq (100,000 cells) and NOMe-seq (1 million cells).
In situ GpC methylation of accessible chromatin.
1 million cells were harvested by centrifuging the cell suspension for 5 min at 300× g. Cells were washed once with ice-cold PBS, re-suspended in 1 ml ice-cold lysis buffer (10 mM Tris-HCl pH 7.4, 10 mM NaCl, 0.5 mM spermidine, 1.5 mM MgCl2, 0.1 mM EDTA, 0.25% IGEPAL CA-630 (Sigma)) and incubated for 3 min on ice. The cell suspension was then pipetted up and down 10 times with a 1 ml wide bore tip. Success of lysis was confirmed by inspection under a light microscope. Nuclei were collected by centrifuging the cell suspension for 5 min at 800× g at 4 °C and washed with 1 ml ice-cold nuclei wash buffer (10 mM Tris-HCl pH 7.4, 50 mM NaCl, 0.5 mM spermidine, 1.5 mM MgCl2, 0.1 mM EDTA). Nuclei were resuspended in 564 μl 1× GpC MTase reaction buffer (NEB, B0227) and equilibrated to 37 °C. Nuclei were subjected to a GpC methylation labeling reaction by adding 300 μl 1 M sucrose, 34 μl 10× GpC MTase reaction buffer, 3 μl 32 mM S-Adenosylmethionine (SAM) (NEB, B9003), and 100 μl GpC methyltransferase (M.CviPI) (NEB, M0227L). The suspension was carefully mixed and incubated for 6 min at 37 °C followed by a boost with an additional 50 μl M.CviPI and 3 μl SAM for 6 min. The reaction was stopped by adding 1,053 μl of 2× stop buffer (20 mM Tris-HCl pH 7.4, 600 mM NaCl, 10 mM EDTA, 1% SDS). For experiments where more than 1 million cells were used, buffers and reagents were scaled up accordingly.
Extraction of high molecular weight (HMW) genomic (g)DNA.
For HMW gDNA extraction, proteinase K was added to the GpC methylation reaction (final concentration 200 μg/ml), and the solution was incubated for 4 hours at 56 °C. The sample was then cooled down to 37 °C and treated with RNase A (100 μg/ml) for 30 minutes at 37 °C followed by a final proteinase K treatment (200 μg/ml) for 30 minutes at 37 °C. A 1× volume of SPRI bead solution (PEG 8000 20%, NaCl 2.5 M) was added to the mixture, followed by addition of 10% of the total sample volume of AMPure XP beads (Beckman Coulter), and incubated for 10 minutes at room temperature. Beads were washed twice with 80% ethanol and the DNA was eluted in 50 μl of nuclease-free water 3 times for 30 minutes each. Partial incubation was done at 37 °C with thorough mixing by flicking the tube. The eluted DNA was quantified using a Qubit fluorometer and a Nanodrop. A reaction with 1 million cells typically yields between 6 and 10 μg of DNA. During DNA extraction, and in all following steps, samples were handled with care using wide bore pipette tips to avoid excessive fragmentation of DNA.
sgRNA synthesis and Cas9 ribonucleoprotein (RNP) assembly.
Single stranded CRISPR/Cas9 DNA oligonucleotides (20 nt) were designed using the ChopChop v3 designer tool (chopchop.rc.fas.harvard.edu) and purchased from IDT (Integrated DNA Technologies) to be used in the EnGen sgRNA Synthesis Kit (NEB, E3322S). After synthesis of the double-stranded DNA (dsDNA) template and in vitro transcription following manufacturer’s instructions (NEB, E3322S), single-guide RNAs (sgRNAs) were purified with the Agencourt RNAClean XP system (Beckman Coulter). Concentration of sgRNAs was measured using the Qubit RNA HS Assay Kit (Thermo Fisher, Q32852). sgRNAs were diluted to 300 nM and RNA integrity was verified using the High Sensitivity RNA ScreenTape Assay (4200 TapeStation system, Agilent Technologies). sgRNAs were used immediately or stored at −80 °C for later use. RNP complexes were assembled individually in a 96-well plate by combining 8 μl of nuclease-free water, 1.5 μl NEBuffer r3.1 (NEB), 3 μl of 300 nM sgRNA and 1 μl Cas9 Nuclease, Streptococcus pyogenes (NEB, M0386) followed by a 20 min incubation at 25 °C. The different RNP complexes were then pooled in a single tube, kept at 4 °C and used within 3 hours. We engineered a total of 254 different RNP complexes that targeted 127 flanking regions of 64 target loci, which range from 50 to 116 kb in length (Supplementary Table 1).
CRISPR/Cas9 cleavage (DNA dephosphorylation and in vitro digestion).
Per experiment, 6–12 μg of HMW gDNA (140 μl) were dephosphorylated with 10 μl rSAP (NEB, M0371S) and 16 μl 10× rCutSmart buffer (NEB, B6004S) for 30 min at 37 °C, then heat inactivated at 65 °C for 5 min. The DNA was then purified using 0.5× volume of PacBio AMPure PB beads (Pacific Biosciences, 100-265-900) following manufacturer’s instructions, with some modifications. In brief, 80 μl of AMPure PB beads were added to the dephosphorylation reaction, followed by a 15 min incubation at room temperature and magnetic separation for 10 min. Beads were washed twice with 80% ethanol and the DNA was eluted in 30 μl of nuclease-free water 3 times for 30 minutes each. Partial incubation was done at 37 °C with thorough mixing by flicking the tube. The eluted DNA was quantified using a Qubit fluorometer and a Nanodrop. The dephosphorylated DNA sample was then combined with the pool of RNP complexes in a 1:9 ratio (e.g. when using 96 RNP complexes, 1296 μl RNP pool was added to 144 μl of DNA). The reaction was incubated for 30 min at 37 °C to enable Cas9 cleavage. After the digestion, Cas9 was inactivated by adding 1/25th volume of 20 mg/ml Proteinase K and incubating at 55 °C for 15 min. The cleaved DNA was subsequently purified using a 0.5× AMPure PB purification following the same procedure above but with each elution in 36 μl nuclease-free water.
Library preparation and nanopore sequencing.
Cleaved and purified DNA was split into 3 tubes with 35 μl each and mixed with 4 μl 10× NEBNext dA-Tailing Reaction Buffer and 3 μl Klenow Fragment (NEB, E6053). Reactions were incubated for 30 min at 37 °C and immediately subjected to nanopore adapter ligation. 38 μl of Master Mix (20 μl Ligation Buffer (LNB; ONT, SQK-LSK109), 3 μl of nuclease-free water, 10 μl NEBNext Quick T4 DNA Ligase (NEB, E6056), and 5 μl of Adapter Mix X (AMX; ONT, SQK-LSK109)) were added to each reaction, gently mixed by flicking the tube and incubated for 10 min at room temperature. Once completed, the ligations were diluted with 1 volume (80 μl) of 1× TE buffer (pH 8.0). The adapted DNA was then purified using a 0.3× AMPure PB purification following the same procedure above but with the exception that washing was performed with 250 μl Long Fragment Buffer (LFB; ONT, SQK-LSK109) and a single elution with 15 μl Elution Buffer (EB; ONT, SQK-LSK109). Each library aliquot yielded 1–3 μg of DNA (quantified by Qubit fluorometer). Immediately before sequencing, 12 μl of adapted and purified DNA were combined with 30 μl Sequencing Buffer (SQB; ONT, SQK-LSK109) and 15 μl Loading Beads (LB; ONT, SQK-LSK109). Libraries were sequenced for 15 hours and flow cells were washed (ONT, WSH004) between runs. To maximize sequencing output, the 3 library aliquots were sequenced subsequently of each other using a single MinION flow cell (ONT, R9.4.1).
Nanopore data processing (base calling, alignment, methylation analysis).
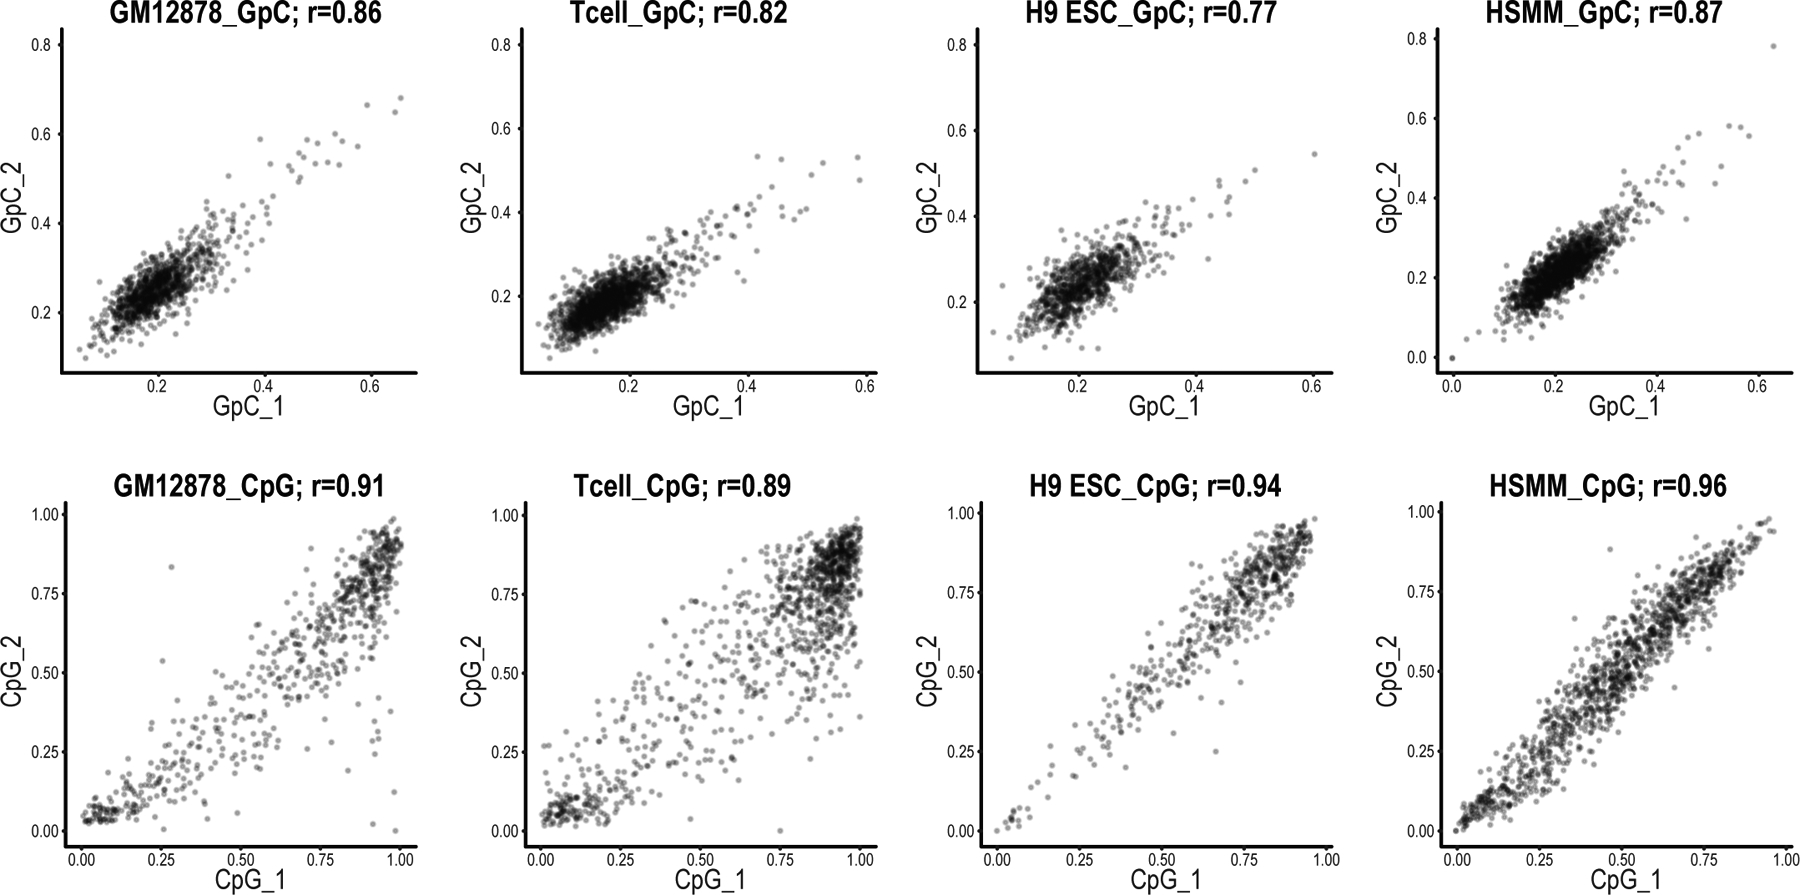
Base calling was performed on the raw FAST5 files with Guppy (v3.0.3 or v5.0.11, ONT), using a configuration file for high accuracy DNA base calling on an R9.4.1 pore at 450 bases per second. The resulting reads were then mapped to the hg38 human reference genome without alternative contigs using minimap2 v2.11 with default settings for aligning Nanopore reads (-x map-ont). Reads that mapped with a quality score of less than 50 were then filtered out using samtools v1.7. CpG and GpC methylation were simultaneously called on the remaining reads using nanopolish v.0.11.1. The percent of full-length reads was determined from the percentage of fragments in each locus that cover at least 98% of the targeted region. Average coverage was computed by summing the lengths of all reads in the locus and dividing by the total number of base pairs within the locus. Background coverage was computed by summing the lengths of all off-target reads and dividing by the total length of the genome minus the total length of the targeted loci. Fold enrichment over background was computed by dividing the average coverage for each locus by the background coverage for that experiment. Average CpG methylation was calculated for each group of CpGs which did not contain any GCGs. Then the methylation frequencies obtained from ENCODE accession ENCFF835NTC (WGBS GM12878) were compared pairwise with the average methylation. We examined the reproducibility of endogenous (CpG) and exogenous (GpC) methylation by comparing aggregate methylation levels in 250 bp windows between biological replicates. Only windows which contained at least two cytosines of interest and greater than 20-fold coverage in both replicates were used. Pearson correlation was then computed on the average methylation values (Extended Data Fig. 1).
Visualization of epigenetic marks on single nanopore reads.
In order to visualize the methylation patterns of the reads with IGV v2.12.2, we modified the individual reads in the alignment (BAM) files. All cytosines which were called as unmethylated were converted to thymine in order to simulate bisulfite conversion. This was achieved using code adapted from the Timp Lab’s nanopore-methylation-utilities (https://github.com/timplab/nanopore-methylation-utilities). Once these converted files were loaded in IGV, we were then able to visualize the methylation using IGV’s bisulfite mode. TDF tracks showing aggregated CpG methylation levels were generated with igvtools v2.4.16.
Read Filtering.
Nanopore reads with overall methylation less than 2% were considered to be unmethylated by the methyltransferase and therefore excluded. In addition, individual reads were scored based on their deviation from the mean bulk signal. Reads with average squared deviation greater than 0.3 across all covered GpC sites were also excluded as outliers.
Open and short-protected runs.
All further analysis of methylation data was performed using R v3.6. Nanopore reads were segmented into regions of methylated or unmethylated runs based on the methylation of cytosines in a GCH context sharing the same methylation status. For about 7% of GpCs, methylation state could not be definitively called by nanopolish13. The methylation status of ambiguous cytosines, such as those with indeterminate methylation or those in a GCG context, were imputed based on the adjacent cytosines. The start and end points of a run were determined by the midpoint between the first or last methylated GpC and nearest unmethylated GpC. Methylated runs shorter than 80 bp and flanked by unmethylated runs longer than 80 bp were deemed to be linker DNA. “Open runs” correspond to methylated runs of GpCs without these “linker” runs, i.e. that were either longer than 80 bp or were not flanked on both sides by unmethylated runs longer than 80 bp. “Short-protected runs correspond to unmethylated runs of GpCs shorter than 80 bp. These cutoffs were chosen based on the distribution of run length (see Extended Data Fig. 3a).
PCA and Pseudotime Analysis.
Principal component analysis was performed using a matrix of the open run signal in all regions of interest (accessibility peaks or DMRs). Once the loadings are calculated, the reads incompletely spanning the regions of interest (with zeros substituted for missing GpCs) may be mapped onto the PC space for visualization and clustering. Pseudotime analysis was performed using the TSCAN library in R in order to infer the trajectory of T-cell activation. The same matrix is used as input to the “exprmclust” function to perform clustering with default parameters. The ordering from the results was extracted with the “TSCANorder” function and used to visualize the reads and assess the dynamics of accessibility within the loci.
Peak Calling.
To call peaks from open run signal tracks, the signal was first averaged and smoothed across all reads. Candidate peaks were nominated in regions at least two standard deviations above the mean signal. These were subsequently refined to exclude small regions and merge together near adjacent regions. Matching control peaks were called by choosing random regions which were outside of the peaks. For each locus, the number of control peaks and the size distribution of the control peaks were matched to the number of peaks and the size distribution of the peaks within that locus. For the short protected run signal, a slightly modified process was used. Due to the sharpness of the short-protected run signal and the low background, peaks were called without smoothing and candidate peaks required a higher threshold of 4 standard deviations above double the mean signal.
Transcription start site metaplots.
Transcription start sites (TSSs) used in the metaplots were derived from the list of all known RefSeq v39 transcripts in hg38. Open run and CpG methylation signals were extracted from a 4-kb window centered around each covered TSS. Genes on the reverse strand were reversed to have consistent directionality. Signals were subsequently smoothed using a rolling average with a 300-bp window.
Scatterplot of methylation versus accessibility at promoters.
To generate scatterplots comparing accessibility and DNA methylation for different genes, promoter annotations were downloaded from Ensembl Regulatory Build (release 101). Promoters within the enriched loci were then overlapped with called open run peaks. The CpG methylation signal and the open run signal were then averaged for each of the peaks and weighted by the relative sizes of the peaks. If no peaks were called, then CpG methylation signal and open run signal were averaged over the entire promoter region.
Transcription factor binding analysis.
Potential TF binding sites were identified by calling peaks with the short-protected run signal. These peaks were overlapped with known TF motifs, using the motif track provided by HOMER v4.11.1 (http://homer.ucsd.edu/homer/data/motifs/homer.KnownMotifs.hg38.191020.bed.gz). Experimental verification of binding came examining tracks and peak calls in ChIP-seq experiments from ENCODE for the corresponding TF and cell type of interest.
SNP Detection and haplotype assignment.
Single-nucleotide polymorphisms were called using nanopolish v.0.13.2 with the following flags: -x 5000 -p 2 -q cpg,gpc (consider up to 5,000 haplotype combinations, assume diploid, and methylation aware). bcftools v1.15.1 was used to exclude SNPs with a Strand Odds Ratio greater than 3 to ignore variants with a high strand bias. Finally, WhatsHap v.0.18 was used to phase resulting variants and to assign aligned reads to haplotypes.
De novo locus assembly and Micro-C analysis.
In order to reassemble the genome, we pooled nanopore reads from GM12878, K562, ESCs, and HSMM. Specifically, we only used reads that aligned within this region in the hg38 reference genome: chr11:1696314-2276795. These long reads were combined into a single fastq as input to NECAT v0.0.1 with default configurations where they were corrected, assembled and bridged to generate a consensus sequence. We replaced the previously specified region in hg38 with this new sequence to generate a “repaired” assembly. Micro-C data were realigned to this repaired assembly and contact maps were generated as described in Krietenstein et al. 202045.
RNA-seq and analysis of gene expression.
For RNA-seq studies, total RNA was isolated using the RNeasy Plus Micro Kit (Qiagen, 74034) according to the manufacturer’s protocol. Poly(A)-enriched sequencing libraries were then constructed with the KAPA mRNA HyperPrep Kit (KAPABiosystems, KK8540) (HSMM cells) or using magnetic oligo(dT)-beads (Life Technologies) and then ligated to RNA adaptors for sequencing as previously described46 (T cells). Libraries were sequenced as 75-base paired-end reads on an Illumina NextSeq500 instrument. RNA-seq reads were aligned to the GRCh38 genome by HISAT2 v2.0.5 with default parameters. All unmapped reads were removed. The gene expression level (FPKM) was calculated by StringTie v1.3.3b based on the hg38 gencode annotation database (V22).
Assessment of allelic expression.
To identify cell and tissue types with mono- or bi-allelic expression of IGF2, RNA-seq data were downloaded from the ENCODE catalog and The Cancer Genome Atlas (TCGA) (Supplementary Table 2). The mapped reads were processed with bcftools-mpileup and bcftools-call to identify heterozygous SNP and its allele frequency. Segments of bases that are enriched for sequencing error or are within highly repetitive regions were excluded from the analysis. Heterozygous SNPs were identified by requiring at least 10 reads of coverage. The significance of allele bias of heterozygous SNPs was then assessed via the binomial test. Biosamples for which RNA-seq data revealed heterozygous SNPs with allelic bias P value more than 0.01 were considered to express IGF2 from both alleles. Based on our high coverage DNA long-read data for H9 ESCs, we found that this cell line does not have heterozygous SNPs over the IGF2 gene, so that allelic expression cannot be determined using RNA-seq. However, we were able to examine other human ESCs and confirmed that IGF2 was expressed only from the presumed paternal allele with the methylated DMR (Extended Data Fig. 9b).
ATAC-seq and identification of chromatin accessible sites.
Cells were incubated with 42.5 μl Transposition buffer (30 mM Tris acetate Buffer, 60 mM Potassium acetate solution, 10 mM Magnesium acetate solution, 0.25% NP-40 solution, 16% DMF and 1× Proteinase Inhibitors) for 10 min at room temperature. Nuclei were then tagmented with 2.5 μl Tn5 transposase (Illumina, TDE1) for 30 min at 37 °C and libraries were constructed as previously described47. Libraries were sequenced as 75-base paired-end reads on an Illumina NextSeq500 instrument. ATAC-seq reads were first trimmed by Trim Galore (v0.4.5) to remove adaptor sequences. The trimmed reads were aligned to hg38 by Bowtie (v2.2.2) with the parameters: -N 1 -L 25 -X 2000 –no-mixed – no-discordant. All unmapped reads and PCR duplicates were removed. Non-uniquely mapped reads were assigned to the position with the best matched score.
CRISPRi experiments.
Prior to cloning CRISPRi constructs, we compared FPKM values for all detected IGF2 transcript isoforms in ENCODE RNA-seq data for multiple cell types. We found that one transcript variant accounted for a large majority of IGF2 expression in both HSMM and AG04450 cells (NM_001291861.3). We therefore designed sgRNAs to target CRISPRi to the promoter of this specific transcript. Guide RNA (sgRNA) sequences are listed in Supplementary Table 4. Cloned sgRNAs were generated as detailed previously48. Briefly, DNA oligonucleotides were annealed into double stranded fragments with compatible overhangs and ligated into BsmBI sites into CRISPRi+guide puro (Broad GPP, pXPR_066) vector backbone. TransIT-LT1 Transfection Reagent (Mirus, MIR 2300) was used to deliver plasmids into 293FT cells with the following composition per well of a 6-well plate: 1 μg lentiviral vector, 1.25 μg of psPAX2 plasmid (Addgene, 12260), 0.25 μg pCMV-VSVg plasmid (Addgene, 8454), 250 μl OptiMEM (Thermo Fisher, 31985062), and 7.5 μl TransIT-LT1 reagent. The mixture was incubated for 30 minutes and added dropwise to 293FT cells. After a 6 hour incubation, medium was aspirated and 2 ml fresh DMEM medium was added to the cells. After 36 hours, viral supernatant was harvested, filtered through a 0.45-μm PVDF filter (Millipore) and delivered to cultured target cells (HSMM, AG04450) as follows. AG04450 cells were obtained from Coriell and grown in EMEM medium (Lonza) supplemented with 15% fetal bovine serum and 1% penicillin-streptomycin. Cryopreserved HSMM cells isolated from normal donors were obtained from Lonza and grown in SkGMTM-2 BulletKit Medium (Lonza). 4 × 10⁵ cells were seeded in 6-well plates the day before lentivirus treatment. Cells were incubated in replicates with 500 μl of corresponding virus and 1 ml medium (AG04405) or 1 ml virus and 1 ml medium (HSMM) in the presence of 8 μg/ml polybrene for 10 h (AG04450) or 18 h (HSMM). Following infection, the medium was replaced with fresh complete medium. After 2 days of growth, cells were selected with 1.5 μg/ml puromycin. Cells were harvested one week after lentiviral treatment and pelleted for RNA isolation. Total RNA was isolated using the NucleoSpin RNA Plus Mini kit (MACHEREY-NAGEL, 740984.50). cDNA synthesis was performed using the ProtoScript II First Strand cDNA Synthesis Kit (NEB, E6560) using the Random Primer Mix. RT-qPCR was performed using SYBR Select Master Mix (Applied Biosystems, 4472908) and the 7500 Fast Real-Time PCR System (Applied Biosystems). Two technical RT-qPCR replicates (from the same cDNA) were performed. Four independent experiments (biological replicates) were performed for AG04450 and three for HSMM. Relative IGF2 expression in Figure 5d was normalized to TBP and B2M. RT-qPCR primer sequences are reported in Supplementary Table 4.
External Data (DNase, CTCF ChIP-seq, RNA-seq, H3K27ac ChIP-seq, Micro-C).
The following datasets were downloaded from ENCODE: GM12878 DNase (ENCSR000EMT); K562 DNase (ENCSR000EOT); GM12878 CTCF ChIP-Seq (ENCSR000DZN); GM12878 RNA-Seq (ENCSR843RJV); K562 RNA-Seq (ENCSR000AEQ); H1 H3K27ac ChIP-Seq (ENCSR880SUY); HSMM H3K27ac ChIP-Seq (ENCSR000ANF); HSMM RNA-seq (ENCSR444WHQ); Panc1 H3K27ac ChIP-Seq (ENCSR000EXK); HeLa H3K27ac ChIP-Seq (ENCSR000AOC); K562 H3K27ac ChIP-Seq (ENCSR000AKP); A549 H3K27ac ChIP-Seq (ENCSR000AUI); PC-3 H3K27ac ChIP-Seq (ENCSR826UTD); Osteoblast H3K27ac ChIP-Seq (ENCSR000APH); AG04450 H3K27ac ChIP-Seq (ENCSR000DPL); AG04450 RNA-seq (ENCSR000COO); HUVEC H3K27ac ChIP-Seq (ENCSR000ALB); NHEK H3K27ac ChIP-Seq (ENCSR000ALK). The following datasets were downloaded from published studies: H1-ESC Micro-C (4DN data portal, 4DNES21D8SP8). Pituitary ATAC-seq (GSE178454).
Quantification of H3K27ac signal for the non-canonical enhancer.
To quantify the intensity of H3K27ac signal for the non-canonical enhancer, peaks called from H3K27ac ChIP-seq and Mint-ChIP data were downloaded from ENCODE (Supplementary Table 2). Peaks were overlapped with the non-canonical enhancer region (chr11:2076500-2098242) by intersectBed (bedtools v2.26.0) with at least one base pair. Samples with no overlapping peaks were defined as no-peak samples. For samples with overlapping peaks, enhancer signals were calculated based on the signalValue in the peak files. The values for the whole region were summed. The values from different replicates were averaged.
GTEx analysis.
To identify tissue types with mono- or bi-allelic expression of IGF2, RNA-seq data and SNP annotations from 838 donors from the GTEx v8 dataset43 were examined on the Terra Platform (https://app.terra.bio/). Heterozygous SNPs were called from whole-genome sequencing data. RNA-seq reads mapped to hg38 were further processed with bcftools-mpileup to count their allele frequency over all heterozygous SNPs. Heterozygous SNPs with less than 10 reads of coverage in RNA-seq data were excluded from downstream analysis. The significance of allele bias of heterozygous SNPs in RNA-seq was then assessed via the binomial test. SNPs with allelic bias P value less than 0.01 were considered to express IGF2 from a single allele. SNPs with allelic bias P value greater than 0.01 were considered to express IGF2 from both alleles. If a donor had both bi-allelic and mono-allelic expressed SNPs called in one given tissue type, we counted this donor as undetermined IGF2 allelic status for this given tissue type. The final bi-allelic percentage was calculated by dividing the number of bi-allelic donors by all the donors with IGF2 allelic status called either mono or bi-allelic for given tissue type. Expression levels of T cell markers and IGF2 in GTEx whole-blood donors (Fig. 5e) were measured by log2(TPM+1) and normalized via z-score.
Extended Data


Supplementary Material
Acknowledgments
The authors thank all members of the Bernstein laboratory for discussions and Charles Epstein and Paola Arlotta’s laboratory for kindly providing cryopreserved H9 hES cells. This work was supported by funds from the NCI/NIH Director’s Fund (DP1CA216873 to B.E.B.), the Gene Regulation Observatory and the Variant-to-Function Initiative at the Broad Institute. J.W. is supported by a postdoctoral fellowship from the Damon-Runyon Cancer Research Foundation. Z.C. is supported by a K00 from the NCI. B.E.B. is the Richard and Nancy Lubin Family Endowed Chair at the Dana-Farber Cancer Institute and an American Cancer Society Research Professor.
Footnotes
Competing interest
B.E.B. declares outside interests in Fulcrum Therapeutics, Arsenal Biosciences, HiFiBio, Cell Signaling Technologies and Chroma Medicine. The remaining authors declare no competing interests.
Code availability. Source code for analysis is available at https://github.com/BernsteinLab/targetedNOMe_2022.
Data availability.
Primary sequencing and processed data are available through the Gene Expression Omnibus (GEO) under accession number GSE183760. The following databases were used in this study: hg38 gencode annotation (V22), hg38 Ensembl Regulatory Build (release 101), hg38 RefSeq v39.
References
- 1.Baylin SB & Jones PA A decade of exploring the cancer epigenome - biological and translational implications. Nat. Rev. Cancer 11, 726–734 (2011). [DOI] [PMC free article] [PubMed] [Google Scholar]
- 2.Greenberg MVC & Bourc’his D The diverse roles of DNA methylation in mammalian development and disease. Nat. Rev. Mol. Cell Biol 20, 590–607 (2019). [DOI] [PubMed] [Google Scholar]
- 3.Lappalainen T & Greally JM Associating cellular epigenetic models with human phenotypes. Nat. Rev. Genet 18, 441–451 (2017). [DOI] [PubMed] [Google Scholar]
- 4.Cavalli G & Heard E Advances in epigenetics link genetics to the environment and disease. Nature 571, 489–499 (2019). [DOI] [PubMed] [Google Scholar]
- 5.Klemm SL, Shipony Z & Greenleaf WJ Chromatin accessibility and the regulatory epigenome. Nat. Rev. Genet 20, 207–220 (2019). [DOI] [PubMed] [Google Scholar]
- 6.ENCODE Project Consortium et al. Expanded encyclopaedias of DNA elements in the human and mouse genomes. Nature 583, 699–710 (2020). [DOI] [PMC free article] [PubMed] [Google Scholar]
- 7.Roadmap Epigenomics Consortium et al. Integrative analysis of 111 reference human epigenomes. Nature 518, 317–330 (2015). [DOI] [PMC free article] [PubMed] [Google Scholar]
- 8.Stunnenberg HG, International Human Epigenome Consortium & Hirst M. The International Human Epigenome Consortium: A Blueprint for Scientific Collaboration and Discovery. Cell 167, 1897 (2016). [DOI] [PubMed] [Google Scholar]
- 9.Pardo CE, Darst RP, Nabilsi NH, Delmas AL & Kladde MP Simultaneous single-molecule mapping of protein-DNA interactions and DNA methylation by MAPit. Curr. Protoc. Mol. Biol Chapter 21, Unit 21.22 (2011). [DOI] [PMC free article] [PubMed] [Google Scholar]
- 10.Kelly TK et al. Genome-wide mapping of nucleosome positioning and DNA methylation within individual DNA molecules. Genome Res. 22, 2497–2506 (2012). [DOI] [PMC free article] [PubMed] [Google Scholar]
- 11.Wang Y et al. Single-molecule long-read sequencing reveals the chromatin basis of gene expression. Genome Res. 29, 1329–1342 (2019). [DOI] [PMC free article] [PubMed] [Google Scholar]
- 12.Shipony Z et al. Long-range single-molecule mapping of chromatin accessibility in eukaryotes. Nat. Methods 17, 319–327 (2020). [DOI] [PMC free article] [PubMed] [Google Scholar]
- 13.Lee I et al. Simultaneous profiling of chromatin accessibility and methylation on human cell lines with nanopore sequencing. Nat. Methods 17, 1191–1199 (2020). [DOI] [PMC free article] [PubMed] [Google Scholar]
- 14.Stergachis AB, Debo BM, Haugen E, Churchman LS & Stamatoyannopoulos JA Single-molecule regulatory architectures captured by chromatin fiber sequencing. Science 368, 1449–1454 (2020). [DOI] [PubMed] [Google Scholar]
- 15.Abdulhay NJ et al. Massively multiplex single-molecule oligonucleosome footprinting. Elife 9, (2020). [DOI] [PMC free article] [PubMed] [Google Scholar]
- 16.Giesselmann P et al. Analysis of short tandem repeat expansions and their methylation state with nanopore sequencing. Nat. Biotechnol 37, 1478–1481 (2019). [DOI] [PubMed] [Google Scholar]
- 17.Gilpatrick T et al. Targeted nanopore sequencing with Cas9-guided adapter ligation. Nat. Biotechnol 38, 433–438 (2020). [DOI] [PMC free article] [PubMed] [Google Scholar]
- 18.Wallace AD et al. CaBagE: A Cas9-based Background Elimination strategy for targeted, long-read DNA sequencing. PLoS One 16, e0241253 (2021). [DOI] [PMC free article] [PubMed] [Google Scholar]
- 19.Stubbington MJT, Rozenblatt-Rosen O, Regev A & Teichmann SA Single-cell transcriptomics to explore the immune system in health and disease. Science 358, 58–63 (2017). [DOI] [PMC free article] [PubMed] [Google Scholar]
- 20.Shema E, Bernstein BE & Buenrostro JD Single-cell and single-molecule epigenomics to uncover genome regulation at unprecedented resolution. Nat. Genet 51, 19–25 (2019). [DOI] [PubMed] [Google Scholar]
- 21.Sönmezer C et al. Molecular Co-occupancy Identifies Transcription Factor Binding Cooperativity In Vivo. Mol. Cell 81, 255–267.e6 (2021). [DOI] [PMC free article] [PubMed] [Google Scholar]
- 22.Pott S Simultaneous measurement of chromatin accessibility, DNA methylation, and nucleosome phasing in single cells. Elife 6, (2017). [DOI] [PMC free article] [PubMed] [Google Scholar]
- 23.Li P et al. BATF–JUN is critical for IRF4-mediated transcription in T cells. Nature 490, 543–546 (2012). [DOI] [PMC free article] [PubMed] [Google Scholar]
- 24.Wu J et al. Ablation of Transcription Factor IRF4 Promotes Transplant Acceptance by Driving Allogenic CD4+ T Cell Dysfunction. Immunity 47, 1114–1128.e6 (2017). [DOI] [PMC free article] [PubMed] [Google Scholar]
- 25.Huber M & Lohoff M IRF4 at the crossroads of effector T-cell fate decision. Eur. J. Immunol 44, 1886–1895 (2014). [DOI] [PubMed] [Google Scholar]
- 26.Bell AC & Felsenfeld G Methylation of a CTCF-dependent boundary controls imprinted expression of the Igf2 gene. Nature 405, 482–485 (2000). [DOI] [PubMed] [Google Scholar]
- 27.Harding FA, McArthur JG, Gross JA, Raulet DH & Allison JP CD28-mediated signalling co-stimulates murine T cells and prevents induction of anergy in T-cell clones. Nature 356, 607–609 (1992). [DOI] [PubMed] [Google Scholar]
- 28.Lenschow DJ, Walunas TL & Bluestone JA CD28/B7 system of T cell costimulation. Annu. Rev. Immunol 14, 233–258 (1996). [DOI] [PubMed] [Google Scholar]
- 29.Ji Z & Ji H TSCAN: Pseudo-time reconstruction and evaluation in single-cell RNA-seq analysis. Nucleic Acids Res. 44, e117 (2016). [DOI] [PMC free article] [PubMed] [Google Scholar]
- 30.Trapnell C et al. The dynamics and regulators of cell fate decisions are revealed by pseudotemporal ordering of single cells. Nat. Biotechnol 32, 381–386 (2014). [DOI] [PMC free article] [PubMed] [Google Scholar]
- 31.Saelens W, Cannoodt R, Todorov H & Saeys Y A comparison of single-cell trajectory inference methods. Nat. Biotechnol 37, 547–554 (2019). [DOI] [PubMed] [Google Scholar]
- 32.Haghverdi L, Büttner M, Wolf FA, Buettner F & Theis FJ Diffusion pseudotime robustly reconstructs lineage branching. Nat. Methods 13, 845–848 (2016). [DOI] [PubMed] [Google Scholar]
- 33.Tucci V, Isles AR, Kelsey G, Ferguson-Smith AC & Erice Imprinting Group. Genomic Imprinting and Physiological Processes in Mammals. Cell 176, 952–965 (2019). [DOI] [PubMed] [Google Scholar]
- 34.Noordermeer D & Feil R Differential 3D chromatin organization and gene activity in genomic imprinting. Curr. Opin. Genet. Dev 61, 17–24 (2020). [DOI] [PubMed] [Google Scholar]
- 35.Monk D, Mackay DJG, Eggermann T, Maher ER & Riccio A Genomic imprinting disorders: lessons on how genome, epigenome and environment interact. Nat. Rev. Genet 20, 235–248 (2019). [DOI] [PubMed] [Google Scholar]
- 36.Court F et al. Genome-wide parent-of-origin DNA methylation analysis reveals the intricacies of human imprinting and suggests a germline methylation-independent mechanism of establishment. Genome Res. 24, 554–569 (2014). [DOI] [PMC free article] [PubMed] [Google Scholar]
- 37.Hark AT et al. CTCF mediates methylation-sensitive enhancer-blocking activity at the H19/Igf2 locus. Nature 405, 486–489 (2000). [DOI] [PubMed] [Google Scholar]
- 38.Nurk S et al. The complete sequence of a human genome. Science 376, 44–53 (2022). [DOI] [PMC free article] [PubMed] [Google Scholar]
- 39.Ainscough JF, John RM, Barton SC & Surani MA A skeletal muscle-specific mouse Igf2 repressor lies 40 kb downstream of the gene. Development vol. 127 3923–3930 (2000). [DOI] [PubMed] [Google Scholar]
- 40.Jones BK, Levorse J & Tilghman SM Deletion of a nuclease-sensitive region between the Igf2 and H19 genes leads to Igf2 misregulation and increased adiposity. Hum. Mol. Genet 10, 807–814 (2001). [DOI] [PubMed] [Google Scholar]
- 41.Charalambous M et al. An enhancer element at the Igf2/H19 locus drives gene expression in both imprinted and non-imprinted tissues. Dev. Biol 271, 488–497 (2004). [DOI] [PubMed] [Google Scholar]
- 42.Freschi A et al. The number of the CTCF binding sites of the H19/IGF2:IG-DMR correlates with DNA methylation and expression imprinting in a humanized mouse model. Human Molecular Genetics (2021) doi: 10.1093/hmg/ddab132. [DOI] [PMC free article] [PubMed] [Google Scholar]
- 43.Null N et al. The GTEx Consortium atlas of genetic regulatory effects across human tissues. Science 369, 1318–1330 (2020). [DOI] [PMC free article] [PubMed] [Google Scholar]
- 44.Zhang Z et al. Single nucleus transcriptome and chromatin accessibility of postmortem human pituitaries reveal diverse stem cell regulatory mechanisms. Cell Rep. 38, 110467 (2022). [DOI] [PMC free article] [PubMed] [Google Scholar]
Methods-only references
- 45.Krietenstein N et al. Ultrastructural Details of Mammalian Chromosome Architecture. Mol. Cell 78, 554–565.e7 (2020). [DOI] [PMC free article] [PubMed] [Google Scholar]
- 46.Johnstone SE et al. Large-Scale Topological Changes Restrain Malignant Progression in Colorectal Cancer. Cell 182, 1474–1489.e23 (2020). [DOI] [PMC free article] [PubMed] [Google Scholar]
- 47.Buenrostro JD, Wu B, Chang HY & Greenleaf WJ ATAC-seq: A method for assaying chromatin accessibility genome-wide. Curr. Protoc. Mol. Biol 109, 21.29.1–21.29.9 (2015). [DOI] [PMC free article] [PubMed] [Google Scholar]
- 48.Joung J et al. Genome-scale CRISPR-Cas9 knockout and transcriptional activation screening. Nat. Protoc 12, 828–863 (2017). [DOI] [PMC free article] [PubMed] [Google Scholar]
- 49.Schmiedel BJ et al. 17q21 asthma-risk variants switch CTCF binding and regulate IL-2 production by T cells. Nat. Commun 7, 13426 (2016). [DOI] [PMC free article] [PubMed] [Google Scholar]
Associated Data
This section collects any data citations, data availability statements, or supplementary materials included in this article.
Supplementary Materials
Data Availability Statement
Primary sequencing and processed data are available through the Gene Expression Omnibus (GEO) under accession number GSE183760. The following databases were used in this study: hg38 gencode annotation (V22), hg38 Ensembl Regulatory Build (release 101), hg38 RefSeq v39.