Abstract
The mechanism for the accumulation of itraconazole (ITZ) in its elimination from the brain was studied in rats and mice. The concentration of ITZ in liver tissue declined in parallel with the plasma ITZ concentration until 24 h after intravenous injection of the drug (half-life, 5 h); however, the ITZ in brain tissue rapidly disappeared (half-life, 0.4 h). The time profiles of the brain/plasma ITZ concentration ratio (Kp value) showed a marked overshooting, and the Kp value increased with increasing dose; these phenomena were not observed in the liver tissue. This finding indicates the occurrence of a nonlinear efflux of ITZ from the brain to the blood. Moreover, based on a pharmacokinetic model which hypothesized processes for both nonlinear and linear effluxes of ITZ from the brain to the blood, we found that the efflux rate constant in the saturable process was approximately sevenfold larger than that in the nonsaturable process. The Kp value for the brain tissue was significantly increased in the presence of ketoconazole or verapamil. The brain Kp value for mdr1a knockout mice was also significantly increased compared with that of control mice. Moreover, the uptake of vincristine or vinblastine, both of which are substrates of the P glycoprotein (P-gp), into mouse brain capillary endothelial cells was also significantly increased by ITZ or verapamil. In conclusion, P-gp in the brain capillary endothelial cells participates in a process of active efflux of ITZ from the brain to the blood at the blood-brain barrier, and ITZ can be an inhibitor of various substrates of P-gp.
Itraconazole (ITZ), an azole antifungal agent, inhibits cytochrome P-450-mediated ergosterol synthesis in fungal membranes (2) as well as CYP3A4 and other isozymes involved in xenobiotic metabolism in the liver (1). Recently, it has been reported that ITZ leads to various side effects due to drug-drug interactions. For example, the coadministration of ITZ with terfenadine, an antiallergy agent, caused cardiovascular side effects (7). The concentration of cyclosporine (CsA), an immunosuppressive agent, in blood increased when ITZ was coadministered (16). The occurrence of these side effects resulted from increases in the concentrations of terfenadine and CsA in blood that was caused by inhibition of CYP3A4-mediated metabolism of these drugs by ITZ. Moreover, the coadministration of ITZ and digoxin (DGX), a cardiac glycoside, caused nausea, vomiting, and visual disturbances (19). To clarify the mechanism of interaction of ITZ and DGX, we investigated the effect of ITZ on the pharmacokinetic behavior of DGX in guinea pigs (20). We found a reduction in metabolic, biliary, and urinary clearances of DGX after coadministration of ITZ in guinea pigs.
CsA, DGX, vincristine (VCR), and terfenadine, which metabolically interact with ITZ, are also substrates and/or inhibitors of the P glycoprotein (P-gp) (12, 17, 25, 26). P-gp was initially identified as a plasma membrane protein overexpressed in tumor cells. It functions as an active efflux pump to exclude Vinca alkaloid anticancer drugs, etc., from the cell and confers multidrug resistance to tumor cells (9, 21). It is known that P-gp is expressed not only on tumor cells but also on normal cells, such as those of the adrenal gland, the brush border membrane of renal proximal tubules, the bile canaliculus membrane of hepatocytes, the apical membrane of mucosal cells in the intestine, and capillary endothelial cells of the brain, testis, and the placenta or uterus (on pregnancy) and that it affects the pharmacokinetic behavior of some drugs (24, 28, 29). Recently, it was reported that ITZ reversed multidrug resistance in tumor cells in in vitro experiments (11, 15).
In this study, the contribution of P-gp to the process of ITZ efflux from the brain to the blood was studied in normal rats and mdr1a knockout mice. Moreover, the effect of ITZ on the uptake of P-gp substrates by mouse brain capillary endothelial cells (MBEC4 cells) was examined.
MATERIALS AND METHODS
Drugs.
ITZ and ketoconazole were kindly supplied by Janssen Pharmaceutica (Tokyo, Japan). [3H]VCR and [3H]vinblastine ([3H]VBL) were purchased from Amersham Ltd. (Little Chalfont, United Kingdom). Verapamil was purchased from Nacalai Tesque, Inc. (Kyoto, Japan). All other chemicals used in the experiments were of analytical grade.
Animals.
Male SD rats (Seac Yoshitomi, Ltd., Fukuoka, Japan) weighing 200 to 250 g were used in all of the experiments. Wild-type and mdr1a −/− mice of the FVB strain weighing 20 to 25 g were purchased from Taconic Farms, Inc. (Germantown, N.Y.).
Measurement of ITZ concentrations in blood, plasma, and tissues after intravenous administration to rats.
Rats anesthetized with diethyl ether were cannulated in the right femoral artery and vein. A 10-mg/ml solution of ITZ was prepared by dissolving 10 mg of ITZ in 50 μl of 12 M HCl and 875 μl of polyethylene glycol 200 and then neutralizing the solution with NaOH. The dose of ITZ was 5, 10, or 20 mg/kg of body weight. Drugs were administered into the femoral vein, and blood samples were collected from the femoral artery. The blood as well as the brain and liver tissue samples were obtained at 5 and 15 min and at 1, 4, 8, and 24 h after intravenous administration of ITZ. Plasma was obtained by centrifuging the blood at 1,620 × g for 5 min at room temperature. The concentrations of ITZ in plasma and in brain and liver tissues were determined by high-performance liquid chromatography (HPLC).
For the concurrent use of ketoconazole or verapamil, ketoconazole was suspended in distilled water and the pH of the suspension was adjusted to 2.5 with 1 M HCl, while verapamil was dissolved in saline. Ketoconazole (20 mg/kg) or verapamil (5 mg/kg) was administrated 5 min before the administration of ITZ into the femoral vein at a dose of 5 mg/kg. Distilled water of pH 2.5 (adjusted with 1 M HCl) or saline was administered to rats of a control group in the same manner. Rats were killed 60 min after the administration of ITZ, and their blood and brains were collected. The blood samples were centrifuged at 1,620 × g for 5 min at room temperature to obtain plasma. The concentrations of ITZ in the plasma and brain tissue were determined by HPLC.
To extract ITZ from plasma samples, 0.1 ml of methanol, 0.5 ml of 1 M NaOH, and 2.5 ml of hexane-isoamyl alcohol (98:2, vol/vol) were added to 0.1 ml of plasma sample, and the mixture was shaken for 5 min prior to centrifugation at 1,250 × g for 5 min. After evaporation of 2 ml of the organic phase under a nitrogen stream, the residue was dissolved in 200 μl of the mobile phase and 100 μl was injected into the HPLC system. The brain and liver tissue samples were homogenized with a fourfold excess volume of distilled water. To 0.5 ml of the homogenate were added 0.1 ml of methanol, 0.5 ml of 1 M NaOH, and 5 ml of hexane-isoamyl alcohol (98:2, vol/vol). Samples were shaken for 5 min and centrifuged at 1,250 × g for 5 min. Then 3 ml of 0.1 M HCl was added to 4 ml of the organic phase, and the solution was shaken for 5 min. After centrifugation at 1,250 × g for 5 min, 0.5 ml of 1 M NaOH and 3 ml of hexane-isoamyl alcohol (98:2, vol/vol) were added to 2 ml of the aqueous phase and the solution was shaken for 5 min. After centrifugation at 1,250 × g for 5 min, 2 ml of the organic phase was collected and evaporated to dryness under a nitrogen stream. The residue was dissolved in 200 μl of the mobile phase, and 100 μl was injected into the HPLC system.
The HPLC system consisted of a liquid chromatograph (model LC-6A; Shimadzu, Kyoto, Japan) and a UV spectrophotometric detector (model SPD-6A; Shimadzu) operated at 263 nm. The column used for HPLC was an Inertsil octyldecyl silane (ODS) (5 μm [particle diameter] by 250 mm [length] by 4.6 mm [inside diameter]; GL Sciences Inc., Tokyo, Japan), and a YMC-Guardpack ODS-AM (5 μm by 10 mm by 4.6 mm; YMC, Inc., Wilmington, N.C.) was used as a guard column. The mobile phase was acetonitrile–10 mM phosphate buffer (pH 6.5) (8:2, vol/vol). The flow rate of the mobile phase was 1.0 ml/min. The column was maintained at 40°C.
The limits for quantification of ITZ were 50 ng/ml for plasma and 100 ng/ml for liver and brain tissues. In all measurements, coefficients of variation were less than 10%, and within-run accuracy was always within ±10%. Moreover, coefficients of variation for between-day precision measurements were also always less than 10%.
Measurement of plasma and tissue ITZ concentration-time profiles after intravenous administration in mdr1a knockout mice.
ITZ was intravenously administered through the tail vein at a dose of 5 mg/kg to mdr1a knockout mice (mdr1a −/− mice) or to FVB mice (mdr1a +/+ mice) as controls. Blood as well as brain, liver, kidney, and lung tissue samples were obtained at 5, 15, and 60 min after administration of ITZ. A 1-mg/ml solution of ITZ was prepared by dissolving 10 mg of ITZ in 500 μl of 12 M HCl and 8.75 ml of polyethylene glycol 200 and then neutralizing the solution with NaOH.
The blood samples were centrifuged at 1,620 × g for 5 min at room temperature to obtain the plasma, and 0.2 ml of a 1-mg/ml β-naphthoflavone–acetonitrile solution, an internal standard, was added to 0.1 ml of plasma. The samples were vigorously mixed and then centrifuged at 1,250 × g for 10 min. The supernatant was then filtered (Ekicrodisc 13CR; Gelman Sciences Inc., Ann Arbor, Mich.), and 20 μl was injected into the HPLC system. The weights of brain, liver, kidney, and lung tissue samples were measured before extraction, and 0.3 ml of the 1-mg/ml β-naphthoflavone–acetonitrile solution was added to each of them. They were vigorously mixed in a microhomogenizer (model NS-310E; Niti-on, Chiba, Japan) and centrifuged at 1,250 × g for 10 min. Each supernatant was then filtered, and 20 μl was injected into the HPLC system.
The HPLC system consisted of a liquid chromatograph (model LC-10AT; Shimadzu) and a UV spectrophotometric detector (model SPD-10A; Shimadzu) operated at 263 nm. The HPLC column was a YMC-Pack ODS-A (5 μm by 150 mm by 6.0 mm; YMC, Inc.). The mobile phase was acetonitrile–10 mM phosphate buffer (pH 7.0) (8:2, vol/vol). The flow rate of the mobile phase was 1.2 ml/min. The column was maintained at 40°C.
The limits of quantification were 40 ng/ml for plasma and 50 ng/ml for brain tissue. For all measurements, coefficients of variation were less than 10%, and within-run accuracy was always within ±10%. Moreover, coefficients of variation for between-day precision measurements were less than 10%.
Determination of influx clearance in the brain and the liver.
To evaluate the permeability of the liver or brain to ITZ quantitatively, we analyzed the plasma and tissue ITZ concentration data. The concentration data for brain and liver tissues were plotted as tissue/plasma concentration ratios (Kp values) versus the areas under the curve (AUC)/plasma ITZ concentrations after the administration of the drug. Furthermore, the same analysis described above was performed in short-duration experiments. The influx clearance (CLinf) of ITZ in the brain and the liver could be obtained from the slope of the linear phase of the curve (3).
Measurement of uptake of [3H]VCR and [3H]VBL by MBEC4 cells.
MBEC4 cells were routinely cultured as described in our previous report (27). Briefly, MBEC4 cells were maintained in Dulbecco’s modified Eagle’s medium (Nikken BioMedical Laboratory, Kyoto, Japan) supplemented with 10% fetal bovine serum, penicillin (100 U/ml), and streptomycin (100 μg/ml). For the transport study, cells were seeded into four-well plates (Nunc) at a density of 4 × 10⁴/well. Next, the cells were grown for 3 days in a humidified atmosphere of 5% CO2–95% O2, the medium was aspirated, and the cells were washed with 37°C phosphate-buffered saline and then covered with transport buffer (141 mM NaCl, 4.0 mM KCl, 2.8 mM CaCl2, 1.0 mM MgSO4, 10 mM d-glucose, and 10 mM HEPES; pH 7.4) containing 10 mM [3H]VCR or 10 mM [3H]VBL. The amount of intracellular [3H]VCR or [3H]VBL was determined as follows. After incubation of the cells for 1 h, they were washed with ice-cold transport buffer to stop the uptake of labeled drug. The cells were digested in 200 μl of 1 M NaOH and neutralized with 200 μl of 1 M HCl at the end of the uptake study for 1 h. Then, to 300 μl of each sample was added 4 ml of a scintillation cocktail (Clear-sol I; Nacalai Tesque). The radioactivities of the samples were measured with a scintillation counter (LS6500; Beckman Instruments, Fullerton, Calif.), and the values were converted to total radioactivity per unit volume (400 μl). These values were divided by the radioactivity of the added drug solution per unit volume (disintegrations per minute per milliliter), and the clearance (in milliliters per hour) was calculated. The residual 100 μl was used for the measurement of the protein concentration by the method of Lowry et al. (18). The clearance, calculated as described above, was divided by the cellular protein concentration, and the amount of drug taken up per unit amount of protein (in microliters per hour per milligram of protein) was determined. The uptake of studies both drugs were performed in the presence or absence of 10 μM verapamil or 4.25 μM ITZ. The same amount of dimethyl sulfoxide was added in all experiments since the ITZ was dissolved in a 0.1% dimethyl sulfoxide solution.
Data analysis.
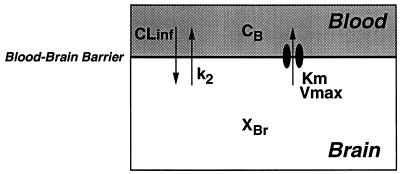
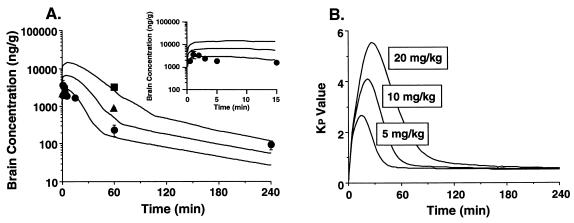
The pharmacokinetic behavior of ITZ in the brain was analyzed on the basis of the pharmacokinetic model shown in Fig. 1. In this model, it is hypothesized that not only passive diffusion but also an active transport efflux system influences the pharmacokinetic behavior of ITZ in the brain after intravenous administration of the drug. The differential equation used for the brain concentration profiles (XBr) was as follows:
 |
1 |
where CLinf (in milliliters per minute per gram of brain tissue) was the influx clearance value, k2 (in inverse minutes) was the linear efflux rate constant, Vmax (in nanograms per minute per gram of brain tissue) was the maximum transport rate of the efflux process, Km (in nanograms per milliliter) was the Michaelis constant, Vd (in milligrams per gram of brain tissue) was the volume of distribution, Cp was the plasma concentration time profile (input function), and RB (0.79) was the blood/plasma ITZ concentration ratio. The differential equation (equation 1) was fitted to the ITZ concentration in the brain tissue by using the nonlinear least-squares program MULTI (RUNGE) (32, 33), which can numerically solve differential equations by the four-dimensional Runge-Kutta method. All data were weighed by the reciprocals of the squares of observed values for nonlinear least-squares regression.
FIG. 1.
Pharmacokinetic model for the analysis of the behavior of ITZ in the brain. The intracerebral behavior of ITZ was analyzed in terms of this pharmacokinetic model as described in Materials and Methods.
Statistical methods.
Results are given as the means ± standard errors (SE). Statistical analyses were performed with Student’s t test. Statistical significance was deemed achieved at a P value of less than 0.05.
RESULTS
Plasma and tissue ITZ concentration-time profiles after intravenous administration to rats.
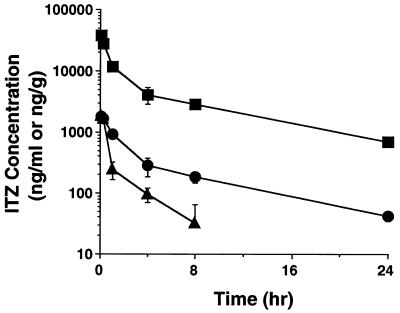
After the intravenous administration of ITZ (5 mg/kg) to rats, plasma and brain and liver tissue ITZ concentrations were measured for 24 h (Fig. 2). The liver tissue ITZ concentration declined biexponentially in parallel with the plasma ITZ concentration during the first 24 h after administration (half-life, 5 h). However, the elimination of ITZ from the brain did not parallel the plasma ITZ concentration, and the second phase of elimination was much faster in brain tissue than in plasma (half-life, 0.4 h). The elimination half-lives of ITZ for plasma and brain tissue were estimated in a model-independent manner.
FIG. 2.
Plasma and tissue ITZ concentration-time profiles after its intravenous administration (at 5 mg/kg) to rats. The plasma and tissue ITZ concentrations were determined by HPLC as described in Materials and Methods. Each point represents the mean ± SE (n = 3). Symbols: •, plasma; ▴, brain; ▪, liver.
Analysis of accumulation of ITZ in tissues.
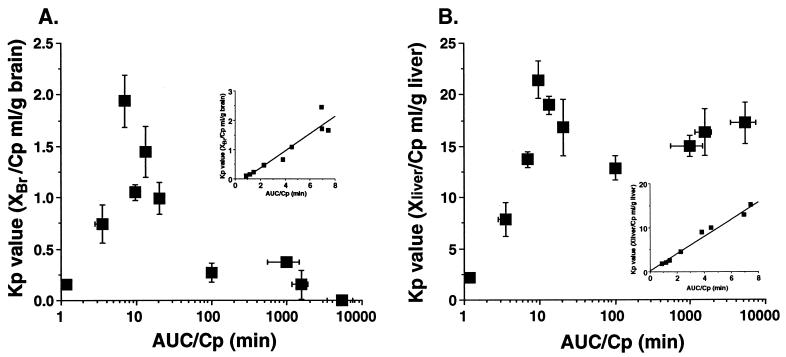
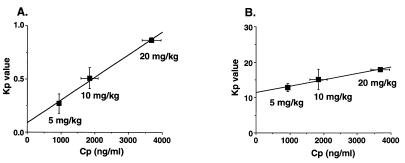
Brain and liver tissue Kp value-AUC/Cp profiles are shown in Fig. 3. A rapid elevation during the early phase and a rapid reduction of the Kp value in the brain tissue were observed, whereas the Kp value for ITZ in the liver tissue was at a steady state after 10 min. The linear accumulation profile observed in the liver tissue was also observed in the kidney and spleen tissues (data not shown). The Kp value-AUC/Cp profiles for the brain and liver tissues during the early phase after administration are shown in the insets of Fig. 3A and B, respectively. A linear accumulation in the brain was observed until 8 min after administration. For the brain tissue, the slope of the line describing the relationship between the Kp value and the plasma concentration was positive and larger than 0 (Fig. 4A), and it was larger than that for the liver tissue (Fig. 4B).
FIG. 3.
Kp value-AUC/Cp profiles of ITZ accumulation in elimination from brain (A) and liver (B) tissues after intravenous administration at a dose of 5 mg/kg to rats. (Insets) Kp value-time profile of ITZ from 0 to 8 min. Each point represents the mean ± SE (n = 3).
FIG. 4.
Plasma ITZ concentration dependency of Kp values, after intravenous administration of the drug to rats, for brain (A) and liver (B) tissues. ITZ was administered to rats via the femoral vein at a dose of 5, 10, or 20 mg/kg. After 1 h, plasma as well as brain and liver tissue specimens were collected and analyzed by HPLC as described in Materials and Methods. Each point represents the mean ± SE (n = 3).
Pharmacokinetic analysis of the behavior of ITZ in the brain.
The pharmacokinetic behavior of ITZ in the brain was analyzed by using the model shown in Fig. 1. The model in Fig. 1 describes passive diffusion into and out of the brain as well as active transport out of the brain tissue. The fitting curves, according to equation 1 and the data obtained up to 240 min after intravenous administration of 5 mg of ITZ/kg, are shown in Fig. 5A. Moreover, the early phase in Fig. 5 is shown as an inset. The curves showed good agreement with the data. The root mean square error, normalized to the observed values and calculated as an index of fitting performance (30), was 0.28 for the brain concentration profile, which suggests a mean error estimate of less than 30%. The estimates (± SE) of CLinf, k2, Vmax, and Km × Vd values were 0.191 ± 0.018 ml/min/g of brain tissue, 0.0386 ± 0.021 min−1, 214 ± 220 ng/min/g of brain tissue, and 764 ± 1,800 ng/g of brain tissue, respectively. Moreover, the same Kp value-time profile as that in Fig. 3A and a dose-dependent increase in the Kp value until 240 min after intravenous administration were obtained by simulation at three doses, as shown in Fig. 5B.
FIG. 5.
Simulation curves of the ITZ concentration (A) and Kp value (B) in brain tissue. Solid lines represent the fitting curves based on equation 1 as described in Materials and Methods (Inset). Simulation curves of brain ITZ concentrations from 0 to 15 min postadministration. Each point in panel (A) represents the mean ± SE (n = 3). Symbols: •, 5 mg/kg; ▴, 10 mg/kg; ▪, 20 mg/kg.
Effect of coadministration of ketoconazole or verapamil on the plasma ITZ concentration and the accumulation of ITZ in the brain.
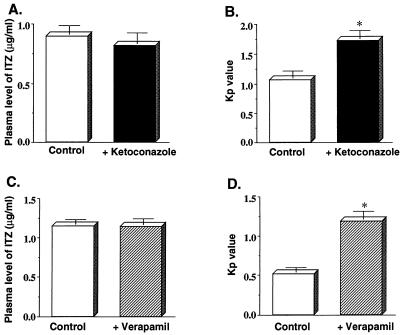
Plasma ITZ concentration-time profiles obtained after intravenous administration of 5 mg of ITZ/kg seemed unaffected by the coadministration of 20 mg of ketoconazole or 5 mg of verapamil/kg (Fig. 6A and C). However, the Kp value for ITZ in the brain tissue was significantly increased by the coadministration of ketoconazole or verapamil (Fig. 6B and D). No effect was observed at a dose of 2.5 mg of verapamil/kg (data not shown).
FIG. 6.
Effect of ketoconazole or verapamil coadministration, respectively, on the plasma ITZ concentration (A and C) and the uptake of ITZ into the brain (B and D). ITZ was administered to rats via the femoral vein at a dose of 5 mg/kg. Ketoconazole (20 mg/kg) or verapamil (5 mg/kg) was administered to rats 5 min before the injection of ITZ. One hour after the administration of ITZ, the plasma and brain tissue were collected, and the concentration of ITZ was determined by HPLC as described in Materials and Methods. Each value represents the mean ± SE (n = 3 to 4). Asterisks indicate values found to be significantly different from control values as determined by Student’s t test. (P < 0.05). Symbols: □, ITZ (5 mg/kg) alone; ▪, ITZ (5 mg/ml) and ketoconazole (20 mg/kg); ▨, ITZ (5 mg/ml) and verapamil (5 mg/kg).
Tissue distribution studies in mdr1a knockout mice.
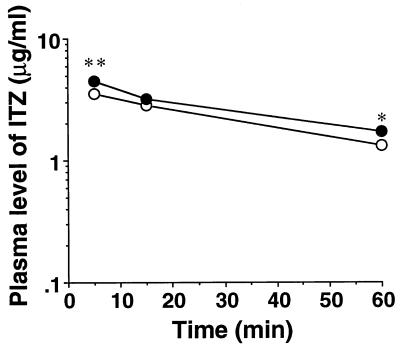
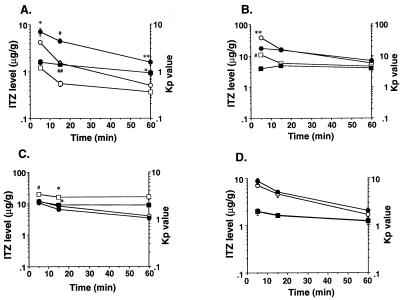
The plasma and tissue ITZ concentrations were measured at 5, 15, and 60 min after administration of the drug at a dose of 5 mg/kg to mdr1a −/− mice (knockout mice) or mdr1a +/+ mice (control mice). The plasma ITZ concentrations of the knockout mice were significantly increased at 5 and 60 min compared with those of the control mice (Fig. 7). The brain tissue ITZ concentrations and Kp values in knockout mice at 15 and 60 min were increased approximately 2.5-fold over those of the control mice (Fig. 8A). A significant reduction in the Kp value was observed at 5 min in the liver tissue of knockout mice compared with that of control mice (Fig. 8B). A significant reduction in the Kp value was also observed in the kidney tissue at 5 and 15 min after administration (Fig. 8C). On the other hand, no significant difference between the Kp values for lung tissues of knockout mice and control mice was observed (Fig. 8D).
FIG. 7.
Plasma ITZ concentration-time profiles after intravenous administration of the drug at a dose of 5 mg/kg to mdr1a knockout mice. The plasma ITZ concentration was determined by HPLC as described in Materials and Methods. Each point represents the mean ± SE (n = 3 to 4). Values determined to be significantly different from those of mdr1a +/+ mice by Student’s t test are indicated (∗, P < 0.05; ∗∗, P < 0.001). Symbols: •, mdr1a −/− mice; ○, mdr1a +/+ mice.
FIG. 8.
Distribution of ITZ in mdr1a knockout mouse organs after intravenous administration of this drug at a dose of 5 mg/kg. Shown are ITZ concentrations and Kp values for brain (A), liver (B), kidney (C), and lung (D) tissues. Each Kp value was calculated by dividing the organ ITZ concentration by the plasma ITZ concentration. Each point represents the mean ± SE (n = 3 to 4). Values found to be significantly different from control values by Student’s t test are indicated (∗, P < 0.05; ∗∗, P < 0.01; #, P < 0.005; ##, P < 0.001). Symbols: •, concentration, mdr1a −/− mice; ○, concentration, mdr1a +/+ mice; □, Kp value, mdr1a −/− mice; ▪, Kp value, mdr1a +/+ mice.
Effect of ITZ or verapamil on the uptake of [3H]VCR and [3H]VBL by MBEC4 cells.
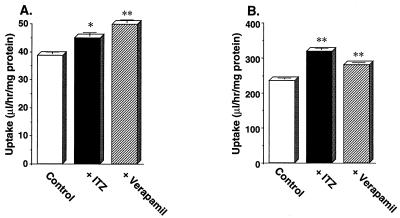
Plots of the uptake of 10 nM [3H]VCR and 10 nM [3H]VBL by MBEC4 cells for 1 h in the presence or absence of 4.25 μM ITZ or 10 μM verapamil are shown in Fig. 9. The rates of uptake of both drugs by MBEC4 cells were significantly increased in the presence of either ITZ or verapamil.
FIG. 9.
Effect of ITZ or verapamil on the uptake of [3H]VCR (A) and [3H]VBL (B) by MBEC4 cells. The uptake of 10 nM [3H]VCR or 10 nM [3H]VBL by MBEC4 at 37°C was measured for 1 h in the presence or absence of 4.25 μM ITZ or 10 μM verapamil as described in Materials and Methods. Each value represents the mean ± SE (n = 3 to 4). Values determined to be significantly different from those of drug-only controls by Student’s t test are indicated (∗, P < 0.005; ∗∗, P < 0.001). Symbols: □, control; ▪, with ITZ; ▨, with verapamil.
DISCUSSION
Although ITZ is highly lipophilic (the partition coefficient of ITZ in the n-octanol–water system [log P] is 5.66), the accumulation of ITZ in brain tissue is extremely restricted in comparison with its accumulation in other tissues, such as the liver (14). The reason for this is still unclear. We hypothesized that the low-level accumulation of ITZ in brain tissue was due to the presence of a specific efflux transport system in the brain-blood barrier (BBB). As shown in Fig. 2, the concentration of ITZ in the brain tissue rapidly declined by 1 h after administration compared with that of the liver. It was believed that half-life of ITZ in brain tissue could never be shorter than its half-life in plasma under linear conditions; however, this may be not the case. In the case of ITZ, the active efflux system was saturated at high drug concentrations, and the efflux clearance increased as the concentration became lower; therefore, the elimination half-life in the liver could be shorter than that in plasma. A similar scenario has been suggested by Hammarlund-Udenaes et al. (13). Moreover, Fig. 2 showed that for ITZ, AUCbrain/AUCplasma < 1, which indicated that CLin < CLout. Possible mechanisms for this, in addition to active transport out of the brain, are metabolism in and bulk flow from the brain; however, these may be minor contributors. Based on the plot of Kp values versus AUC/Cp, we found that the level of accumulation of ITZ in the brain tissue (Kp) was high when the concentration of this drug in the brain was high, i.e., during the early phase after administration, and that it was low when the drug concentration in the brain was low, i.e., in the later phase (Fig. 3). Thus, the presence of a nonlinear mechanism of active efflux of ITZ from the brain to the blood is suggested. This is also supported by the dose-dependent increase in the Kp value of ITZ (Fig. 4A). Accordingly, to explain the mechanism of transport of ITZ at the BBB, we designed a model including both the passive diffusion process and the saturable process of efflux from the brain to the blood, which involved a specific transporter (Fig. 1). In this model, we found that the estimated efflux rate constant (0.28 min−1) in the saturable process was approximately sevenfold larger than the linear efflux rate constant (k2; 0.039 min−1) and that this saturable process was important to explain ITZ’s nonlinear accumulation in and elimination from the brain. We must consider the process of influx and efflux through the BBB and the bulk flow of cerebrospinal fluid for the analysis of drug transport into the brain. However, our data could not distinguish passive efflux from elimination by bulk flow. The saturable influx process was negative, since the ratio of the concentration of ITZ in the brain to the Cp (Kp value) increased linearly during the initial phase of uptake, as shown in the inset of Fig. 3A. For these reasons, we constructed the simple compartment model that included the saturable efflux process. More detailed investigations will be required to clarify the disposition of ITZ in the brain.
Gupta et al. reported that ITZ reversed daunorubicin resistance in tumor cells (11). Kurosawa et al. reported that ITZ reversed adriamycin and etoposide resistance in tumor cells (15). These reports suggested that ITZ should be an inhibitor of P-gp in tumor cells. P-gp is expressed in the brain’s capillary endothelial cells and actively excludes the transport of lipophilic and cationic drugs such as CsA from the brain to the blood (22). Moreover, since many interactions between substrates and/or the inhibitor of P-gp (such as CsA, DGX, and VCR) and ITZ have been reported (4, 16, 19), we investigated whether ITZ could work as a substrate and/or inhibitor of P-gp at the BBB. To ascertain our hypothesis, we examined the effect of verapamil, which is known to be a P-gp inhibitor, on the accumulation of ITZ in the brain. As shown in Fig. 6, the brain Kp value was significantly increased in spite of the lack of a significant change in the plasma ITZ concentration in the presence of verapamil or ketoconazole. The plasma ITZ concentration might change if the distribution of ITZ in the brain or other P-gp-expressing tissue were to be altered. The alteration could not be detected because it occurred at a low level, so a significant change in the plasma ITZ concentration was not observed in this study. In addition, the inhibitory effects of verapamil and ketoconazole were considered to be competitive, since the Kp value for ITZ was significantly increased in the presence of either drug (at 5 mg/kg or 20 mg/kg, respectively) and an increased Kp value was not observed in the presence of verapamil at 2.5 mg/kg. These results also suggested that ITZ might be a substrate of P-gp, and P-gp plays an important role in the ITZ efflux process at the BBB. Chikhale et al. reported similar results, i.e., that P-gp-mediated transport of peptides through the BBB was inhibited in the presence of 500 mM verapamil; however, using an in situ brain perfusion technique, they observed no significant effect on the transport of urea and l-leucine through the BBB (6). Furthermore, the results obtained by the coadministration of ketoconazole, another azole antifungal agent, indicated that ITZ and ketoconazole were likely to be transported via the same carrier at the BBB. However, the affinity of ITZ and ketoconazole for P-gp at the BBB is still unknown.
To examine more directly the contribution of P-gp to the pharmacokinetic behavior of ITZ in the brain, we utilized mdr1a −/− mice, a strain developed by Schinkel et al. (23) that has a homozygous disruption of the mdr1a P-gp gene. It had already been determined that P-gp is encoded by small gene families and that there are two family members in humans (MDR1 and MDR2) and three members in mice (mdr1a, mdr1b, and mdr2) (5). It is well-known that mdr1a P-gp and mdr1b P-gp in mice fulfill almost the same function as MDR1 P-gp in humans (24). However, their distributions in normal tissues are not equivalent. In addition, the physiological functions of the P-gp’s encoded by MDR1, mdr1a, and mdr1b in normal tissues are unclear. So, pharmacological studies in mdr1a −/− mice are necessary as an index of drug interactions in humans, although it is difficult to avoid differences between clinical results and the results of pharmacological studies with these mice. In this study, we found that the accumulation of ITZ in the brain tissue of mdr1a −/− mice was significantly increased compared with that in mdr1a +/+ mice (Fig. 8A). These results strongly suggest that ITZ is a substrate of mdr1a P-gp expressed in mouse brain endothelial cells. On the other hand, the accumulation of ITZ in the liver and the kidney was significantly reduced compared to that in the brain in mdr1a −/− mice, in contrast to the situation in mdr1a +/+ mice (Fig. 8B and C). The details are still unclear; however, it is likely that ITZ is vigorously excluded from the liver and kidney by mdr1b P-gp in mdr1a −/− mice, since mdr1b P-gp mRNA levels were induced in these tissues of this mouse strain (23).
We also investigated the mechanism of transport of ITZ at the BBB by using MBEC4 cells. As shown in Fig. 9, the uptake of VCR or VBL, both of which are substrates of P-gp, by MBEC4 cells was significantly increased in the presence of ITZ or verapamil. These results suggest that ITZ plays an important role in the inhibition of the P-gp-mediated efflux process. Recently, it has been reported that mdr1a P-gp is hardly expressed in MBEC4 cells but that mdr1b P-gp is predominantly expressed (27). Accordingly, it is possible that the interaction of ITZ with mdr1b P-gp could be investigated by using this cell system. Although the substrate specificities of mdr1a P-gp and mdr1b P-gp might not be identical, both of these glycoproteins should work as efflux transporters (8, 10). In this study, we showed that ITZ was a substrate and/or an inhibitor of both mdr1a P-gp and mdr1b P-gp. Since mdr1a and mdr1b in mice have functions equivalent to those of MDR1 in humans, it is likely that ITZ also inhibits the function of MDR1 in humans. Actually, ITZ served as a multidrug resistance reversing agent for acute lymphoblastic leukemia patients given daunorubicin and ITZ concurrently (31). So, ITZ may significantly increase the accumulation in the brain of neurotoxic drugs such as VCR and VBL in the clinical field. In the future, it will be necessary to investigate the quantitative contribution of mdr1a and mdr1b to the accumulation of ITZ in the brain by using mdr1b knockout animals, mdr1a and mdr1b double-knockout animals, and an mdr1a-expressing cell line.
In the present study, the total concentration of drug was measured instead of just the unbound-protein concentration, and the species differences and concentration dependency of protein binding in plasma and tissues were not considered. Since ITZ shows a high propensity to bind to plasma proteins, the possibility of displacement of protein binding cannot be excluded. However, we found that not only passive diffusion but also the active efflux system, involving P-gp of the BBB, plays an important role in ITZ’s accumulation in and elimination from the brain. Moreover, ITZ is a P-gp inhibitor and as such may cause an increase in the accumulation of some drugs in the brain after coadministration. It is necessary to pay attention not only to the inhibition of the CYP3A4-mediated metabolism of coadministered drugs by ITZ but also to the central nervous system side effects caused by the enhanced accumulation of drugs in the brain that is induced by the ITZ-mediated inhibition of P-gp activity.
REFERENCES
- 1.Back D J, Tjia J F. Comparative effects of the antimycotic drugs ketoconazole, fluconazole, itraconazole and terbinafine on the metabolism of cyclosporin by human liver microsomes. Br J Clin Pharmacol. 1991;32:624–626. doi: 10.1111/j.1365-2125.1991.tb03963.x. [DOI] [PMC free article] [PubMed] [Google Scholar]
- 2.Bailey E, Karkovsky D, Rybak M. The triazole antifungal agents: a review of itraconazole and fluconazole. Pharmacotherapy. 1990;10:146–153. [PubMed] [Google Scholar]
- 3.Blasberg R G, Fenstermacher J D, Patlak C S. Transport of α-aminoisobutyric acid across brain capillary and cellular membranes. J Cereb Blood Flow Metab. 1983;3:8–32. doi: 10.1038/jcbfm.1983.2. [DOI] [PubMed] [Google Scholar]
- 4.Bohme A, Ganser A, Hoelzer D. Aggravation of vincristine-induced neurotoxicity by itraconazole in the treatment of adult ALL. Ann Hematol. 1995;71:311–312. doi: 10.1007/BF01697985. [DOI] [PubMed] [Google Scholar]
- 5.Chen C J, Chin J E, Ueda K, Clark D P, Pastan I, Gottesman M M, Roninson I B. Internal duplication and homology with bacterial transport proteins in the mdr1 (P-glycoprotein) gene from multidrug-resistant human cells. Cell. 1986;47:381–389. doi: 10.1016/0092-8674(86)90595-7. [DOI] [PubMed] [Google Scholar]
- 6.Chikhale E G, Burton P S, Borchardt R T. The effect of verapamil on the transport of peptides across the blood-brain barrier in rats: kinetic evidence for an apically polarized efflux mechanism. J Pharmacol Exp Ther. 1995;273:298–303. [PubMed] [Google Scholar]
- 7.Crane J K, Shin H-T. Syncope and cardiac arrhythmia due to an interaction between itraconazole and terfenadine. Am J Med. 1993;95:445–446. doi: 10.1016/0002-9343(93)90317-i. [DOI] [PubMed] [Google Scholar]
- 8.Devault A, Gros P. Two members of the mouse mdr gene family confer multidrug resistance with overlapping but distinct drug specificities. Mol Cell Biol. 1990;10:1652–1663. doi: 10.1128/mcb.10.4.1652. [DOI] [PMC free article] [PubMed] [Google Scholar]
- 9.Endicott J A, Ling V. The biochemistry of P-glycoprotein-mediated multidrug resistance. Annu Rev Biochem. 1989;58:137–171. doi: 10.1146/annurev.bi.58.070189.001033. [DOI] [PubMed] [Google Scholar]
- 10.Gros P, Dhir R, Croop J, Talbot F. A single amino acid substitution strongly modulates the activity and substrate specificity of the mouse mdr1 and mdr3 drug efflux pumps. Proc Natl Acad Sci USA. 1991;88:7289–7293. doi: 10.1073/pnas.88.16.7289. [DOI] [PMC free article] [PubMed] [Google Scholar]
- 11.Gupta S, Kim J, Gollaspudi S. Reversal of daunorubicin resistance in P388/ADR cells by itraconazole. J Clin Invest. 1991;87:1467–1469. doi: 10.1172/JCI115154. [DOI] [PMC free article] [PubMed] [Google Scholar]
- 12.Hait W N, Gesmonde J F, Murren J R, Yang J-M, Chen H-X, Reiss M. Terfenadine (Seldane): a new drug for restoring sensitivity to multidrug resistant cancer cells. Biochem Pharmacol. 1993;45:401–406. doi: 10.1016/0006-2952(93)90076-9. [DOI] [PubMed] [Google Scholar]
- 13.Hammarlund-Udenaes M, Paalzow L K, de Lange E C M. Drug equilibration across the blood-brain barrier—pharmacokinetic considerations based on the microdialysis method. Pharm Res. 1997;14:128–134. doi: 10.1023/a:1012080106490. [DOI] [PubMed] [Google Scholar]
- 14.Heykants J, Michiels M, Meuldermans W, Monbaliu J, Lavrijsen K, Peer A, Levron J C, Woestenborghs R, Gauwenbergh G. The pharmacokinetics of itraconazole in animals and man: an overview. In: Fromtling R A, editor. Recent trends in the discovery, development and evaluation of antifungal agents. J. R. Philadelphia, Pa: Prous Science Publishers, S.A.; 1987. pp. 223–249. [Google Scholar]
- 15.Kurosawa M, Okabe M, Hara N, Kawamura K, Suzuki S, Sakurada K, Asaka M. Reversal effect of itraconazole on adriamycin and etoposide resistance in human leukemia cells. Ann Hematol. 1996;72:17–21. doi: 10.1007/BF00663011. [DOI] [PubMed] [Google Scholar]
- 16.Kwan J T C, Foxall P J D, Davidson D G C, Bending M R, Eisinger A J. Interaction of cyclosporin and itraconazole. Lancet. 1987;ii:282. doi: 10.1016/s0140-6736(87)90873-7. [DOI] [PubMed] [Google Scholar]
- 17.Lannoy I A M, Mandin R S, Silverman M. Renal secretion of vinblastine, vincristine and colchicine in vivo. J Pharmacol Exp Ther. 1994;268:388–395. [PubMed] [Google Scholar]
- 18.Lowry O H, Rosebrough N J, Farr A L, Randall R J. Protein measurement with the Folin phenol reagent. J Biol Chem. 1951;193:265–275. [PubMed] [Google Scholar]
- 19.McClean K L, Sheehan G J. Interaction between itraconazole and digoxin. Clin Infect Dis. 1994;18:259–260. doi: 10.1093/clinids/18.2.259. [DOI] [PubMed] [Google Scholar]
- 20.Nishihara, K., J. Hibino, H. Kotaki, Y. Sawada, and T. Iga. Effect of itraconazole on pharmacokinetic behavior of digoxin in guinea pigs. Submitted for publication. [DOI] [PubMed]
- 21.Pastan I, Gottesman M. Multiple-drug resistance in human cancer. N Engl J Med. 1987;316:1388–1393. doi: 10.1056/NEJM198705283162207. [DOI] [PubMed] [Google Scholar]
- 22.Sakata A, Tamai I, Kawazu K, Deguchi Y, Ohnishi T, Saheki A, Tsuji A. In vivo evidence for ATP-dependent and P-glycoprotein-mediated transport of cyclosporin A at the blood-brain barrier. Biochem Pharmacol. 1994;48:1989–1992. doi: 10.1016/0006-2952(94)90601-7. [DOI] [PubMed] [Google Scholar]
- 23.Schinkel A H, Smit J J M, Tellingen O, Beijnen J H, Wagenaar E, Deemter L, Mol C A A M, Valk M A, Robanus-Maandag E C, Riele H P J, Berns A J M, Borst P. Disruption of the mouse mdr1a P-glycoprotein gene leads to a deficiency in the blood-brain barrier and to increased sensitivity to drugs. Cell. 1994;77:491–502. doi: 10.1016/0092-8674(94)90212-7. [DOI] [PubMed] [Google Scholar]
- 24.Schinkel A H, Mol C A A M, Wagenaar E, Deemter L, Smit J J M, Borst P. Multidrug resistance and the role of P-glycoprotein knockout mice. Eur J Cancer. 1995;31A:1295–1298. doi: 10.1016/0959-8049(95)00130-b. [DOI] [PubMed] [Google Scholar]
- 25.Shirai A, Naito M, Tatsuta T, Dong J, Hanaoka K, Mikami K, Oh-hara T, Tsuruo T. Transport of cyclosporin A across the brain capillary endothelial cell monolayer by P-glycoprotein. Biochim Biophys Acta. 1994;1222:400–404. doi: 10.1016/0167-4889(94)90047-7. [DOI] [PubMed] [Google Scholar]
- 26.Tanigawara Y, Okamura N, Hirai M, Yasuhara M, Ueda K, Kioka N, Komano T, Hori R. Transport of digoxin by human P-glycoprotein expressed in a porcine kidney epithelial cell line (LLC-PK1) J Pharmacol Exp Ther. 1992;263:840–845. [PubMed] [Google Scholar]
- 27.Tatsuta T, Naito M, Mikami K, Tsuruo T. Enhanced expression by the brain matrix of P-glycoprotein in brain capillary endothelial cells. Cell Growth Differ. 1994;5:1145–1152. [PubMed] [Google Scholar]
- 28.Thiebaut F, Tsuruo T, Hamada H, Gottesman M M, Pastan I, Willingham M C. Cellular localization of the multidrug-resistance gene product P-glycoprotein in normal human tissues. Proc Natl Acad Sci USA. 1987;84:7735–7738. doi: 10.1073/pnas.84.21.7735. [DOI] [PMC free article] [PubMed] [Google Scholar]
- 29.Tsuji A, Terasaki T, Takabatake Y, Tenda Y, Tamai I, Yamashima T, Moritani S, Tsuruo T, Yamashita J. P-glycoprotein as the drug efflux pump in primary cultured bovine brain capillary endothelial cells. Life Sci. 1992;51:1427–1437. doi: 10.1016/0024-3205(92)90537-y. [DOI] [PubMed] [Google Scholar]
- 30.Vozeh S, Uematsu T, Hauf G F, Follath F. Performance of Bayesian feedback to forecast lidocaine serum concentration: evaluation of the prediction error and the prediction interval. J Pharmacokinet Biopharm. 1985;13:203–212. doi: 10.1007/BF01059399. [DOI] [PubMed] [Google Scholar]
- 31.Vreugdenhil G, Raemaekers J M M, van Dijke B J, de Pauw B E. Itraconazole and multidrug resistance: possible effects on remission rate and disease-free survival in acute leukemia. Ann Hematol. 1993;67:107–109. doi: 10.1007/BF01701730. [DOI] [PubMed] [Google Scholar]
- 32.Yamamoto K, Sawada Y, Iga T. Pharmacodynamics analysis of contractile potentiation by cholinesterase inhibition in rats. J Pharmacokinet Biopharm. 1996;24:327–348. doi: 10.1007/BF02353516. [DOI] [PubMed] [Google Scholar]
- 33.Yamaoka K, Nakagawa T. A nonlinear least squares program based on differential equations, MULTI (RUNGE), for microcomputers. J Pharmacobio-Dyn. 1983;6:595–606. doi: 10.1248/bpb1978.6.595. [DOI] [PubMed] [Google Scholar]


