

Abstract
BACKGROUND:
Human exposure to per- and polyfluoroalkyl substances has been modeled to estimate serum concentrations. Given that the production and use of these compounds have decreased in recent years, especially PFOA and PFOS, and that additional concentration data have become available from the US and other industrialized countries over the past decade, aggregate median intakes of these two compounds were estimated using more recent data.
METHODS:
Summary statistics from secondary sources were collected, averaged, and mapped for indoor and outdoor air, water, dust, and soil for PFOA and PFOS to estimate exposures for adults and children. European dietary intake estimates were used to estimate daily intake from food.
RESULTS:
In accordance with decreased concentrations in media, daily intake estimates among adults, i.e., 40 ng/day PFOA and 40 ng/day PFOS, are substantially lower than those reported previously, as are children’s estimates of 14 ng/day PFOA and 17 ng/day PFOS. Using a first-order pharmacokinetic model, these results compare favorably to the National Health and Nutrition Examination Survey serum concentration measurements.
CONCLUSION:
Concomitant blood concentrations support this enhanced estimation approach that captures the decline of PFOA/PFOS serum concentration over a decade.
Keywords: Aggregate daily, Exposure model, PFOA, PFOS
INTRODUCTION
Per- and polyfluoroalkyl substances (PFAS) are manufactured and used in numerous industrial processes around the globe. Of these, perfluorooctanoic acid (PFOA) and perfluorooctane sulfonate (PFOS) have been among the most extensively produced and used. Imported products may contain trace concentrations of PFOA and PFOS as impurities. Also, given these chemicals are persistent, PFOA and PFOS continue to exist in human tissue and environmental media. Scientific studies have indicated that exposure to these and other PFAS may have adverse human health effects, including reproductive and developmental, liver and kidney, and immunological effect, as well as cancer (PFOA) and thyroid hormone disruption (PFOS) [1].
In recent years, numerous actions have been taken by nations, states, tribes, and provinces to address PFAS. In the US, the Office of Pollution Prevention and Toxics of the Environmental Protection Agency (EPA) began assessing perfluorinated compounds in 1999, based on growing evidence of toxicity and accumulation in the environment. The EPA issued Significant New Use Rules (SNURs) in 2000 and 2002 to restrict the return of PFOS-related chemicals to the US marketplace. The only remaining US manufacturer of PFOS voluntarily completed a phase out of PFOS in 2002 [2]. Most recently, the EPA updated its PFAS Action plan in February 2020 to enhance PFAS groundwater cleanup guidance, test methods, Toxics Release Inventory reporting, and drinking water standards [3].
In 2011, human exposures to PFOA and PFOS in the US were estimated by EPA’s Office of Research and Development using intake and pharmacokinetic (PK) models [4, 5]. The data input for these studies were gathered and curated from peer-reviewed scientific literature up to the year 2010 that reported concentrations of perfluorinated compounds, focusing on PFOS and PFOA. The effort summarized concentrations in exposure-related media reported in studies conducted around the world, and the models focused on data from North America. The exposure media included surface water, groundwater, indoor and outdoor air, house dust, and food. Common to most studies using secondary data [6], the modeling had to account for numerous variabilities and uncertainties in both the forward- and back-calculated intake doses, one-compartment PK modeling, and the input parameters. Also, at the time of these studies, sparse PFOA and PFOS concentration data resulted in a model that often used only one study per media. However, the modeling effort was able to identify some key factors that increased potential exposures, including proximity to industrial facilities that used these compounds, extent of urbanization, and proximity to surface waters and drinking water supplies known to be contaminated with PFAS. The 2011 studies generally found the central estimates of forward-calculated intakes to lie within the range of intakes back-calculated using the simple PK model. Although these estimates of route-specific intake were based on sparse data and, therefore, highly uncertain, the results were consistent with other contemporaneous studies [7–9].
The present study aims to refine the methods used in the original studies to estimate daily exposure estimation from summary statistics developed using updated PFOS and PFOA concentration data reported in the literature. Concentrations data are extracted from a Web of Science search of industrialized countries. A sequence of algorithms for estimating geometric means (GMs) and geometric standard deviations (GSDs) was developed and applied to estimate distribution of exposure for individual route. The medians of each route (dust inhalation, water ingestion, indoor air inhalation, outdoor air inhalation, dietary, and soil ingestion) are added to estimate daily aggregate exposure for PFOA and PFOS. A simple PK model is applied to convert this aggregate intake to body burden, which are compared to 2013–2014 National Health and Nutrition Examination Survey (NHANES) blood serum concentration data to evaluate the model. This process of gathering, curating, and interpreting data is summarized in Fig. 1.
Fig. 1. Generalized demonstrated approach to assessing exposure in this paper.
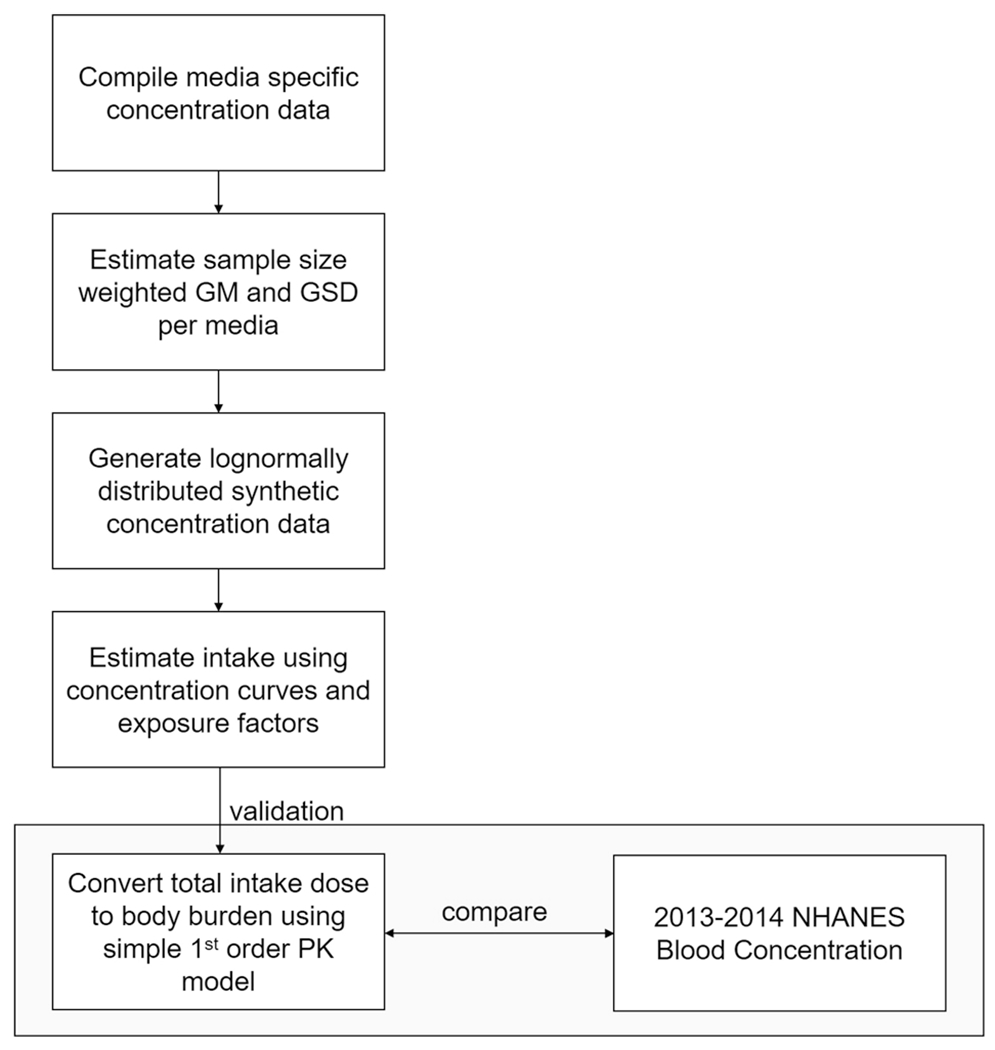
GM geometric mean, GSD geometric standard deviation, NHANES National Health and Nutrition Examination Survey, PK pharmacokinetic.
METHODS
General approach
Daily PFOS and PFOA exposure estimates are based on reported summary statistics from concentration studies across media, i.e., into indoor air, outdoor air, food, water, dust and soil, and published contact rates. Given the scarcity of raw data, a sequence to estimate GMs and GSDs for each media was developed, from which lognormal distributions are generated to represent media-specific concentrations. GMs and GSDs are weighted by sample size to account for breadth of study. Exposure factors for one child and one adult are applied deterministically to these concentration curves, resulting in distributions of exposure. The medians of each route (dust inhalation, water ingestion, indoor air inhalation, outdoor air inhalation, dietary, and soil ingestion) are added to estimate daily aggregate exposure. These values were entered into a first-order PK model to estimate PFOS and PFOA blood serum concentrations, which were then compared against serum concentrations reported in the 2013–2014 NHANES data. These methods are an expansion of the process taken by two previous studies [4, 5], which predicted body burden from aggregate daily intakes for PFOA and for PFOS, respectively.
Data curation
Available multimedia PFOS and PFOA concentration data in exposure-related media were compiled from the published literature according to the comprehensive search strategy. For a study to be included, it must appear in a peer-reviewed journal. If the model is not explicitly defined or is only referenced from a primary source, the study is excluded. Data extracted from the literature review were organized in a spreadsheet by media. A Web of Science database search for qualifying literature published between 2003 and 2017 was conducted in December 2017 and updated in June 2018, according to the following search query logic:
Web of Science Query Logic: ((((TS=((PFOA OR PFOS OR PFAS OR PFA OR PFC OR PFCs OR “perfluorooctane sulfonate” OR “perfluorooctanoic acid” OR “perfluorinated compounds” OR “perfluor*” OR “perfluoroalkyl”) Near/20 (level* OR concentration* OR exposure* OR bioavailab*) Near/20 (soil* OR *water* OR air OR dust* OR food* OR blood OR atmospher* OR “PM10” OR “PM2.5” OR TSP OR sediment OR diet* OR vegetable* OR fruit* OR “well water” OR “ground water” OR “drinking water” OR environment OR tap OR aerosol*)))))) AND LANGUAGE: (English)
The PFOA and PFOS aggregate estimates in the two previous studies included literature published prior to 2010. Thus, only papers published since 2011 were included in these estimates. Furthermore, only published datasets with a sample size over 5, and from North America and Europe were included. If no minimum was reported, 2/3 detection limit (MDL) was reported as the minimum [10]. Blood data and consumer products were excluded. Data from Asia, Africa, Oceana, South America, and Antarctica, data not digitally published, and experimental, non-direct, fate and transport, and far field assessments were also excluded. For inclusion in this manuscript, data were considered “typical,” i.e., collection occurred from a location not contaminated from industrial or wastewater sites with high levels of contamination. However, “contaminated” data were collected, and are available in the input and output files in the GitHub repository in the Supplementary information.
Exposure estimation methods
Few scientific articles were found that published or provided raw chemical occurrence data and published summary statistic parameters varied widely. To combine data from the disparate studies, the model estimates the GMs and GSDs of media-specific concentrations from published summary statistics, using a method in which the most reliable methods of estimating GM and GSD are prioritized. The process has three stages. First, assuming lognormal distributions, GMs and GSDs are estimated using the equations in Pleil et al. [11]. In the absence of raw data, median values were used first because GMs are best estimated based on the median. The second estimation method requires a mean and standard deviation (SD). Following the estimation of GM, the GSDs are also estimated as prioritized in Pleil et al., with the model preferring GSDs from a percentile and a GM, followed by a GM and an arithmetic mean. Studies with a maximum or a minimum and a GM were the final estimation for GSDs. The estimation process for GM and GSD is:
Geometric means:
| (1) |
| (2) |
Geometric standard deviations:
| (3) |
| (4) |
| (5) |
| (6) |
As some curated data did not have arithmetic means and SDs, values for these summary statistics were also estimated. These values could then be used with Eq. 2 to estimate more GMs and subsequent GSDs. Because these values are an estimation of an arithmetic mean and SD, followed by a geometric variant, i.e., “double-estimations,” substantial errors may be introduced for small samples, so these estimations are only performed on data with a sample size greater than 10. Therefore, arithmetic means and SDs are estimated, and then used to estimate remaining GMs and GSDs from sparse summary statistic data. These arithmetic estimations are again performed on available data sequentially: formulae 5 and 6 from Hozo et al. [12] are prioritized, followed by formula 7 from Ramirez and Cox [13], and finally the range rule of thumb.
Arithmetic means and SDs:
| (7) |
| (8) |
| (9) |
| (10) |
Following the estimation of each study-specific GM and GSD, each are sample size weighted to produce an estimated weighted mean GM and GSD per chemical and media. Exposure distributions are often found to be lognormal [14, 15]. Thus, a lognormal distribution is generated from these GMs and GSDs for both adults and children.
To estimate daily level of exposure associated with these media, concentration distributions are multiplied by route-specific exposure factors in Table 1 to determine media-specific exposures for adults and children. Exposure factors were held constant from the 2011 model so comparisons could be made between intake results.
Table 1.
Exposure factors and assumptions used to estimate intakes.
| Exposure route | Exposure factors | Units | Child factor | Adult factor | Source | Intake equation |
|---|---|---|---|---|---|---|
| Dust ingestion | Ingestion rate (IR) | g/day | 0.05 | 0.1 | Lorber (2008) [16] | |
| Absorption fraction (AF)a | - | 0.9 | 0.9 | Estimate | ||
|
| ||||||
| Dietary ingestion | Bodyweight (BW) | kg | 13 | 71.3 | EPA (1997, 2008) [17, 18] | |
|
| ||||||
| Water ingestion | Volume (V) | l/day | 0.4 | 1.4 | EPA (1997, 2008) [17, 18] | |
| Absorption fraction (AF)a | – | 0.9 | 0.9 | Estimate | ||
|
| ||||||
| Dust absorption | Dust load (DL) | g/m3 | 3.55 | 3.55 | Pang et al. (2002) [19] | |
| Transfer coefficient (TC) | m2/h | 0.06 | 0.06 | Hubal et al. (2006) [20] | ||
| Time performing activity (T) | h/day | 11 | 13 | Estimate | ||
| Absorption fraction (AF) | – | 0.048% | 0.048% | Fasano et al. (2005) [21] | ||
|
| ||||||
| Indoor inhalation | Inhalation rate (R) | m3/day | 6.8 | 13.3 | EPA (1997, 2008) [17, 18] | |
| Time performing activity (T) | h/day | 19 | 21 | Lorber (2008) [16] | ||
| Absorption fraction (AF) | – | 0.5 | 0.5 | Estimate | ||
|
| ||||||
| Outdoor inhalation | Inhalation rate (R) | m3/day | 6.8 | 13.3 | EPA (1997, 2008) [17, 18] | |
| Time performing activity (T) | h/day | 5 | 3 | Lorber (2008) [16] | ||
| Absorption fraction (AF) | – | 0.5 | 0.5 | Estimate | ||
|
| ||||||
| Soil ingestion | Ingestion rate (IR) | g/day | 0.05 | 0.09 | EPA (2017) [22] | |
| Absorption fraction (AF) | – | 0.5 | 0.5 | Estimate | ||
High absorption based on evidence of substantial enterohepatic circulation (based on gavage studies of rodents).
In this analysis, the average media concentration distributions are assumed to be nationally representative. For example, water from any “typical” concentration study is assumed to be representative of water anywhere, and airborne particles are assumed to represent the same media, with no weight prescribed to location and no discretion taken between PM2.5 and PM10 particles. Only data from “uncontaminated” studies were used in these distributions, so contaminated soils and measurements of effluent and groundwater were omitted. Food diets are the exception since they cannot be assumed to be a completely mixed media, given variation in preference for both adults and children. To use a similar approach for the dietary route, data to support modeling total dietary intake are required. However, no available market basket total diet studies are currently available in the US for PFOA and PFOS. To address this gap, dietary intake estimates from the European Food Safety Authority (EFSA) Panel on Contaminants in the Food Chain (CONTAM) were used to estimate PFOA and PFOS intakes. Although a sample size weighted GM and GM were calculated, food data did not undergo the GM and GSD prioritization method previously described. CONTAM provided PFOA and PFOS intake estimates (ng/kg-bw/day) for six different age groups: infants, toddlers, other children, adolescents, adults, elderly, very elderly, and lactating women. The studies are from various European countries and the lower bound estimate was used to estimate exposure, as the CONTAM panel asserted lower bound predictions to be closest to the true PFOA and PFOS exposures. In the estimates presented here, the European adult diet was used to model intake from food, and the “other children” (ages 3–10) was used to model children’s exposure to PFOA and PFOS, as CONTAM PFOA results for toddlers (ages 1–3) were particularly high. Small sample size and PFOA persistence in dairy, which consisted of 86% of the toddler intake, contributed to the high concentration value as the EFSA found PFOA more common in dairy than other media [23]. However, Vestergren et al. found similar levels of PFOA and PFOS in cow’s milk [24]. To use more data rich input, the “other children” EFSA dietary group was selected to represent 2-year-old US children.
Simple first-order PK model
After estimation of exposure, the medians of each exposure route in a typical scenario were aggregated to estimate daily total intakes. These were then entered into a simple, one-compartment PK model with steady-state assumptions to estimate blood serum concentration for comparison with reported NHANES blood sample data. In the model below, CP is the serum concentration (ng/ml), DP is the dose (ng/kg-bw/day), Vd is the volume of distribution (ml/kg), and kP is the elimination rate (1/day).
| (11) |
Volume of distributions were assumed to be 170 and 230 ml/kg for PFOA and PFOS, respectively [25], while the respective elimination rates were 0.00083 1/day and 0.00039 1/day for PFOA [26] and PFOS [27]. Both Egeghy and Lorber [4] and Lorber and Egeghy [5] discuss the ranging elimination rates and volumes of distribution. Some variations exceed a factor of 10, which would significantly affect the serum concentration estimate. A high and low estimate for PFOS was performed in Egeghy and Lorber, which used Vd estimates of 200 and 3000 ml/kg. In place of this value, a Vd of 230 ml/kg from Thompson et al. [25] was used. All other PK constants remained the same. To evaluate the effectiveness and assumptions of the steady-state model, the dynamical version Eq. 11 was also modeled:
| (12) |
This model was only used for adults and approaches a steady-state equilibrium dependent on the Vd at a rate determined by the DP and kP. A sensitivity analysis with varying values for Vd was also performed.
Updates to the 2011 estimation data and methods
The constructed model is an expansion from the original 2011 PFOS prediction model [4], which compares blood concentrations from 2003–2004 NHANES data to the intake model inputs, described as a “forwards” calculation, as opposed to comparing intakes, described as a “backwards” or back-calculated comparison in the PFOA estimate [28]. This updated model has undergone numerous changes: first, datasets from more recent studies were added to the model and were curated using the Web of Science Query above. The described GM/GSD estimation construction was implemented, followed by taking the sample size weighted mean per route, chemical, and scenario. Second, the number of points along the generated lognormal concentration curve, represented as n, was increased from 200 to 20,000. Although this has ramifications on the maxima and percentiles, estimated medians from the generated datapoints will be closer to the true median of the curve. This increase in generated concentration curves effectively increases accuracy in media with large GSDs. In addition, the soil ingestion route was added to predict aggregate exposure given recently reported measurements of PFOA and PFOS in soil [29, 30]. Soil carries a greater impact on children than adults due to higher ingestion rates and lower bodyweights [22]. The 2011 median (GM) dietary estimates of both PFOA and PFOS came from a Canadian market basket survey [31], coupled with a dietary GSD from a duplicate German diet study [32]. In this effort, the EFSA diet study was adapted, using data from Austria, Belgium, Bulgaria, Czech Republic, Germany, Denmark, Spain, Finland, France, United Kingdom, Hungary, Ireland, Greece, Italy, Latvia, Netherlands, Romania, and Sweden [23]. Although still secondary to US dietary data, inclusion of the EFSA CONTAM panel findings represents a significant increase in data availability since 2011 and includes diet for different age groups, which were not included in the original 2011 estimates. Data on indoor air concentration of PFOA and PFOS are also a new addition to this paper, given that previous estimates assumed that indoor concentration was 20 times the outdoor concentration.
Estimated daily intakes for adults are also compared to 2013–2014 NHANES blood serum distributions to compare the model estimates to measured data. In addition, PFOA and PFOS blood serum medians were also calculated from 2003–2004 NHANES data using the R package nhanesA [33] to characterize the observed decline in body burden between NHANES releases since the original estimates and this publication. All analyses were conducted using the open-source software R [34], and all models and scripts used in this analysis are in the Supplementary information GitHub repository. Finally, the dynamical PK model described in Eq. 12 is evaluated in this manuscript.
RESULTS
Compilation of media concentration data and summary statistic estimates
A summary of estimated values and concentration data from media is provided in Table 2. For additional information, including raw data and contaminated media, the model input file is available in the GitHub repository provided in the Supplementary information. All inputs are converted to ng/g, ng/l, or ng/m3, even though concentration data are often presented in different units. Some datasets, such as Shoieb et al. [35], were included despite the summary statistics indicating no variation, because all measurements were below the limit of detection. Although a GSD of 1 would create a distribution with identical points, the weighting with other studies introduces variation into each media generated distribution. Furthermore, this table provides an estimated GM and GSD for each dataset, allowing for distributions to be drawn from each. Among dust, GSDs varied from 1.3 to 9.3, reflecting the difference in variation between the measured data. Versions of Table 2 with greater detail are available in the GitHub repository in the Supplementary information and in both the results and input files. Descriptions include minimum, maximums, percentile, location, and year. New data include PFOA indoor air data and soil studies; however, only three datasets met inclusion criteria for soil. In total, 88 datasets were included, 44 for each chemical, excluding food.
Table 2.
Media-specific concentrations of PFOA and PFOS by media sorted alphabetically by author and rounded to second decimal place.
| Chemical | Units | Sample size | Median | Mean | SD | GM | GSD | Country | Citation |
|---|---|---|---|---|---|---|---|---|---|
| Dust | |||||||||
| PFOA | ng/g | 10 | 21 | 56 | 76 | 21 | 4 | Canada | Eriksson and Kärrman (2015) [36] |
| PFOA | ng/g | 10 | 15 | 32 | 47 | 15 | 3.4 | Faroe Islands | Eriksson and Kärrman (2015) |
| PFOA | ng/g | 10 | 14 | 18 | 11 | 14 | 1.9 | Sweden | Eriksson and Kärrman (2015) |
| PFOA | ng/g | 10 | 8.8 | 14 | 8.8 | 8.8 | 2.6 | Spain | Eriksson and Kärrman (2015) |
| PFOA | ng/g | 7 | 13 | 27 | 31 | 13 | 3.4 | Greece | Eriksson and Kärrman (2015) |
| PFOS | ng/g | 10 | 7.3 | 87 | 170 | 7.3 | 9.3 | Canada | Eriksson and Kärrman (2015) |
| PFOS | ng/g | 10 | 5.8 | 20 | 37 | 5.8 | 4.9 | Faroe Islands | Eriksson and Kärrman (2015) |
| PFOS | ng/g | 10 | 5.3 | 4.9 | 1.3 | 5.3 | 1.3 | Spain | Eriksson and Kärrman (2015) |
| PFOS | ng/g | 10 | 2.8 | 3.8 | 2.3 | 2.8 | 2.2 | Sweden | Eriksson and Kärrman (2015) |
| PFOS | ng/g | 7 | 7.2 | 27 | 20 | 7.2 | 5.1 | Greece | Eriksson and Kärrman (2015) |
| PFOA | ng/g | 31 | 82 | 32 | 4.4 | USA | Fraser et al. (2013) [37] | ||
| PFOA | ng/g | 30 | 220 | 24 | 4.4 | USA | Fraser et al. (2013) | ||
| PFOA | ng/g | 13 | 17 | 11 | 3.2 | USA | Fraser et al. (2013) | ||
| PFOS | ng/g | 31 | 23 | 15 | 3.2 | USA | Fraser et al. (2013) | ||
| PFOS | ng/g | 30 | 68 | 27 | 3.7 | USA | Fraser et al. (2013) | ||
| PFOS | ng/g | 13 | 83 | 16 | 4.6 | USA | Fraser et al. (2013) | ||
| PFOA | ng/g | 45 | 190 | 310 | 4100 | 190 | 2.7 | United Kingdom | Goosey and Harrad (2011) [38] |
| PFOA | ng/g | 42 | 240 | 310 | 1700 | 240 | 2 | United Kingdom | Goosey and Harrad (2011) |
| PFOA | ng/g | 20 | 290 | 550 | 6100 | 290 | 3.1 | United Kingdom | Goosey and Harrad (2011) |
| PFOA | ng/g | 20 | 65 | 110 | 370 | 65 | 2.8 | United Kingdom | Goosey and Harrad (2011) |
| PFOA | ng/g | 19 | 69 | 270 | 4000 | 69 | 5.2 | Canada | Goosey and Harrad (2011) |
| PFOA | ng/g | 10 | 300 | 290 | 180 | 300 | 2 | Germany | Goosey and Harrad (2011) |
| PFOA | ng/g | 10 | 240 | 370 | 440 | 240 | 2.5 | USA | Goosey and Harrad (2011) |
| PFOA | ng/g | 10 | 31 | 52 | 51 | 31 | 2.8 | France | Goosey and Harrad (2011) |
| PFOS | ng/g | 45 | 140 | 450 | 7500 | 140 | 4.6 | United Kingdom | Goosey and Harrad (2011) |
| PFOS | ng/g | 42 | 840 | 980 | 3700 | 840 | 1.7 | United Kingdom | Goosey and Harrad (2011) |
| PFOS | ng/g | 20 | 230 | 370 | 980 | 230 | 2.7 | United Kingdom | Goosey and Harrad (2011) |
| PFOS | ng/g | 20 | 97 | 260 | 1500 | 97 | 4.1 | United Kingdom | Goosey and Harrad (2011) |
| PFOS | ng/g | 19 | 140 | 290 | 1300 | 140 | 3.3 | Canada | Goosey and Harrad (2011) |
| PFOS | ng/g | 10 | 310 | 420 | 210 | 310 | 2.2 | USA | Goosey and Harrad (2011) |
| PFOS | ng/g | 10 | 170 | 310 | 240 | 170 | 3 | Germany | Goosey and Harrad (2011) |
| PFOS | ng/g | 10 | 160 | 330 | 410 | 160 | 3.3 | France | Goosey and Harrad (2011) |
| PFOA | ng/g | 41 | 18 | 20 | 52 | 18 | 2.1 | Norway | Haug et al. (2011) [9] |
| PFOS | ng/g | 41 | 3.1 | 11 | 94 | 3.1 | 1.5 | Norway | Haug et al. (2011) |
| PFOA | ng/g | 20 | 9 | 39 | 320 | 9 | 5.5 | USA | Karaskova et al. (2016) [9, 39] |
| PFOA | ng/g | 20 | 8.2 | 18 | 91 | 8.2 | 3.5 | Canada | Karaskova et al. (2016) |
| PFOA | ng/g | 16 | 2 | 8.9 | 26 | 2 | 5.6 | Czech Republic | Karaskova et al. (2016) |
| PFOS | ng/g | 20 | 14 | 42 | 240 | 14 | 4.4 | USA | Karaskova et al. (2016) |
| PFOS | ng/g | 20 | 9.1 | 11 | 29 | 9.1 | 1.8 | Canada | Karaskova et al. (2016) |
| PFOS | ng/g | 16 | 10 | 21 | 120 | 10 | 3.3 | Czech Republic | Karaskova et al. (2016) |
| PFOA | ng/g | 39 | 44 | 130 | 420 | 44 | 3.2 | USA | Knobeloch et al. (2012) [40] |
| PFOS | ng/g | 39 | 47 | 300 | 1100 | 47 | 5 | USA | Knobeloch al. (2012) |
| PFOA | ng/g | 18 | 2.4 | 3.3 | 8.5 | 2.4 | 2.2 | Czech Republic | Lankova et al. (2015) [41] |
| PFOS | ng/g | 18 | 1.5 | 1.4 | 3 | 1.5 | 1.7 | Czech Republic | Lankova et al. (2015) |
| PFOA | ng/g | 132 | 30 | 97 | 1400 | 32 | 4.4 | Canada | Shoeib et al. (2011) [35] |
| PFOS | ng/g | 132 | 71 | 280 | 4700 | 73 | 5.2 | Canada | Shoeib et al. (2011) |
| PFOA | ng/g | 31 | 39 | 110 | 170 | 39 | 2.4 | Germany | Xu et al. (2013) [42] |
| PFOS | ng/g | 31 | 20 | 97 | 220 | 20 | 3.4 | Germany | Xu et al. (2013) |
| Indoor air | |||||||||
| PFOA | ng/m3 | 12 | 0.018 | 0.058 | 0.2 | 0.018 | 4.6 | United Kingdom | Goosey and Harrad (2011) [38] |
| PFOS | ng/m3 | 12 | 0.055 | 0.056 | 0.077 | 0.055 | 1.2 | United Kingdom | Goosey and Harrad (2011) |
| PFOA | ng/m3 | 39 | 0.11 | 0.61 | 0.028 | 5.3 | Canada | Shoeib et al. (2011) [35] | |
| PFOS | ng/m3 | 39 | 1.3e–5 | 1.3e–5 | 7.6e–4 | 1.3e–5 | 1 | Canada | Shoeib et al. (2011) |
| PFOA | ng/m3 | 57 | 0.015 | 0.021 | 0.018 | 0.016 | 2.1 | Finland | Winkens et al. (2017) [43] |
| PFOA | ng/m3 | 57 | 1.3e–4 | 7.6e–4 | 0.0025 | 1.3e–4 | 4.1 | Finland | Winkens et al. (2017) |
| PFOS | ng/m3 | 57 | 6.7e–4 | 7.4e–4 | 5.1e–4 | 6.1e–4 | 1.9 | Finland | Winkens et al. (2017) |
| PFOS | ng/m3 | 57 | 0.0012 | 0.0013 | 8.9e–4 | 0.0011 | 1.9 | Finland | Winkens et al. (2017) |
| Outdoor air | |||||||||
| PFOA | ng/m3 | 10 | 0.0011 | 0.0035 | 0.0047 | 0.0011 | 4.6 | United Kingdom | Goosey and Harrad (2011) [38] |
| PFOS | ng/m3 | 10 | 0.0015 | 0.0023 | 0.0014 | 0.0015 | 2.5 | United Kingdom | Goosey and Harrad (2011) |
| PFOA | ng/m3 | 6 | 0.0025 | 0.0022 | 0.0018 | 2.3 | Canada | Shoeib et al. (2011) [35] | |
| PFOS | ng/m3 | 6 | 1.3e–5 | 1.3e–5 | 1.3e–5 | 1 | Canada | Shoeib et al. (2011) | |
| Soil | |||||||||
| PFOA | ng/g | 33 | 0.4 | 0.54 | 0.48 | 0.4 | 2.2 | various | Rankin et al. (2016) [30] |
| PFOA | ng/g | 29 | 0.43 | 0.57 | 0.48 | 0.43 | 2.1 | USA | Rankin et al. (2016) |
| PFOA | ng/g | 10 | 0.13 | 0.55 | 0.66 | 0.13 | 5.4 | various | Rankin et al. (2016) |
| PFOS | ng/g | 33 | 0.21 | 0.39 | 0.46 | 0.21 | 3.1 | various | Rankin et al. (2016) |
| PFOS | ng/g | 29 | 0.3 | 0.44 | 0.48 | 0.3 | 2.4 | USA | Rankin et al. (2016) |
| PFOS | ng/g | 10 | 0.084 | 0.86 | 0.78 | 0.084 | 8.7 | Various | Rankin et al. (2016) |
| Water | |||||||||
| PFOA | ng/l | 84 | 2.9 | 6.7 | 8.3 | 2.9 | 3.6 | Spain | Llorca et al. (2012) [44] |
| PFOA | ng/l | 24 | 5.3 | 13 | 20 | 5.3 | 3.8 | Spain | Llorca et al. (2012) |
| PFOA | ng/l | 24 | 1.3 | 2.1 | 2.2 | 1.3 | 2.7 | Germany | Llorca et al. (2012) |
| PFOA | ng/l | 5 | 1.3 | 1.3 | 0.45 | 1.3 | 1 | Spain | Llorca et al. (2012) |
| PFOS | ng/l | 84 | 7 | 46 | 82 | 7 | 7 | Spain | Llorca et al. (2012) |
| PFOS | ng/l | 24 | 5.1 | 260 | 810 | 5.1 | 17 | Spain | Llorca et al. (2012) |
| PFOS | ng/l | 24 | 1.4 | 2.1 | 2.3 | 1.4 | 2.5 | Germany | Llorca et al. (2012) |
| PFOS | ng/l | 5 | 0.4 | 0.093 | 0.39 | 1.3 | Spain | Llorca et al. (2012) | |
| PFOA | ng/l | 29 | 0.59 | 14 | 29 | 0.59 | 12 | Spain | Schwanz et al. (2016) [45] |
| PFOA | ng/l | 19 | 0.59 | 5.4 | 6.9 | 0.59 | 8.2 | France | Schwanz et al. (2016) |
| PFOA | ng/l | 10 | 0.59 | 9.5 | 2.6 | 0.59 | 11 | Spain | Schwanz et al. (2016) |
| PFOA | ng/l | 8 | 0.59 | 13 | 4.4 | 0.59 | 12 | France | Schwanz et al. (2016) |
| PFOS | ng/l | 29 | 0.27 | 40 | 140 | 0.27 | 24 | Spain | Schwanz et al. (2016) |
| PFOS | ng/l | 19 | 0.27 | 5.2 | 11 | 0.27 | 11 | France | Schwanz et al. (2016) |
| PFOS | ng/l | 10 | 0.27 | 0.27 | 0.27 | 1 | Spain | Schwanz et al. (2016) | |
| PFOS | ng/l | 8 | 0.27 | 21 | 0.27 | 19 | France | Schwanz et al. (2016) | |
| PFOA | ng/l | 10 | 27 | 26 | 18 | 2.4 | Germany | Shafique et al. (2016) [46] | |
| PFOA | ng/l | 10 | 15 | 12 | 12 | 2.1 | Germany | Shafique et al. (2016) | |
| PFOS | ng/l | 10 | 1.3 | 0.2 | 1.3 | 1.2 | Germany | Shafique et al. (2016) | |
| PFOS | ng/l | 10 | 3 | 2.6 | 2.2 | 2.2 | Germany | Shafique et al. (2016) | |
| PFOA | ng/l | 7 | 4.9 | 4.4 | 2.1 | 4.9 | 1.7 | Sweden, Italy, Belgium, Netherlands, Norway, Germany | Ullah et al. (2011) [47] |
| PFOS | ng/l | 7 | 0.86 | 3 | 2.1 | 0.86 | 4.9 | Sweden, Italy, Belgium, Netherlands, Norway, Germany | Ullah et al. (2011) |
Includes both reported values and predictions using summary statistic estimation. Values are presented as two significant figures or less.
Exposure intake estimates
Among children, dust was the dominant exposure pathway for both PFOA and PFOS. For PFOA, dust resulted in a median intake of 6.3 ng/day, followed by dietary at 6.0 ng/day, and water at 1.2 ng/day. For PFOS, estimated dust median intake for children was 10 ng/day, followed by diet and water at 5.5 and 1.2 ng/day, respectively. Dermal dust absorption, indoor air inhalation, soil ingestion, and outdoor air inhalation contributed less than 2% to median intake estimates for both PFOA and PFOS.
The dominant PFOA intake pathway for adults was diet, followed by water and dust, at 33, 4.2, and 3.2 ng/day, respectively. Even at the 95th percentile, the next highest contributing pathway, indoor air, returned 0.69 ng daily intake, indicating a divergence between the three major contribution pathways of diet, dust, water, and the remaining pathways of indoor air, dust, soil, and outdoor air. Like PFOA, diet was the dominant pathway for PFOS intake among adults, but dust ingestion exceeded water, with values of 30, 5.1, and 4.4 ng/day for diet, dust, and water, respectively. Again, dermal dust absorption, indoor and outdoor inhalation, and soil ingestion were not substantial contributors to intake, with the sum of those intakes adding to approximately 0.5 ng/day. In keeping with the previously discussed high variation in water estimates, the 95th percentile PFOS water intake estimate was 180 ng/day, compared with 95th percentiles of 170 and 46 for diet and dust, respectively. PFOA and PFOS intake distribution results across media for children and adults are presented in Fig. 2. A table of sample size weighted GMs and GSDs used to generate this output and a table of summary statistics is available in the Supplementary information file (Supplementary Tables 1 and 2).
Fig. 2. PFOA and PFOS exposure route boxplots for adults and children.
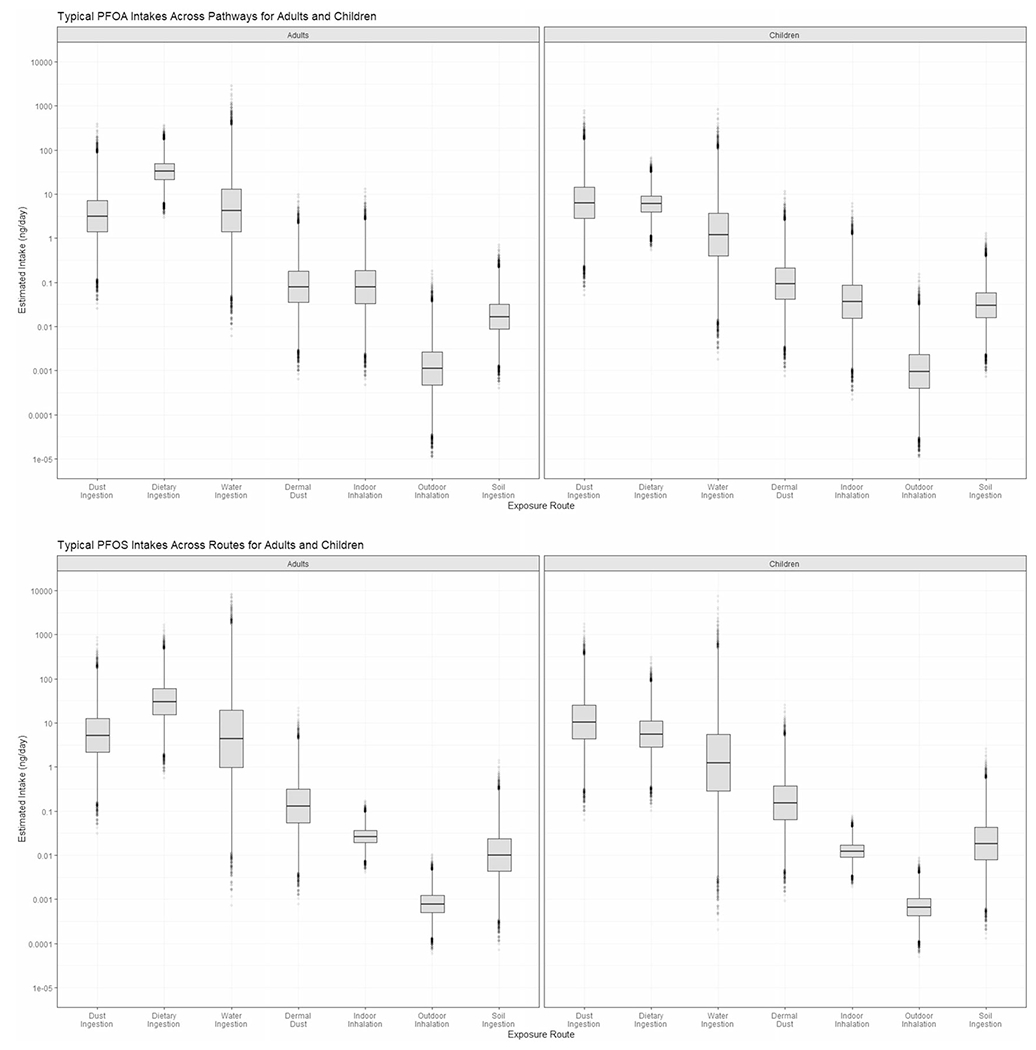
Daily route-specific estimates are provided for dust ingestion, dietary ingestion, water ingestion, dermal dust absorption, indoor inhalation, outdoor inhalation, and soil ingestion in ng/day. Boxplots show estimated for PFOA, adults and children, followed by PFOS, adults and children. n = 2000.
Among adults, diet is the largest contributor to daily PFOA exposure but is second to dust ingestion for children. Water is second among contributors to adults, and third for children, further highlighting the risk of dust exposure for children. In both scenarios, dietary estimates have relatively low variation in comparison with other media. For PFOS among adults, the dietary pathway is dominant, with a median intake value nearly an order of magnitude higher than dust and water ingestion. However, among children, PFOS in dust was the greatest contributor to daily intake, with the estimated median daily intake approximately double that from PFOS in diet. Aggregate estimated intake for adults, based on the sum of the medians, was 40 ng/day for both PFOA and PFOS. For children, aggregate estimated intakes were 14 ng/day PFOA and 17 ng/day PFOS.
PK model
Although absolute adult intakes were higher than children’s, weight-based intakes of PFOA and PFOS for children were higher at 1.1 and 1.3 ng/kg-bw/day compared to 0.57 and 0.56 ng/day for adults, respectively. After a simple first-order PK model, median serum concentration estimates for PFOA and PFOS in adults were 4.2 and 6.3 ng/ml. This compares favorably with reported median serum concentrations from NHANES, which are plotted in Fig. 3. The 2013–2014 NHANES median serum concentrations are 1.9 ng/ml for PFOA and 5.2 ng/ml for PFOS from individuals over age 18 (n = 1988). Among the NHANES measurements, the model estimated median was at the 88th percentile for PFOA, and 59th percentile for PFOS.
Fig. 3. The 2013-2014 NHANES serum concentration and model estimate for PFOA and PFOS in adults.
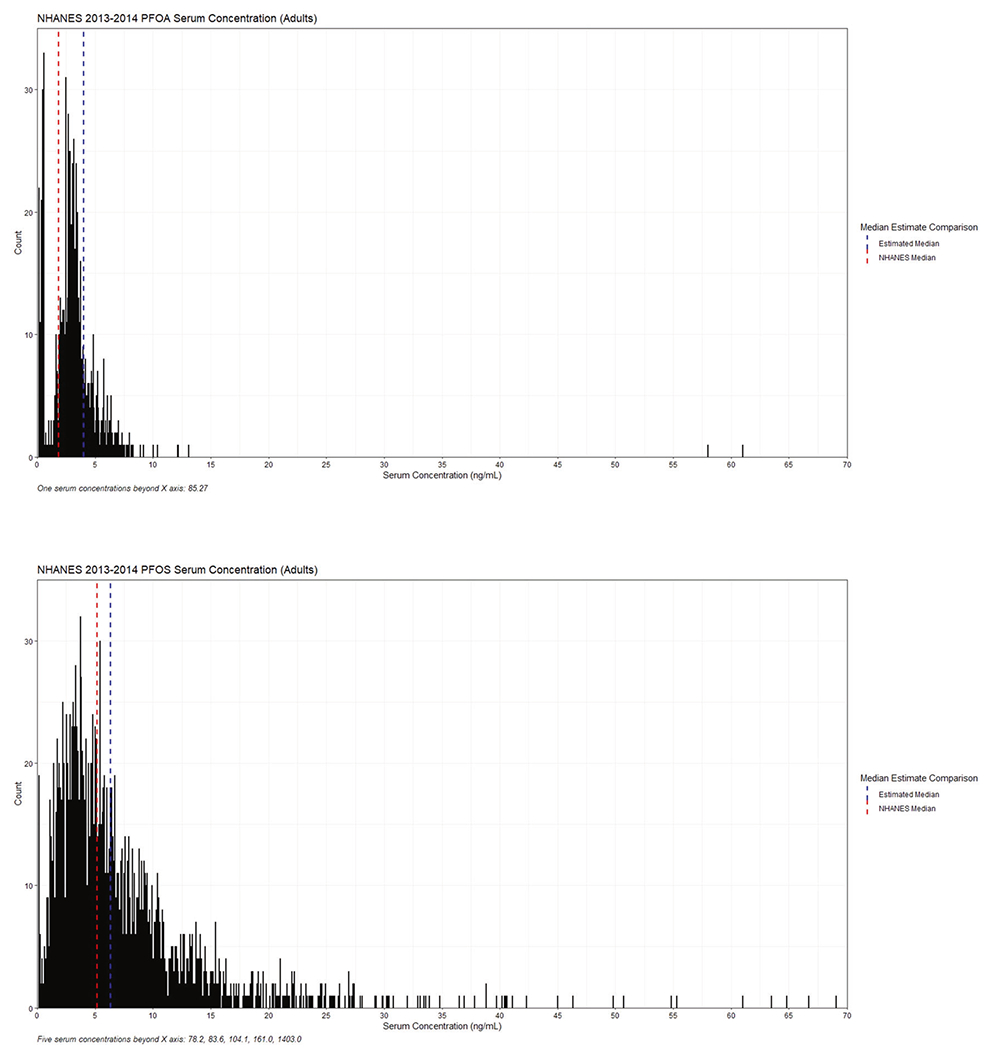
The distribution represents measured serum concentrations (ng/mL) in NHANES. The red and blue lines show the medians for the NHANES distribution and the model estimate respectively. Plots for PFOA and PFOS are shown for adults (age >= 18). NHANES data n = 1988.
DISCUSSION
Comparison to 2011 PFOA and PFOS estimates
The results of this manuscript are updated estimates from Egeghy and Lorber [4] and Lorber and Egeghy [5], with refined methods, newer and increased data, and an additional soil pathway. As with the previous investigations, the intention is to provide screening-level estimates of intake to identify dominant routes and pathway contributions to median human intake. Such analyses inform further measurement studies and mitigations. For PFOA, although the estimated total intake declined sharply from those estimated by Egeghy and Lorber [5, 6], the three dominant routes were the same as reported earlier: dietary ingestion, water ingestion, and dust ingestion. The median daily estimate of PFOA for children decreased from 26 ng/day in Lorber and Egeghy to 14 ng/day. The dominant routes in the previous estimate was dust intake, at 13 ng/day, followed by dietary at 8 ng/day, and then water at 4.8 ng/day. The order of route contribution was the same in this analysis, as dust ingestion contributed 6.3 ng, dietary, 6.0 ng, and water at 1.3 ng/day. Previously reported intakes for adults were 46, 17, and 6.4 ng/day for diet, water, and dust ingestion, and the total intake was 70 ng/day. The updated estimate for adults resulted in a dietary ingestion of 33 ng/day, 4.4 ng/day from water, and 3.1 ng/day from dust ingestion, and a total intake of 40 ng/day.
Total PFOS estimates of intake decreased even more sharply from 50 to 17 ng/day for children, while estimates for adults decreased from 160 to 40 ng/day. For children, original estimates were as follows: 21 ng/day dietary, 18 ng/day dust ingestion, and 10 ng/day water ingestion. In the newer estimate, dust exceed diet: 10 ng/day compared to 5.5 ng/day. Water ingestion also decreased to 1.2 ng/day. For adults, food, water ingestion, and dust ingestion were the dominant PFOS routes, with 120, 36, and 10 ng/day contribution, respectively. In this analysis, diet remained the dominant pathway at 30 ng/day, but dust ingestion increased to 5.2 ng/day, offering a greater contribution to total intake than water ingestion at ng/day. In both scenarios, total estimates of intake decreased, resulting in 40 ng/day for adults and 17 ng/day for children. However, PFOS in dust became the dominant pathway for children and surpassed water for adults. This relative increase is linked to new data: both 2011 PFOA and PFOS estimates used raw data from Strynar and Lindstrom [48], which measured house dust in Ohio and North Carolina. More recently, Goosey and Harrad [38] evaluated concentration data from the US, UK, Canada, Germany, and France, which detected higher levels of PFOS household dust than Strynar and Lindstrom.
Among all media, and for both chemicals, only PFOS in dust increased in median concentrations between this effort and the previous estimates. Because exposure factors were held equal, actual changes in reported concentration data were the primary contributor to lower daily intake estimates across both adults and children. Although the n number of points along the generated lognormal concentration curve was increased from 200 to 20,000, effects were mostly observed on the extreme percentiles of the distribution and not the median. Therefore, this method is most effective for determining degrees of certainty around a median intake rather than estimating high percentile exposures.
Input data assessment
A re-occurring trend in estimates is the lack of contribution from dermal dust, indoor air, outdoor air, and in this estimate, soil. This is not surprising, given the sparsity of data for estimating these exposures, low concentrations measured in media, or the low dermal absorption rates for PFAS in skin. Focus has largely centered on the highest concentration media and dominant exposure pathways, such as drinking water, because of known impacts from contamination and the greater human health implications. Water and dust were the most studied media. Eleven GMs and GSDs were combined to estimate water concentration in this effort, but the media is widely studied in contaminated scenarios given prevalence in wastewater treatment plants, and aqueous film forming foams not considered in this typical exposure estimate [49]. Dust is a sample of convenience, and an integrated medium, which can therefore inform some exposure from consumer products and carpets and was the most studied media. Twenty-four datasets were used for both PFOA and PFOS to estimate dust concentration. Although excluded from the original data search, assembled CONTAM dietary intake data provided 17 diet studies for adults and 7 for “other children,” which were adapted for toddlers in this model. Regarding dust, PFAS exposure generally occurs indoors, and the estimated PFOS GM of 0.0014 ng/m3 for outdoor air is less than the 0.0046 ng/m3 estimated for indoor scenarios. Variation in PFOS concentrations in water exceeds that of any other medium. This was largely influenced by Llorca et al. [44] and Schwanz et al. [45], which reported large SDs. Llorca reported an SD of 812 ng/l in Spanish surface water resulting in a GSD of 17, and an SD of 82, which corresponds to an estimated GSD of 7, in tap water. Schwanz also analyzed Spanish surface water, which produced an estimated GSD of 24 from our model. Finally, Schwanz collected data on PFOS in bottled water in France, which returned a GSD of 19. Despite such variation in water PFOS estimate, Schwanz et al. reported medians below the MDL—introducing a lower GM with respect to other studies. Nonetheless, estimated GMs for PFOS from Llorca were the highest for non-contaminated water at 5.1 and 7.0 ng/l, respectively. In regard to diet, and across all estimates, the CONTAM Panel [23] collected data from Europe resulted in smaller ng/day contributions than Tittlemier et al. [31] and Fromme [32], which were used in both original estimates for PFOA and PFOS. Tittlemier’s estimate was largely based on a single positive measurement of 2.6 ng/g found in roast beef, casting uncertainty over previous food predictions. In addition, the previous papers generated lognormal distributions for adults and children using the same dietary GM and GSD, despite varying diets between adults and children in the US [50, 51]. Data collected by the CONTAM panel are more recent and contains studies from 18 countries for “other children” and 17 for adults. Therefore, in the case of both PFOA and PFOS, estimates from the EFSA report are an improved source in relation to previous food estimates. Dairy had the greatest contribution to mean dietary exposure for toddlers, but this is due to high consumption in younger age groups. For PFOA, diary was both the most consumed food group and had the highest contribution to mean chronic exposure. Usual contributors to PFAS dietary exposure, such as meat and fish, had little PFOA concentration [23].
In addition, intake from water decreased for PFOA and PFOS for both adults and children. Although regulatory actions against PFOA and PFOS, including a SNUR under the Toxic Substances Control Act (TSCA) [52, 53] and voluntary discontinuation, reduced US levels, all water concentration inputs in this model were European. In similar response, regulatory action in Europe has been taken against PFOA and PFOS in water [54, 55]. However, EFSA found that water ingestion played a near negligible role in contribution to PFOA and PFOS intakes [23]. This contrasts the findings of this estimate, but PFOA water estimates varied from 0.10 to 22% in previous publications [51].
Observed decline in reported NHANES medians
Median NHANES measurements of PFOA and PFOS in blood serum has decreased between 2003–2004 and 2013–2014 cycles. Among adults, PFOA-reported medians have dropped from 3.8 to 1.7 ng/ml, and PFOS reported medians have fallen from 20.6 ng/ml in 2003–2004 to 3.9 ng/ml in 2013–2014. This observed decline in serum concentration offers strength to the daily intake estimation method in this manuscript, as daily approximations of intake have fallen since 2011 in accordance with NHANES records.
Comparison to other intake estimates
Modeling efforts by Balk et al. report food ingestion, inhalation of air, and inhalation of dust as primary routes of exposure [56] for Finnish children, with food contributing 90% to the estimated intake for both PFOA and PFOS. In addition, the study reported indirect intake and biotransformation of precursors contributed less than 3% to the total PFOA exposure, and less than 6% to the total PFOS exposure, which was not estimated in this study.
Uncertainties in model parameters
Uncertainty is introduced into the model due to a lack of concordant data. Data were collected in both Europe and the US, and while scenarios modeled were deemed binary, as “typical” or “contaminated,” geography, collection methods, and differing regulations oftentimes result in different levels of exposure [57]. While the described methods could be applied to a specific locale to reduce this variation, the purpose of this manuscript is to provide nonspecific median intake and serum concentration estimates for Americans. Furthermore, data were collected from 2011 to 2017 and compared to 2013–2014 NHANES data. Variation across time was not addressed in this analysis, although the relatively large 7-year window allowed for greater data paucity.
In addition, no data on direct exposures from contact with furnishings (e.g., carpet) or use of consumer products (e.g., stain removers) were used. Hand-to-mouth transfer from carpets and furniture treated with stain repellants have been identified as significant sources of ingestion, particularly for children [58, 59]. Targeted measurements of chemical constituents of a number of household consumer products have found several different perfluorinated compounds [60]. Precursors to PFOA and PFOS were also not included in this assessment, but likely contribute to both PFOS and PFOA body burden [61–63]. Their absence is a likely source of underreported exposure estimates. Furthermore, exposure was estimated for a 2-year-old child and a typical adult, using the exposure factors and equations in Table 1. For example, PFOA and PFOS estimates vary for males and females [28], and estimated volume of distributions are likely different, as demonstrated in cynomolgus monkeys [64]. Therefore, individuals with exposure factors representative of the target population will allow for more granular and effective exposure estimates.
Sensitivity analysis and dynamical model
PK values, such as Vd and kP, are also debated within literature, as Vd values for PFOS can vary by an order of magnitude [4]. To evaluate the effect of varying Vd values on the serum concentration estimate, a sensitivity analysis was performed for the adult daily intake of PFOA of 40 ng/day and the daily intake of PFOS of 40 ng/day. To conduct the sensitivity analysis, the Vd values used in this estimate were substituted for two other reported values among the literature while maintaining elimination rates of 0.00083 1/day for PFOA and 0.00039 1/day for PFOS.
For PFOA, the Vd used in this estimate was 170 ml/kg [25] and was compared to 140 and 185 ml/kg, estimated from studies of cynomolgus monkeys [64, 65]. These different Vd values resulted in the following serum estimates: 140 ml/kg; 4.87 ng/ml, 170 ml/kg; 4.02 ng/ml, 185 ml/kg; 3.69 ng/ml. Within the steady-state model, Vd has a linear relationship with serum concentration; therefore, the estimate is highly reliant on an accurate Vd. This makes the volume of distribution particularly sensitive in this model, as in many cases, this model uses summary statistics from multiple concentration data sources, such that one outlier will not significantly weigh the median intake estimate as the Vd does.
For PFOS, the steady-state relationship between Vd and the serum concentration is again linear: a Vd of 300 ml/kg [66] resulted in a 4.84 ng/ml serum concentration among adults, and a Vd of 3000 ml/kg [4] returned 0.484 ng/ml. The 3000 ml/kg is considered a high Vd, as previous literature has suggested that a stronger estimate is likely closer to the other Vd values used in this analysis [32, 67]. Vd used in this estimate, 230 ml/kg [25], returned a serum concentration of 6.31 ng/ml. Because of the simplicity of this linear relationship, the dynamical form of the steady-state equation is included in Fig. 4.
Fig. 4. A sensitivity analysis of steady-state and dynamical models for PFOA and PFOS in Adults with variation in volume of distribution (Vd), and the corresponding impact on the serum concentration (ng/mL).
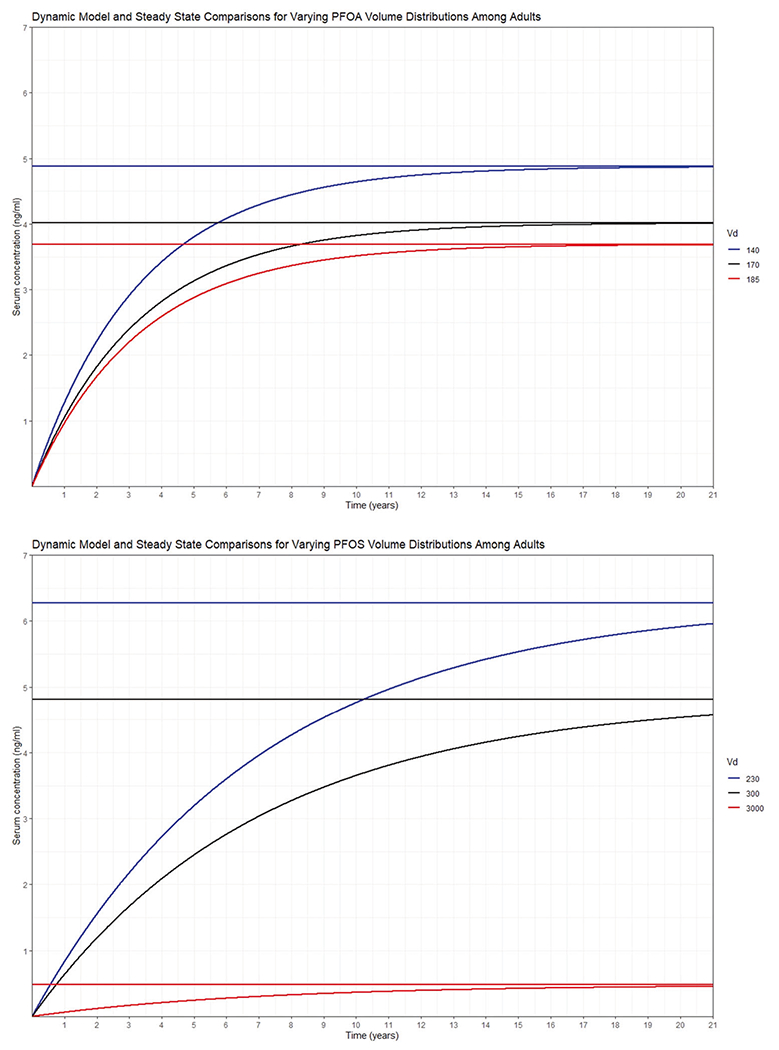
The red, blue, and black lines represent different Vd values. The steady-state model returns a horizontal line, whereas the dynamical model is the curved line that approaches steady-state over time. The first plot is PFOA in adults and the second is PFOS in adults.
As suggested by the dynamical curves in Fig. 4, the half-lives of PFOA and PFOS are 2.28 and 4.87 years, respectively. Steady-state estimates may not be reliable for young children because of the combination of low elimination rates and the rapidly changing physiological and exposure factors during early life. Although a similar dynamic model has been used for children in past research [56], and improvements have been made to that model, including considerations for PFAS transferred from the mother at birth [68], we chose to restrict our comparison to NHANES serum concentrations to adults, though plots of NHANES comparisons for both adults and children are available in the Supplemental information document (Supplementary Figs 1 and 2). PFOA and PFOS are legacy chemicals and have undergone much regulation between the 2003–2004 and the 2013–2014 NHANES cycles, which is evidenced in both the NHANES data and the daily intake estimates in the original 2011 papers and these estimates. However, because of the low elimination rate of these chemicals, a steady-state adjustment may take 20 years—exceeding the time between the 2003–2004 and 2013–2014 NHANES data releases. Based on these observations, PFOS levels are expected to decline more rapidly than PFOA levels in future NHANES releases.
CONCLUSIONS
Although evaluating the dominant routes of exposure to PFAS is fraught with uncertainty, the methods presented here provide a framework for investigating predominant exposure pathways and intake. The method is applicable for both contaminated and non-contaminated scenarios and can be applied to create a distribution of intake values for any route of exposure across any population or individuals. PFOA and PFOS are the most studied PFAS [53, 69] and provide the most input data, but the deterministic analysis is possible for any chemical, requiring only summary statistics from at least one study per exposure-related medium.
Despite several appreciable sources of uncertainty, the similarity between blood serum concentration estimates from this model and measurements reported in the 2013–2014 NHANES grant reasonable validity to this approach. In all three dominant routes—water, dust, and dietary ingestion—estimates of PFOS and PFOA exposure for both adults and children have decreased since 2011, corresponding with observed decrease in concentrations. The addition of estimates of intake from soil did not contribute significantly to the aggregate exposure estimates.
Construction of a diet module, a more robust PK model, and improved estimates of Vd and kP would result in stronger estimates from this model. Furthermore, continued measurement of PFAS in media will continue to benefit models and predictions such as these. Increased data on concentration and PK values will allow this demonstrated framework to be applied to other PFAS.
Supplementary Material
ACKNOWLEDGEMENTS
Paul Schlosser, Rocky Goldsmith, Rogelio Tornero-Velez, and Andrew Gillespie of EPA’s Office of Research and Development provided vital reviews and advice, especially on enhancements of the PK model and sensitivity analysis. This work built upon PFAS data curation work led by Valerie Zartarian. This research was supported by the National Student Service Contract Number 68HERH20D0003. The research was also supported by student service contractor Hunter Fisher and Pathways intern Ashley Mullikin. The curation, analysis, and presentation in this study adhered to an approved quality assurance project plan, which was developed with advice from EPA’s James Noel.
Footnotes
COMPETING INTERESTS
The authors declare no competing interests.
Supplementary information The online version contains supplementary material available at https://doi.org/10.1038/s41370-021-00374-w.
REFERENCES
- 1.Agency for Toxic Substances Disease Registry. Toxicological profile for perfluoroalkyls. Draft for public comment. Updated June 2018. Atlanta, Georgia: US Department of Health and Human Services, Public Health Service. http://www.atsdr.cdc.gov/toxprofiles/tp200.pdf (2018). Accessed 31 Aug 2020. [Google Scholar]
- 2.US Environmental Protection Agency. Perfluoroalkyl sulfonates; Significant New Use Rule. 40 CFR 721 ed. Federal Register; 2002. 72854–67. [Google Scholar]
- 3.US Environmental Protection Agency. PFAS action plan: program update February 2020, Research Triangle Park, North Carolina: Office of Air Quality Planning & Standards. Updated February 27, 2020. https://www.epa.gov/pfas/pfas-action-plan-program-update-february-2020 (2020). Accessed 31 Aug 2020.
- 4.Egeghy PP, Lorber M. An assessment of the exposure of Americans to perfluorooctane sulfonate: a comparison of estimated intake with values inferred from NHANES data. J Exposure Sci Environ Epidemiol. 2011;21:150–68. [DOI] [PubMed] [Google Scholar]
- 5.Lorber M, Egeghy PP. Simple intake and pharmacokinetic modeling to characterize exposure of Americans to perfluoroctanoic acid, PFOA. Environ Sci Technol. 2011;45:8006–14. [DOI] [PubMed] [Google Scholar]
- 6.Vallero D. Translating diverse environmental data into reliable information: how to coordinate evidence from different sources. Amsterdam, The Netherlands; Academic Press; 2017. [Google Scholar]
- 7.Vestergren R, Cousins IT. Tracking the pathways of human exposure to perfluorocarboxylates. Environ Sci Technol. 2009;43:5565–75. [DOI] [PubMed] [Google Scholar]
- 8.Domingo JL. Health risks of dietary exposure to perfluorinated compounds. Environ Int. 2012;40:187–95. [DOI] [PubMed] [Google Scholar]
- 9.Haug LS, Huber S, Becher G, Thomsen C. Characterisation of human exposure pathways to perfluorinated compounds—comparing exposure estimates with biomarkers of exposure. Environ Int. 2011;37:687–93. [DOI] [PubMed] [Google Scholar]
- 10.Hornung RW, Reed LD. Estimation of average concentration in the presence of nondetectable values. Appl Occup Environ Hyg. 1990;5:46–51. [Google Scholar]
- 11.Pleil JD, Sobus JR, Stiegel MA, Hu D, Oliver KD, Olenick C, et al. Estimating common parameters of lognormally distributed environmental and biomonitoring data: Harmonizing disparate statistics from publications. J Toxicol Environ health Part B. 2014;17:341–68. [DOI] [PubMed] [Google Scholar]
- 12.Hozo SP, Djulbegovic B, Hozo I. Estimating the mean and variance from the median, range, and the size of a sample. BMC Med Res Methodol. 2005;5:13. [DOI] [PMC free article] [PubMed] [Google Scholar]
- 13.Ramirez A, Cox C. Improving on the range rule of thumb. Rose-Hulman Undergrad Math J. 2012;13:1. [Google Scholar]
- 14.Strom DJ, Stansbury PS. Determining parameters of lognormal distributions from minimal information. AIHAJ. 2000;61:877–80. [DOI] [PubMed] [Google Scholar]
- 15.Ott WR. A physical explanation of the lognormality of pollutant concentrations. J Air Waste Manag Assoc. 1990;40:1378–83. [DOI] [PubMed] [Google Scholar]
- 16.Lorber M. Exposure of Americans to polybrominated diphenyl ethers. J Exposure Sci Environ Epidemiol. 2008;18:2–19. [DOI] [PubMed] [Google Scholar]
- 17.US Environmental Protection Agency. Exposure factors handbook. Washington, DC: Office of Research and Development; 1997;20460:2–6.. [Google Scholar]
- 18.US Environmental Protection Agency. Child-specific exposure factors handbook (final report). Washington, DC: National Center for Environmental Assessment, Office of Research and Development (EPA/600/R-08/135); 2008. [Google Scholar]
- 19.Pang Y, MacIntosh DL, Camann DE, Ryan PB. Analysis of aggregate exposure to chlorpyrifos in the NHEXAS-Maryland investigation. Environ Health Perspect. 2002;110:235–40. [DOI] [PMC free article] [PubMed] [Google Scholar]
- 20.Hubal EAC, Egeghy PP, Leovic KW, Akland GG. Measuring potential dermal transfer of a pesticide to children in a child care center. Environ Health Perspect. 2006;114:264–9. [DOI] [PMC free article] [PubMed] [Google Scholar]
- 21.Fasano W, Kennedy G, Szostek B, Farrar D, Ward R, Haroun L, et al. Penetration of ammonium perfluorooctanoate through rat and human skin in vitro. Drug Chem Toxicol. 2005;28:79–90. [DOI] [PubMed] [Google Scholar]
- 22.US Environmental Protection Agency. Exposure factors handbook – soil and dust ingestion. ExpoBox. https://www.epa.gov/expobox/exposure-factors-handbook-chapter-5 (2017). [Google Scholar]
- 23.Knutsen HK, Alexander J, Barregård L, Bignami M, Brüschweiler B, Ceccatelli S, et al. Risk to human health related to the presence of perfluorooctane sulfonic acid and perfluorooctanoic acid in food. EFSA J. 2018;16:e05194. [DOI] [PMC free article] [PubMed] [Google Scholar]
- 24.Vestergren R, Orata F, Berger U, Cousins IT. Bioaccumulation of perfluoroalkyl acids in dairy cows in a naturally contaminated environment. Environ Sci Pollut Res. 2013;20:7959–69. [DOI] [PubMed] [Google Scholar]
- 25.Thompson J, Lorber M, Toms L-ML, Kato K, Calafat AM, Mueller JF. Use of simple pharmacokinetic modeling to characterize exposure of Australians to perfluorooctanoic acid and perfluorooctane sulfonic acid. Environ Int. 2010;36:390–7. [DOI] [PubMed] [Google Scholar]
- 26.Bartell SM, Calafat AM, Lyu C, Kato K, Ryan PB, Steenland K. Rate of decline in serum PFOA concentrations after granular activated carbon filtration at two public water systems in Ohio and West Virginia. Environ Health Perspect. 2010;118:222–8. [DOI] [PMC free article] [PubMed] [Google Scholar]
- 27.Olsen GW, Burris JM, Ehresman DJ, Froehlich JW, Seacat AM, Butenhoff JL, et al. Half-life of serum elimination of perfluorooctanesulfonate, perfluorohexanesulfonate, and perfluorooctanoate in retired fluorochemical production workers. Environ Health Perspect. 2007;115:1298–305. [DOI] [PMC free article] [PubMed] [Google Scholar]
- 28.Calafat AM, Wong L-Y, Kuklenyik Z, Reidy JA, Needham LL. Polyfluoroalkyl chemicals in the US population: data from the National Health and Nutrition Examination Survey (NHANES) 2003–2004 and comparisons with NHANES 1999–2000. Environ Health Perspect. 2007;115:1596–602. [DOI] [PMC free article] [PubMed] [Google Scholar]
- 29.Xiao F, Simcik MF, Halbach TR, Gulliver JS. Perfluorooctane sulfonate (PFOS) and perfluorooctanoate (PFOA) in soils and groundwater of a US metropolitan area: migration and implications for human exposure. Water Res. 2015;72:64–74. [DOI] [PubMed] [Google Scholar]
- 30.Rankin K, Mabury SA, Jenkins TM, Washington JW. A North American and global survey of perfluoroalkyl substances in surface soils: distribution patterns and mode of occurrence. Chemosphere. 2016;161:333–41. [DOI] [PubMed] [Google Scholar]
- 31.Tittlemier SA, Pepper K, Seymour C, Moisey J, Bronson R, Cao X-L, et al. Dietary exposure of Canadians to perfluorinated carboxylates and perfluorooctane sulfonate via consumption of meat, fish, fast foods, and food items prepared in their packaging. J Agric Food Chem. 2007;55:3203–10. [DOI] [PubMed] [Google Scholar]
- 32.Fromme H, Tittlemier SA, Völkel W, Wilhelm M, Twardella D. Perfluorinated compounds–exposure assessment for the general population in western countries. Int J Hyg Environ Health. 2009;212:239–70. [DOI] [PubMed] [Google Scholar]
- 33.Endres CJ. nhanesA: NHANES data retrieval. 2021. https://cran.r-project.org/web/packages/nhanesA/vignettes/Introducing_nhanesA.html2021. Accessed 31 Mar 2021.
- 34.R Core Team. R: a language and environment for statistical computing. Computing RFfS, editor. R Core Team: Vienna, Austria; 2019. [Google Scholar]
- 35.Shoeib M, Harner T, Webster MG, Lee SC. Indoor sources of poly-and perfluorinated compounds (PFCS) in Vancouver, Canada: implications for human exposure. Environ Sci Technol. 2011;45:7999–8005. [DOI] [PubMed] [Google Scholar]
- 36.Eriksson U, Kärrman A. World-wide indoor exposure to polyfluoroalkyl phosphate esters (PAPs) and other PFASs in household dust. Environ Sci Technol. 2015;49:14503–11. [DOI] [PubMed] [Google Scholar]
- 37.Fraser AJ, Webster TF, Watkins DJ, Strynar MJ, Kato K, Calafat AM, et al. Polyfluorinated compounds in dust from homes, offices, and vehicles as predictors of concentrations in office workers’ serum. Environ Int. 2013;60:128–36. [DOI] [PMC free article] [PubMed] [Google Scholar]
- 38.Goosey E, Harrad S. Perfluoroalkyl compounds in dust from Asian, Australian, European, and North American homes and UK cars, classrooms, and offices. Environ Int. 2011;37:86–92. [DOI] [PubMed] [Google Scholar]
- 39.Karásková P, Venier M, Melymuk L, Bečanová J, Vojta š, Prokeţ R, et al. Perfluorinated alkyl substances (PFASs) in household dust in Central Europe and North America. Environ Int. 2016;94:315–24. [DOI] [PubMed] [Google Scholar]
- 40.Knobeloch L, Imm P, Anderson H. Perfluoroalkyl chemicals in vacuum cleaner dust from 39 Wisconsin homes. Chemosphere. 2012;88:779–83. [DOI] [PubMed] [Google Scholar]
- 41.Lankova D, Svarcova A, Kalachova K, Lacina O, Pulkrabova J, Hajslova J. Multianalyte method for the analysis of various organohalogen compounds in house dust. Analytica Chim Acta. 2015;854:61–9. [DOI] [PubMed] [Google Scholar]
- 42.Xu Z, Fiedler S, Pfister G, Henkelmann B, Mosch C, Völkel W, et al. Human exposure to fluorotelomer alcohols, perfluorooctane sulfonate and perfluorooctanoate via house dust in Bavaria, Germany. Sci Total Environ. 2013;443:485–90. [DOI] [PubMed] [Google Scholar]
- 43.Winkens K, Koponen J, Schuster J, Shoeib M, Vestergren R, Berger U, et al. Perfluoroalkyl acids and their precursors in indoor air sampled in children’s bedrooms. Environ Pollut. 2017;222:423–32. [DOI] [PubMed] [Google Scholar]
- 44.Llorca M, Farré M, Picó Y, Müller J, Knepper TP, Barceló D. Analysis of perfluoroalkyl substances in waters from Germany and Spain. Sci Total Environ. 2012;431:139–50. [DOI] [PubMed] [Google Scholar]
- 45.Schwanz TG, Llorca M, Farré M, Barceló D. Perfluoroalkyl substances assessment in drinking waters from Brazil, France and Spain. Sci Total Environ. 2016;539:143–52. [DOI] [PubMed] [Google Scholar]
- 46.Shafique U, Schulze S, Slawik C, Böhme A, Paschke A, Schüürmann G. Perfluoroalkyl acids in aqueous samples from Germany and Kenya. Environ Sci Pollut Res. 2017;24:11031–43. [DOI] [PubMed] [Google Scholar]
- 47.Ullah S, Alsberg T, Berger U. Simultaneous determination of perfluoroalkyl phosphonates, carboxylates, and sulfonates in drinking water. J Chromatogr A. 2011;1218:6388–95. [DOI] [PubMed] [Google Scholar]
- 48.Strynar MJ, Lindstrom AB. Perfluorinated compounds in house dust from Ohio and North Carolina, USA. Environ Sci Technol. 2008;42:3751–6. [DOI] [PubMed] [Google Scholar]
- 49.Hu XC, Andrews DQ, Lindstrom AB, Bruton TA, Schaider LA, Grandjean P, et al. Detection of poly-and perfluoroalkyl substances (PFASs) in US drinking water linked to industrial sites, military fire training areas, and wastewater treatment plants. Environ Sci Technol Lett. 2016;3:344–50. [DOI] [PMC free article] [PubMed] [Google Scholar]
- 50.Nguyen VK, Kahana A, Heidt J, Polemi K, Kvasnicka J, Jolliet O, et al. A comprehensive analysis of racial disparities in chemical biomarker concentrations in United States women, 1999–2014. Environ Int. 2020;137:105496. [DOI] [PMC free article] [PubMed] [Google Scholar]
- 51.Hu XC, Tokranov AK, Liddie J, Zhang X, Grandjean P, Hart JE, et al. Tap water contributions to plasma concentrations of poly-and perfluoroalkyl substances (PFAS) in a nationwide prospective cohort of US women. Environ Health Perspect. 2019;127:067006. [DOI] [PMC free article] [PubMed] [Google Scholar]
- 52.Dionisio KL, Frame AM, Goldsmith M-R, Wambaugh JF, Liddell A, Cathey T, et al. Exploring consumer exposure pathways and patterns of use for chemicals in the environment. Toxicol Rep. 2015;2:228–37. [DOI] [PMC free article] [PubMed] [Google Scholar]
- 53.US Environmental Protection Agency. Overview of PFAS actions under TSCA: Office of Air Quality Planning & Standards. Updated August 10, 2020. https://www.epa.gov/assessing-and-managing-chemicals-under-tsca/risk-management-and-polyfluoroalkyl-substances-pfas (2020). Accessed 28 Sept 2020.
- 54.European Environment Agency. Emerging chemical risks in Europe—’PFAS’. https://www.eea.europa.eu/themes/human/chemicals/emerging-chemical-risks-in-europe (2020). Accessed 28 Sept 2020.
- 55.European Comission. Directive of the European Parliament and of the Council on the quality of water intended for human consumption. 2017. https://eur-lex.europa.eu/resource.html?uri=cellar:8c5065b2-074f-11e8-b8f5-01aa75ed71a1.0016.02/DOC_1&format=PDF. Accessed 6 Oct 2020.
- 56.Balk FG, Pütz KW, Ribbenstedt A, Gomis MI, Filipovic M, Cousins IT. Children’s exposure to perfluoroalkyl acids–a modelling approach. Environ Sci Process Impacts. 2019;21:1875–86. [DOI] [PubMed] [Google Scholar]
- 57.Barton KE, Starling AP, Higgins CP, McDonough CA, Calafat AM, Adgate JL. Sociodemographic and behavioral determinants of serum concentrations of per- and polyfluoroalkyl substances in a community highly exposed to aqueous film-forming foam contaminants in drinking water. Int J Hyg Environ Health. 2020;223:256–66. [DOI] [PMC free article] [PubMed] [Google Scholar]
- 58.Agency for Toxic Substances and Disease Registry. Toxicological profile for perfluoroalkyls. Draft for public comment. Atlanta, GA: Department of Health and Human Services, Public Health Service, United States Department of Health and Human Services. https://www.atsdr.cdc.gov/substances/toxsubstance.asp?toxid=237 (2015). [Google Scholar]
- 59.Agency for Toxic Substances and Disease Registry. Toxicological Profile for Perfluoroalkyls. 2021. https://www.atsdr.cdc.gov/toxprofiles/tp200.pdf. Accessed 5 Aug 2021. [PubMed]
- 60.Liu X. Characterise sources for exposure assessment of chemicals in indoor environment. London, England: SAGE Publications Sage UK; 2018. [DOI] [PMC free article] [PubMed] [Google Scholar]
- 61.Gebbink WA, Berger U, Cousins IT. Estimating human exposure to PFOS isomers and PFCA homologues: the relative importance of direct and indirect (precursor) exposure. Environ Int. 2015;74:160–9. [DOI] [PubMed] [Google Scholar]
- 62.Vestergren R, Cousins IT, Trudel D, Wormuth M, Scheringer M. Estimating the contribution of precursor compounds in consumer exposure to PFOS and PFOA. Chemosphere. 2008;73:1617–24. [DOI] [PubMed] [Google Scholar]
- 63.Xiao F, Hanson RA, Golovko SA, Golovko MY, Arnold WA. PFOA and PFOS are generated from zwitterionic and cationic precursor compounds during water disinfection with chlorine or ozone. Environ Sci Technol Lett. 2018;5:382–8. [Google Scholar]
- 64.Butenhoff J, Kennedy G Jr, Hinderliter P, Lieder P, Jung R, Hansen K, et al. Pharmacokinetics of perfluorooctanoate in cynomolgus monkeys. Toxicological Sci. 2004;82:394–406. [DOI] [PubMed] [Google Scholar]
- 65.Andersen ME, Clewell HJ III, Tan Y-M, Butenhoff JL, Olsen GW. Pharmacokinetic modeling of saturable, renal resorption of perfluoroalkylacids in monkeys—probing the determinants of long plasma half-lives. Toxicology. 2006;227:156–64. [DOI] [PubMed] [Google Scholar]
- 66.Harada K, Saito N, Sasaki K, Inoue K, Koizumi A. Perfluorooctane sulfonate contamination of drinking water in the Tama River, Japan: estimated effects on resident serum levels. Bull Environ Contamination Toxicol. 2003;71:0031–6. [DOI] [PubMed] [Google Scholar]
- 67.Trudel D, Horowitz L, Wormuth M, Scheringer M, Cousins IT, Hungerbühler K. Estimating consumer exposure to PFOS and PFOA. Risk Anal. 2008;28:251–69. [DOI] [PubMed] [Google Scholar]
- 68.Gomis MI, Vestergren R, MacLeod M, Mueller JF, Cousins IT. Historical human exposure to perfluoroalkyl acids in the United States and Australia reconstructed from biomonitoring data using population-based pharmacokinetic modelling. Environ Int. 2017;108:92–102. [DOI] [PubMed] [Google Scholar]
- 69.US Environmental Protection Agency. Basic information on PFAS. Research Triangle Park, North Carolina: Office of Air Quality Planning & Standards. Updated December 6, 2018. https://www.epa.gov/pfas/basic-information-pfas (2018). [Google Scholar]
Associated Data
This section collects any data citations, data availability statements, or supplementary materials included in this article.