Abstract
Accurate quantification of renal fibrosis has profound importance in the assessment of chronic kidney disease (CKD). Visual analysis of a biopsy stained with trichrome under the microscope by a pathologist is the gold standard for evaluation of fibrosis. Trichrome helps to highlight collagen and ultimately interstitial fibrosis. However, trichrome stains are not always reproducible, can underestimate collagen content and are not sensitive to subtle fibrotic patterns. Using the Dual-mode emission and transmission (DUET) microscopy approach, it is possible to capture both brightfield and fluorescence images from the same area of a tissue stained with hematoxylin and eosin (H&E) enabling reproducible extraction of collagen with high sensitivity and specificity. Manual extraction of spectrally overlapping collagen signals from tubular epithelial cells and red blood cells is still an intensive task. We employed a UNet++ architecture for pixel-level segmentation and quantification of collagen using 760 whole slide image (WSI) patches from six cases of varying stages of fibrosis. Our trained model (Deep-DUET) used the supervised extracted collagen mask as ground truth and was able to predict the extent of collagen signal with a MSE of 0.05 in a holdout testing set while achieving an average AUC of 0.94 for predicting regions of collagen deposits. Expanding this work to the level of the WSI can greatly improve the ability of pathologists and machine learning (ML) tools to quantify the extent of renal fibrosis reproducibly and reliably.
Keywords: Deep Learning, Microscopy, Whole Slide Image, Digital Pathology, Fibrosis, Kidney Disease
1. INTRODUCTION
Renal fibrosis is the process by which extracellular matrix (ECM) is deposited in the tubules, interstitium, and glomeruli as a result of the progression of a variety of chronic kidney diseases1, 2. ECM components, including collagen fibers, accumulate as a result of an overactive or failed wound healing response to excessive stresses sustained by injured renal components1, 3. Although the prevalence of renal fibrosis is a common symptom in kidney diseases ranging from diabetic nephropathy to chronic allograft rejection, there are a wide variety of pathways that are involved in its pathogenesis4, 5. Because of this diversity in underlying cause, the study of renal fibrosis has garnered a large amount of interest in a number of pathology communities.
The gold standard for evaluation of renal fibrosis is through the preparation of histology sections using histochemical stains to highlight structures of interest. These stains include hematoxylin and eosin (H&E), periodic acid schiff (PAS), and trichrome to highlight nuclei and extracellular matrix, basement membranes, and collagen, respectively. However, these stains are not innately specific at the cellular level. Technical expertise in preparing stained histological sections, differing suppliers and protocols for handling of reagents, and whole slide image (WSI) scanning can result in variability in fibrosis grading between institutions. Furthermore, the precise quantification of fibrosis between patients is an exceedingly difficult task for even experienced pathologists. This is partially due to the diffuse nature of collagen deposition in the renal cortex. Diagnostic criteria for fibrosis typically involve semi-quantitative determinations of total presence of fibrosis in a specific biopsy. Expanding the quantification of renal fibrosis is an essential step towards characterizing the heterogeneous clinical manifestations and developing specific treatment options.
In an effort to increase the ability of pathologists and diagnostic machine learning (ML) tools to discern collagen fibers in relation to clinical features of H&E stained biopsies, we have developed the dual-mode emission transmission (DUET) microscopy technique6, 7. Using this technique, the ability to capture pixel-matched brightfield histology and fluorescence images is demonstrated. This method allows collagen detection from fluorescence images using standard spectral unmixing tools including spectral phasor approach8. However, as the goal in this line of research is to specifically capture tubulointerstitial fibrosis and glomerulosclerosis, additional processing of these images is required. Manual segmentation of tubular epithelial cells, red blood cells, and smooth muscle represent a highly labor-intensive task which is also difficult to automate with conventional spectral unmixing methods. Due to the complex nature of these images, this problem is well suited for the application of deep learning (DL), specifically a convolutional neural network (CNN) to automate the process.
2. Methods
Image Acquisition:
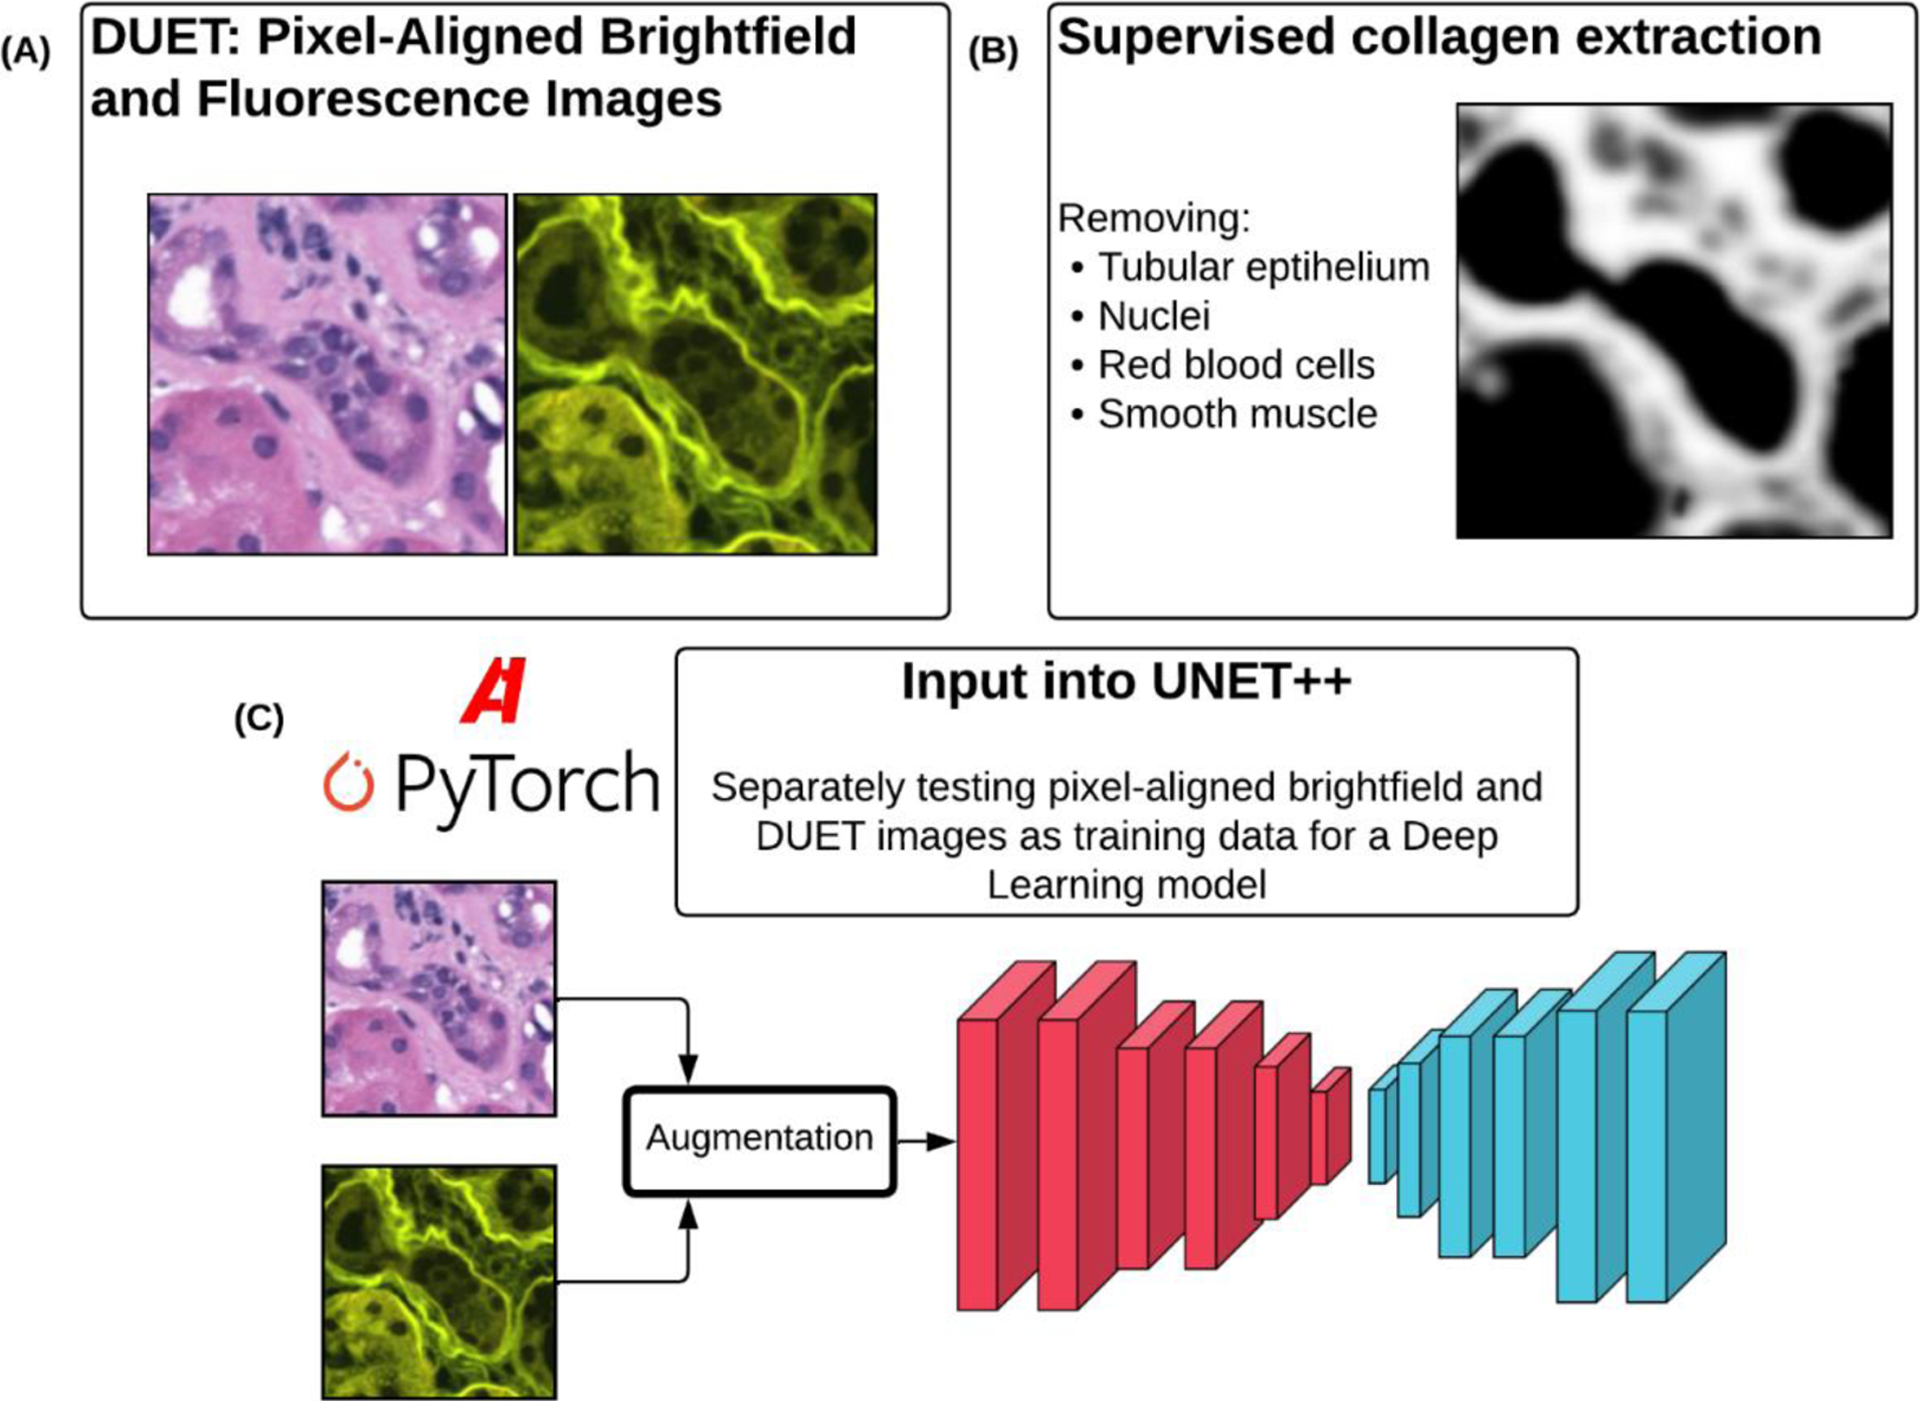
DUET microscopy was used on six cases of varying grades of fibrosis to generate both H&E stained brightfield images and fluorescent images highlighting collagen deposits (Figure 1A). DUET images are generated using epifluorescent excitation of H&E stained tissue using a 405 nm LED (LZ1-00UB00-LED Engin) directed towards the sample using a broadband dichroic (Di03-R405-t1-25 × 36, Semrock) and focused using a 10X objective (Nikon, Plan Apo, 0.45 NA)6. Due to the large time requirement in manual annotation of ground truth (GT) collagen masks, a small dataset of 760 512×512 images were available for this study (Figure 1B). While only three cases were examined, these cases were selected from varying stages of interstitial fibrosis. This additional variation should expose the model to a larger amount of diversity. GT masks for this study were continuous grayscale images representing strength of collagen signal at each pixel extracted using spectral phasor method explained elsewhere6. These continuous masks were then binarized with a uniform threshold value to allow for binary prediction of the locations of collagen deposits.
Figure 1:

(A) Example of DUET images allowing for collection of both brightfield and fluorescence images from H&E slides. (B) Supervised unmixing of fluorescence images to obtain mask of collagen in each image. (C) Deep learning model (UNET++) used with both sets of image data as input to predict underlying collagen distribution.
DL Approach:
Because of the relatively small sample size, one of the first technical concerns was how to maximize the utility of image data for training data-hungry models. This was accomplished by chaining together multiple paired image augmentation methods. Transformations were performed using the Albumentations library and included random horizontal and vertical flipping, affine transforms, perspective shifts, and random scaling and rotation (Figure 1C)9. Augmentation, in conjunction with weight decay and learning rate scheduling helped reduce the risk of overfitting in our experiments.
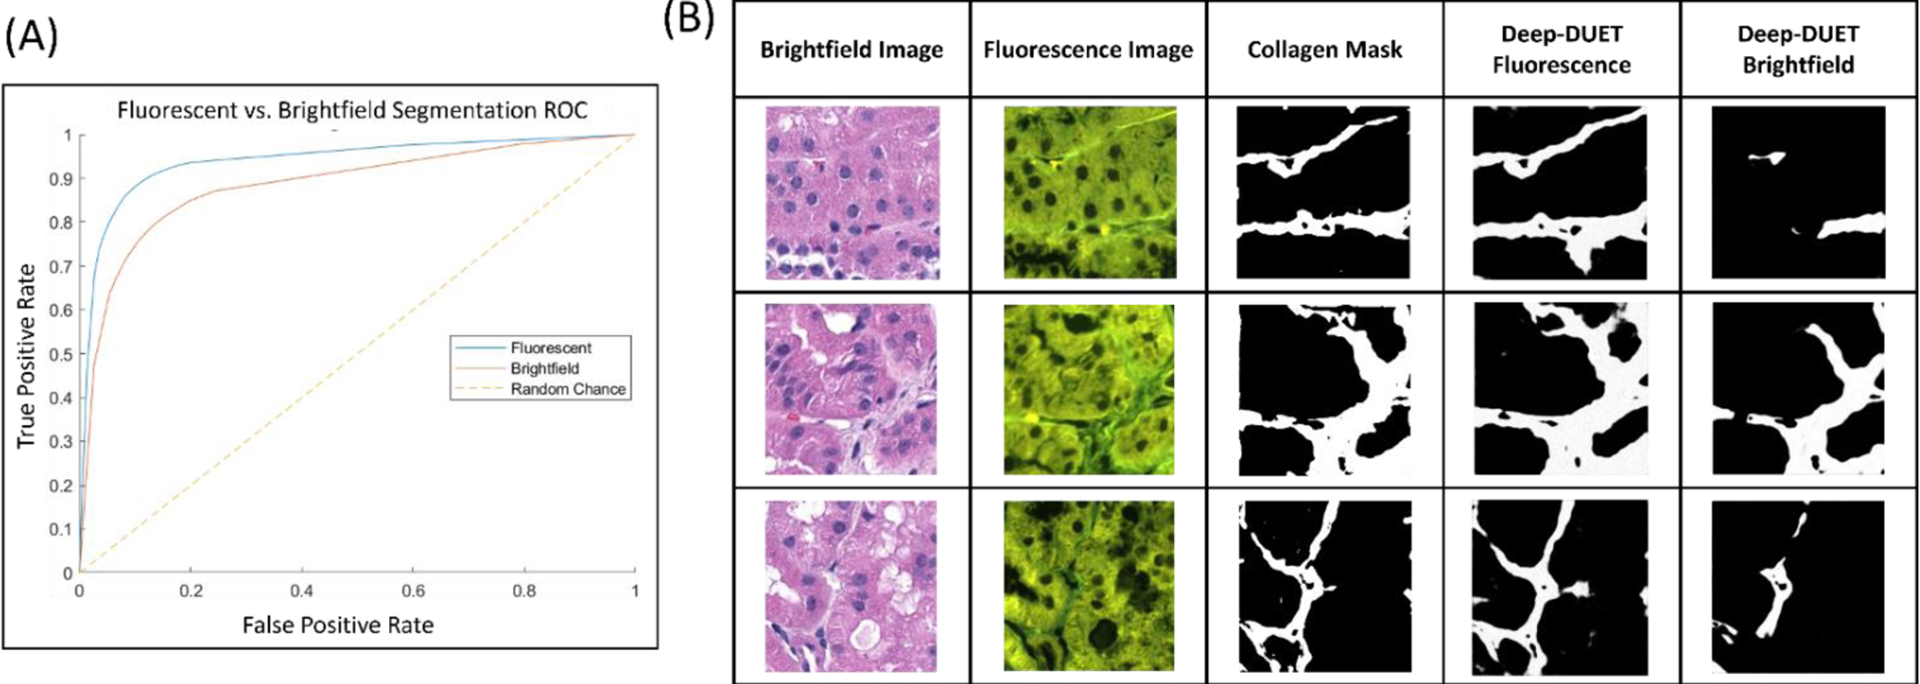
The CNN architecture we used in our experiments was Unet++ as implemented in the Segmentation Models Pytorch library in Python (Figure 1C)10. Softmax activation in the penultimate layer allowed us to predict regions of collagen deposits in the GT masks. Adam was used to optimize the Dice loss while training of the network (Figure 1C). Multiple networks were trained using the different kinds of data that are produced using DUET and the segmentation performance in terms of MSE as well as area under the receiver operating curve (ROC) were compared (Figure 2A).
Figure 2:

(A) Performance comparison for brightfield and DUET fluorescence models trained on the same set of training images (brightfield AUC = 0.89, Deep-DUET AUC = 0.94). (B) Example prediction outputs from both fluorescence and the same model trained using brightfield images. Missing regions of collagen were identified throughout predictions made using the model trained on brightfield data.
3. RESULTS
The best performing model was obtained using the DUET fluorescence images as input. Interestingly, what was observed when using brightfield images as input was that the network was not able to distinguish all regions of collagen resulting in sporadic predictions (Figure 2B). This was particularly evident in images where tubules were very close together as in the slide with the lowest amount of interstitial fibrosis11. The observation that the network trained using brightfield images as input under-predicted collagen deposits is further supported by the metrics reported in Table 1. We also observed that the predictions using Deep-DUET were more consistent than those made by the model trained using brightfield images. Erroneous predictions by Deep-DUET were constrained to specific regions within an image (select tubular casts, for example) whereas the brightfield model had several images which completely failed to predict collagen.
Table 1:
Segmentation metrics over 153 holdout testing images, ± indicates one standard deviation
| Network | Fluorescence | Brightfield | |
|---|---|---|---|
| Metric Value | Dice | 0.89±0.06 | 0.82±0.15 |
| MSE | 0.09±0.05 | 0.13±0.09 | |
| Optimal AUC | 0.94±0.05 | 0.89±0.08 | |
| Sensitivity | 0.86±0.15 | 0.79±0.17 | |
Initial experiments revealed that the contents of select training images had a significant impact on the model’s ability to predict interstitial collagen. Renal biopsies are comprised of a number of tissues including tubules (whose morphology is variable depending on cortical depth), glomeruli, and various blood vessels. As the goal of this work was to accurately segment regions of collagen deposits across a given biopsy, the resulting model should be robust to the varying tissue contents of input images. We observed that Deep-DUET using fluorescence image significantly outperformed the brightfield model in images containing multiple different types of tissue, in particular in recognizing very thin regions of collagen between tubules (Figure 2). This is a promising result towards the eventual application of this model on a WSI-basis for the precise quantification of interstitial fibrosis.
4. DISCUSSION
DUET increases the ability of computational models as well as pathologists to recognize the presence and extent of collagen deposition. Using our automated collagen segmentation and quantification method, Deep-DUET, we demonstrate the ability to quickly render precise assessments of collagen matrix in an image region. In our ongoing work with this dataset, we plan to extend predictions to the WSI level, combine image inputs to maximize the added information from both brightfield and fluorescence images, and explore the application of this imaging approach to other histological markers of disease.
Virtual staining has garnered a great deal of attention in recent years for various applications in digital pathology. One of the important contributions of DUET towards this goal is the direct pixel-matching of fluorescence and brightfield images in order to establish a verifiable ground truth for collagen. In previous works, DUET has outperformed traditional trichrome staining in its fidelity and reproducibility6. The use of DUET for generating ground truth data for DL models helps reduce the number of variables that are incurred using traditional brightfield imaging of trichrome stained tissue as fundamental tissue properties are used to determine collagen localization. More importantly, DUET can identify pure collagen signal from fluorescence image with fine spatial structure which can be used to automatically estimate fibrosis score and with deep learning algorithms to predict patient outcome.
ACKNOWLEDGEMENT
This project was supported by NIH-NIDDK grant R01DK131189.
REFERENCES
- [1].Liu Y: Renal fibrosis: new insights into the pathogenesis and therapeutics. Kidney international 2006, 69:213–7. [DOI] [PubMed] [Google Scholar]
- [2].El Nahas AM, Muchaneta-Kubara EC, Essaway M, Soylemezoglu O: Renal fibrosis: insights into pathogenesis and treatment. The international journal of biochemistry & cell biology 1997, 29:55–62. [DOI] [PubMed] [Google Scholar]
- [3].Eitner F, Floege J: Novel insights into renal fibrosis. Current opinion in nephrology and hypertension 2003, 12:227–32. [DOI] [PubMed] [Google Scholar]
- [4].Eddy AA: Molecular basis of renal fibrosis. Pediatric nephrology 2000, 15:290–301. [DOI] [PubMed] [Google Scholar]
- [5].Iwano M, Neilson EG: Mechanisms of tubulointerstitial fibrosis. Current opinion in nephrology and hypertension 2004, 13:279–84. [DOI] [PubMed] [Google Scholar]
- [6].Fereidouni F, Todd A, Li Y, Chang C-W, Luong K, Rosenberg A, Lee Y-J, Chan JW, Borowsky A, Matsukuma K: Dual-mode emission and transmission microscopy for virtual histochemistry using hematoxylin-and eosin-stained tissue sections. Biomedical Optics Express 2019, 10:6516–30. [DOI] [PMC free article] [PubMed] [Google Scholar]
- [7].Fereidouni F, Levenson R: Beyond brightfield: a possible future of slide scanners. Future Science, 2020. pp. 5–6. [DOI] [PMC free article] [PubMed] [Google Scholar]
- [8].Fereidouni F, Bader AN, Gerritsen HC: Spectral phasor analysis allows rapid and reliable unmixing of fluorescence microscopy spectral images. Optics express 2012, 20:12729–41. [DOI] [PubMed] [Google Scholar]
- [9].Buslaev A, Iglovikov VI, Khvedchenya E, Parinov A, Druzhinin M, Kalinin AA: Albumentations: Fast and Flexible Image Augmentations. Information 2020, 11. [Google Scholar]
- [10].Iakubovskii P: Segmentation Models Pytorch. Github repository 2019. [Google Scholar]
- [11].Nangaku M: Chronic hypoxia and tubulointerstitial injury: a final common pathway to end-stage renal failure. Journal of the American Society of Nephrology 2006, 17:17–25. [DOI] [PubMed] [Google Scholar]


