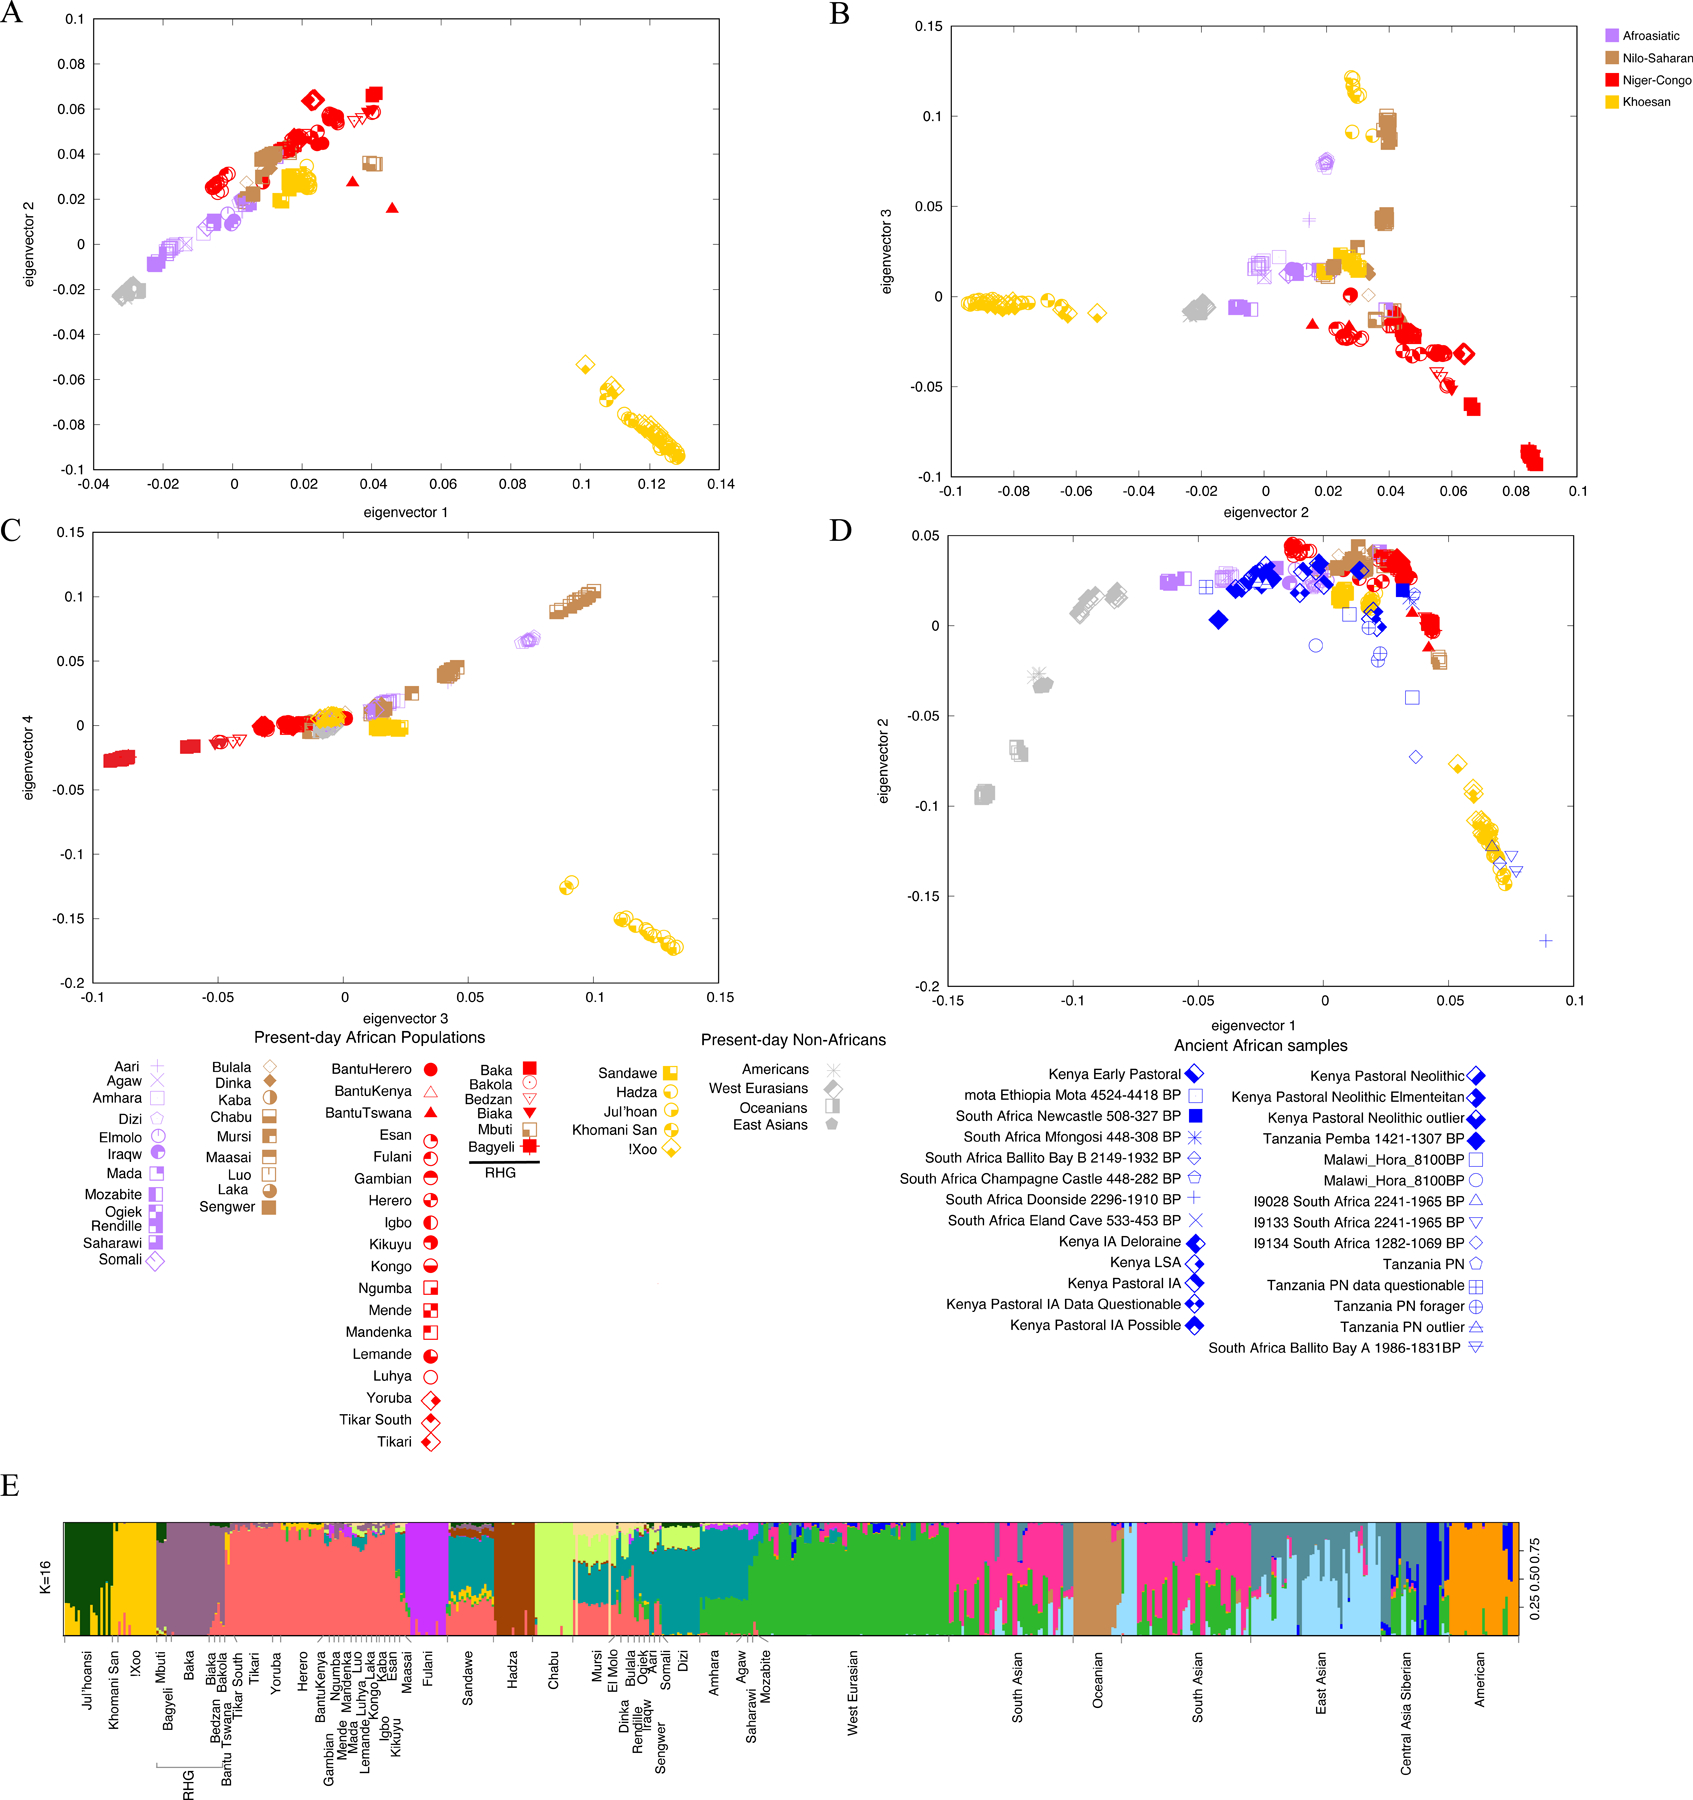
Figure 3. Population structural analyses based on principal component analysis (PCA) and ADMIXTURE.

A-C: PCA of modern human populations from the present study with the SGDP.105
D: Projection of ancient samples from previous studies34,93,97,98 onto PCs 1 and 2. Points are individuals and colors indicate language classification (purple Afroasiatic, brown Nilo-Saharan, red Niger-Congo, and yellow Khoesan).
E: ADMIXTURE result for K=16. Bars are individuals and colors indicate ancestry proportions.
