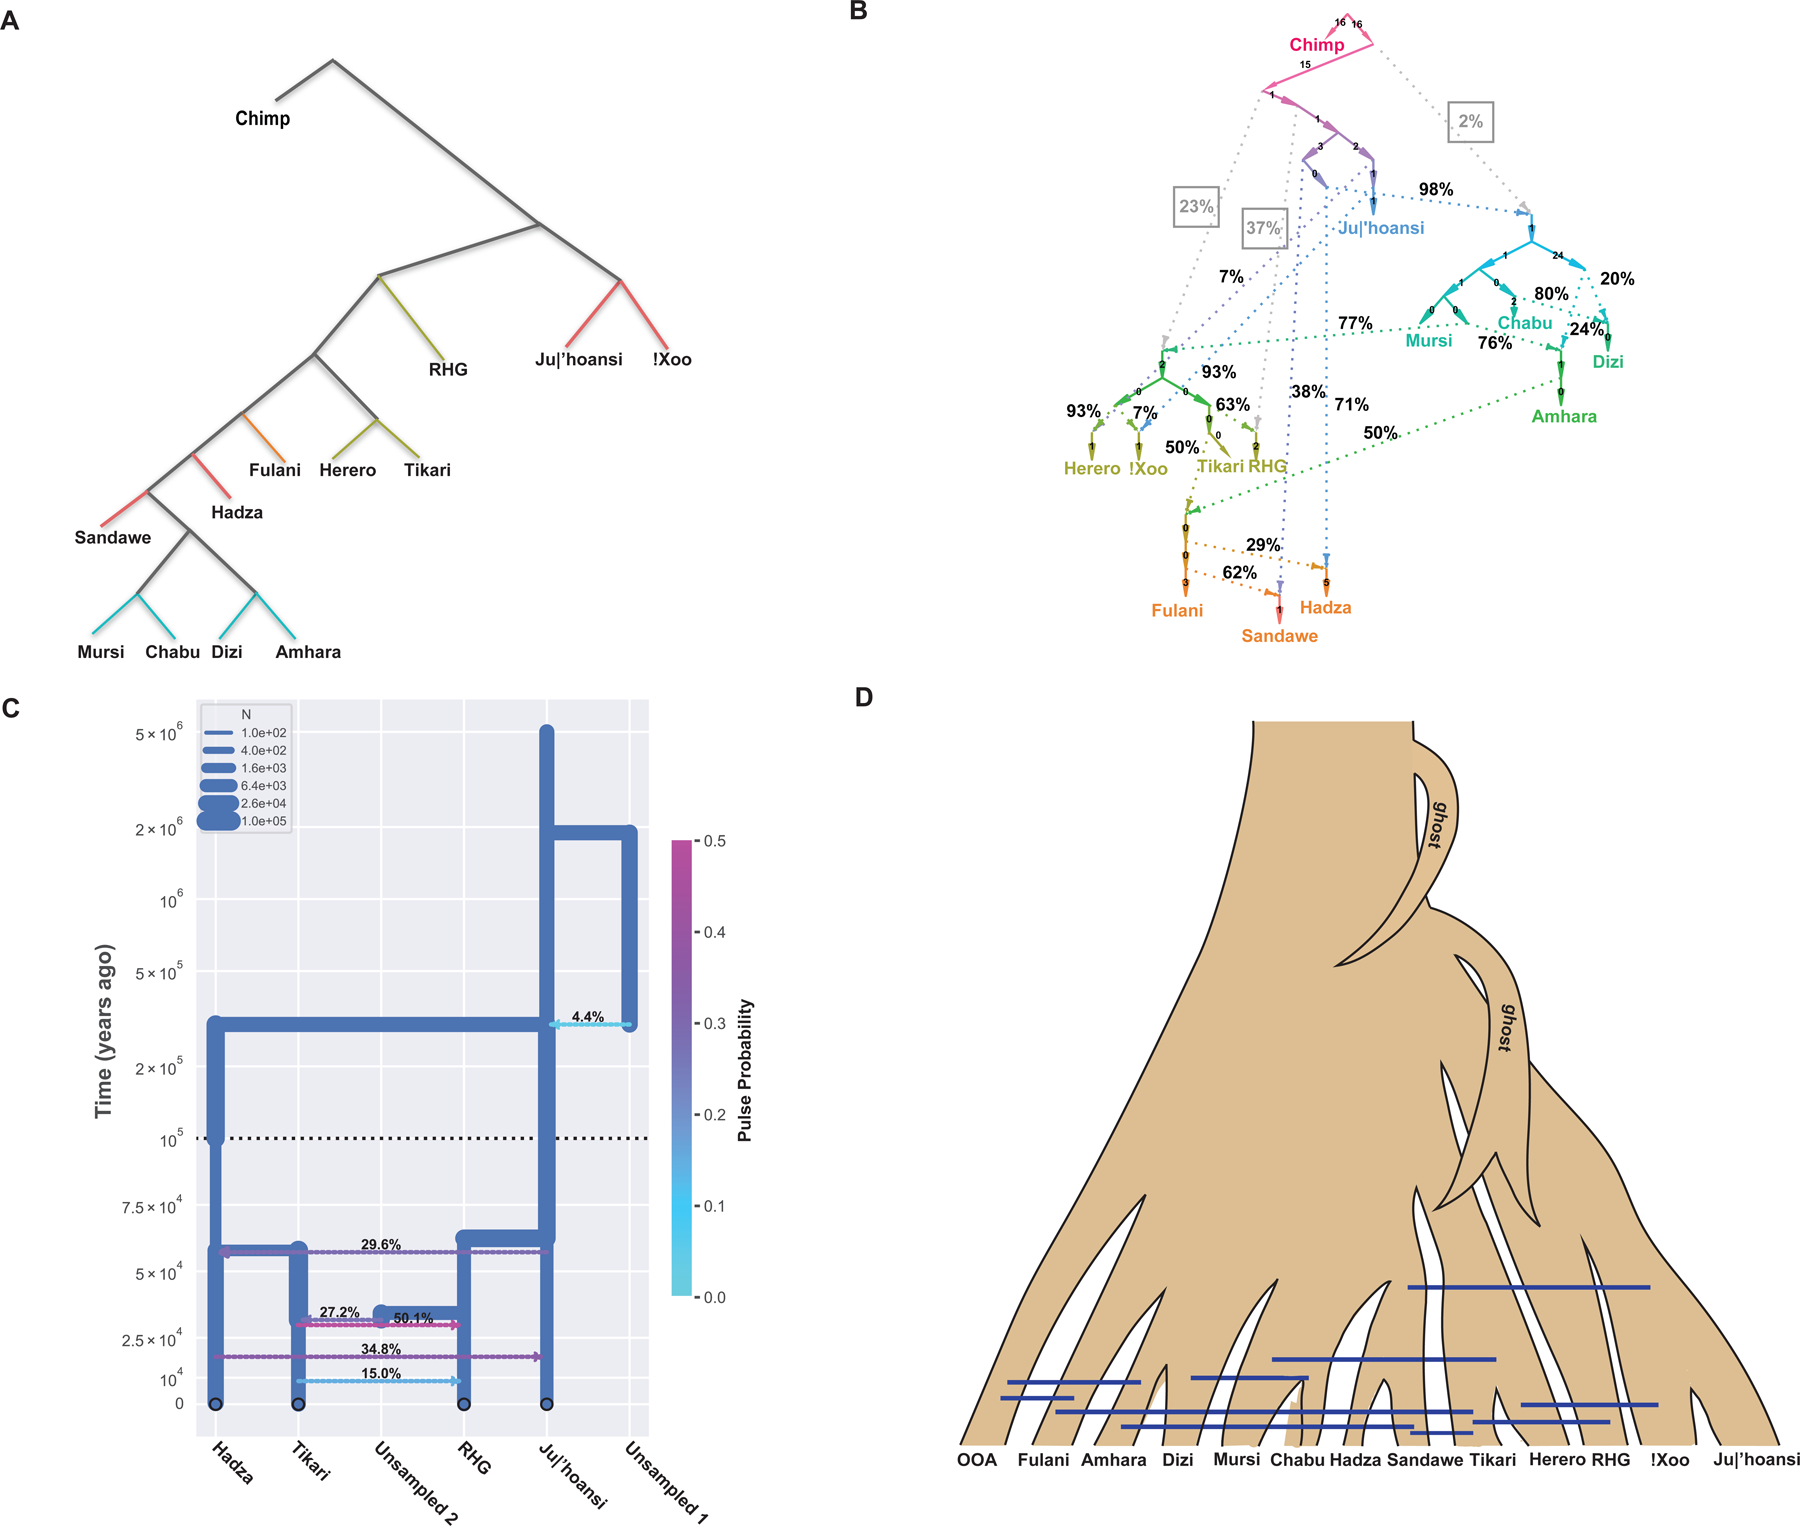
Figure 4. Demographic history of African populations modeled by qpgraph and momi.

A: Demographic history without admixture inferred by qpgraph.106
B: Demographic history with 10 admixture events inferred by qpgraph.106 Percentages on the dashed lines show ancestry proportions from the two source populations. Numbers on solid lines are inferred drift lengths. The percentages of archaic ancestries are boxed and highlighted in grey.
C: Divergence times and gene flow inferred by momi.107,108 Modeling San and RHG as a sister clade consistently had the highest likelihood compared to other topologies.
D: Summarization of the results of demographic analyses. Blue bars show inferred gene flow among modern human populations. OOA: out of Africa populations. Ghost: inferred introgression from a ghost population. We observe evidence of introgression from a deeply diverged population into the ancestor of all modern human populations. In addition, the Bantu-speaking and RHG populations show some ancestry that is very old, possibly reflecting subsequent introgression with a deeply diverged population.
