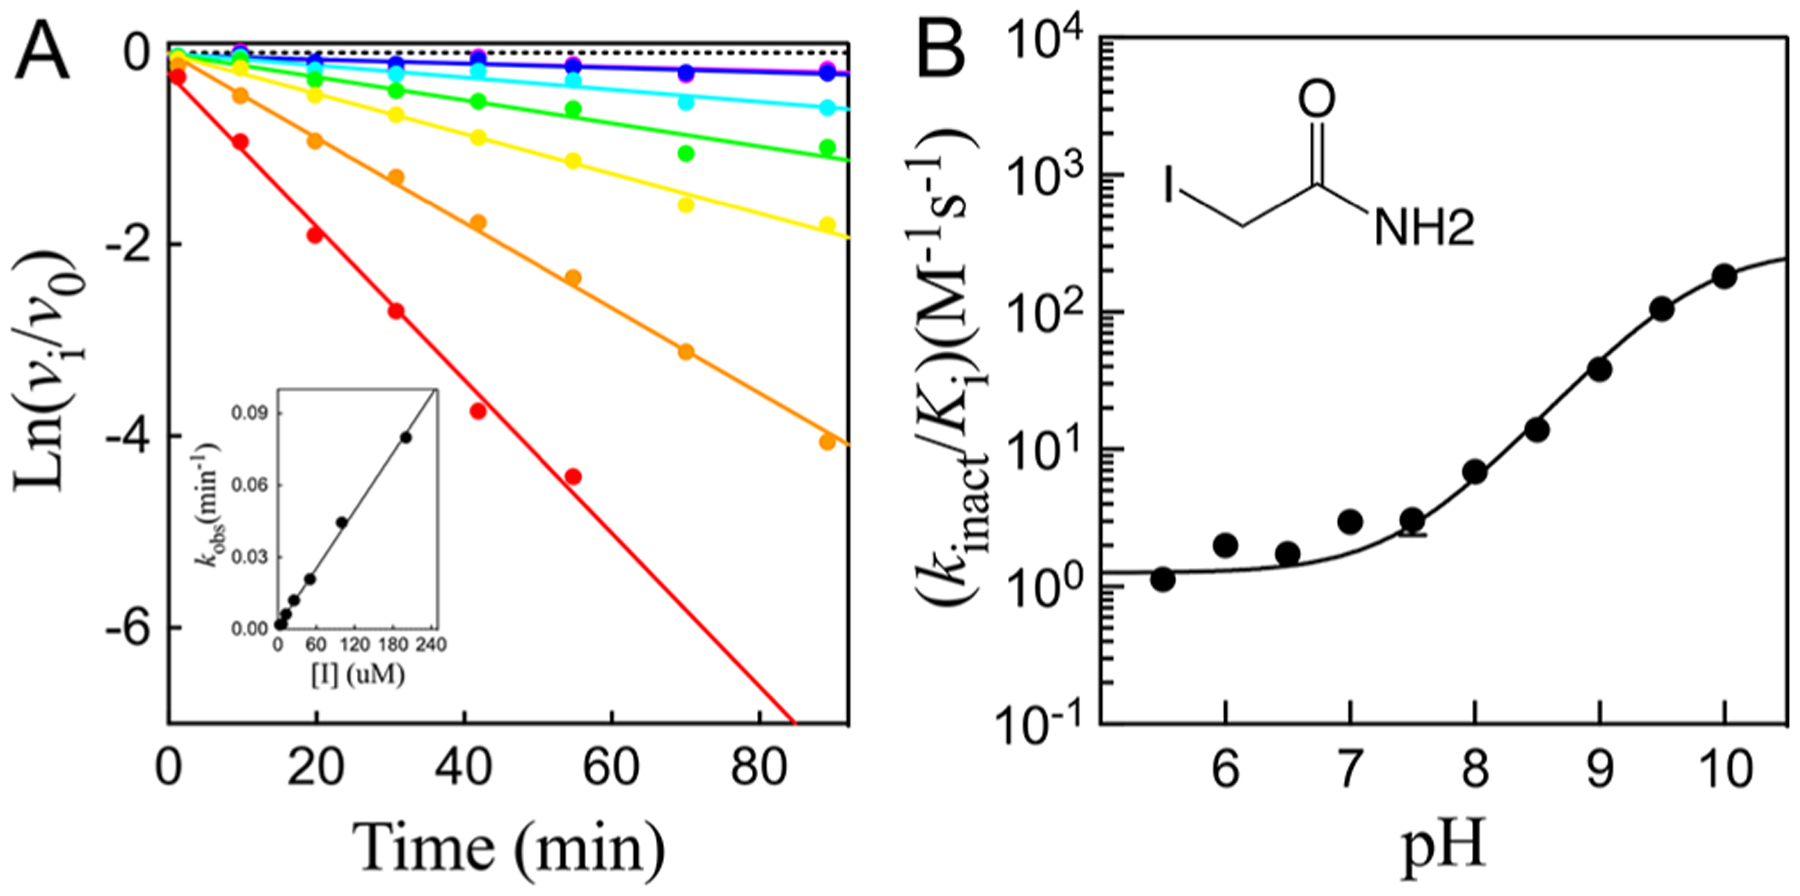
Figure 4.

(A) Representative data of the time-dependent inactivation of cruzain by iodoacetamide at pH 8.0. Lines drawn through the experimental data were from fitting to eq 2. The inset displays a replot of the inactivation rate vs iodoacetamide concentration, and the line drawn through the experimental data points was obtained from fitting to eq 3a. (B) pH dependence of the second-order rate constant for cruzain inactivation by iodoacetamide (0–1 mM). The line drawn through the experimental data was obtained by fitting of the data to eq 13.
